Deck 32: The Fed Model: Linking Interest Rates, Output, and Inflation
ملء الشاشة (f)
سؤال
سؤال
سؤال
سؤال
سؤال
سؤال
سؤال
سؤال
سؤال
سؤال
سؤال
سؤال
سؤال
سؤال
سؤال
سؤال
سؤال
سؤال
سؤال
سؤال
سؤال
سؤال
سؤال
سؤال
سؤال
سؤال
سؤال
سؤال
سؤال
سؤال
سؤال
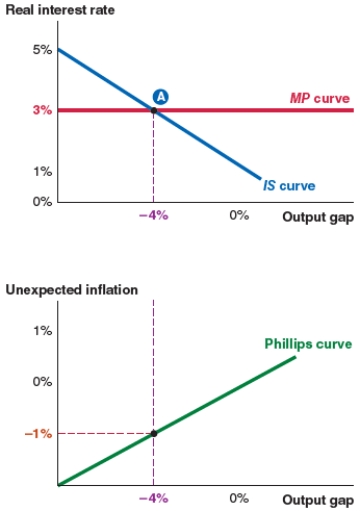
Take a look at the IS-MP-PC model shown here. If a spending shock causes the IS curve to shift right until the output gap is 0%, what will the new equilibrium real interest rate be?
A)5%.
B)3%.
C)-4%.
D)0%.
A)5%.
B)3%.
C)-4%.
D)0%.
سؤال
Take a look at the IS-MP-PC model shown here. The equilibrium real interest rate is:

A)5%.
B)3%.
C)-4%.
D)-1%.
A)5%.
B)3%.
C)-4%.
D)-1%.
سؤال
Take a look at the IS-MP-PC model shown here. At equilibrium, the output gap is:

A)5%.
B)3%.
C)-4%.
D)-1%.
A)5%.
B)3%.
C)-4%.
D)-1%.
سؤال
Take a look at the IS-MP-PC model shown here. At equilibrium, unexpected inflation is:

A)5%.
B)3%.
C)-4%.
D)-1%.
A)5%.
B)3%.
C)-4%.
D)-1%.
سؤال
Take a look at the IS-MP-PC model shown here. If the expected inflation rate is 2%, the actual inflation rate is:

A)1%.
B)-1%.
C)3%.
D)2%.
A)1%.
B)-1%.
C)3%.
D)2%.
سؤال
Take a look at the IS-MP-PC model shown here. If the expected inflation rate is 2.5%, the actual inflation rate is:

A)2.5%.
B)1.5%.
C)-1.5%.
D)-2.5%.
A)2.5%.
B)1.5%.
C)-1.5%.
D)-2.5%.
سؤال
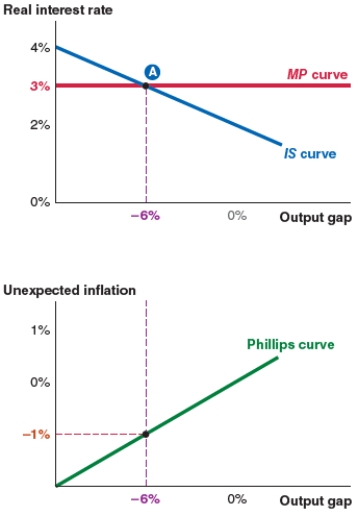
Take a look at the IS-MP-PC model shown here. The equilibrium real interest rate is:
A)4%.
B)3%.
C)2%.
D)-1%.
A)4%.
B)3%.
C)2%.
D)-1%.
سؤال
Take a look at the IS-MP-PC model shown here. At equilibrium, the output gap is:

A)4%.
B)3%.
C)-6%.
D)-1%.
A)4%.
B)3%.
C)-6%.
D)-1%.
سؤال
Take a look at the IS-MP-PC model shown here. If the expected inflation rate is 1.75%, the actual inflation rate is:

A)0.75%.
B)-0.75%.
C)1.75%.
D)2.75%.
A)0.75%.
B)-0.75%.
C)1.75%.
D)2.75%.
سؤال
سؤال
سؤال
سؤال
سؤال
سؤال
سؤال
سؤال
سؤال
سؤال
سؤال
سؤال
سؤال
Which of the following graphs correctly represents a decrease in the risk premium on the MP curve?
A)

B)

C)

D)

A)
B)
C)
D)
سؤال
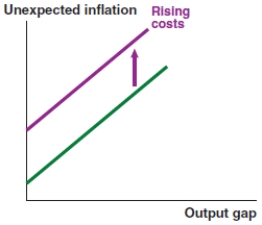
Which of the following graphs correctly represents a negative supply shock on the Phillips curve?
A)

B)

C)

D)

A)
B)
C)
D)
سؤال
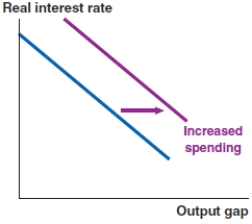
Which of the following graphs correctly represents a positive spending shock on the IS curve?
A)

B)

C)

D)

A)
B)
C)
D)
سؤال
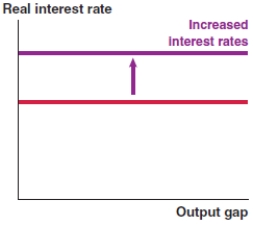
Which of the following graphs correctly represents an increase in the risk premium on the MP curve?
A)

B)

C)

D)

A)
B)
C)
D)
سؤال
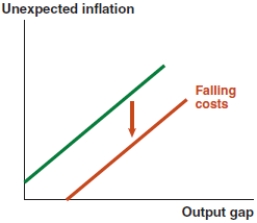
Which of the following graphs correctly represents a positive supply shock on the Phillips curve?
A)

B)

C)

D)
A)
B)
C)
D)
سؤال
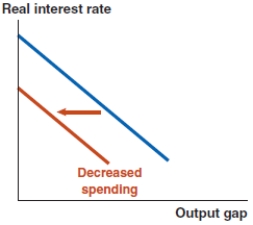
Which of the following graphs correctly represents a negative spending shock on the IS curve?
A)

B)

C)

D)

A)
B)
C)
D)
سؤال
Which of the following graphs correctly represents the effect of increased consumer confidence and spending on the IS curve?
A)
B)

C)

D)

A)
B)
C)
D)
سؤال
If the government lowers corporate taxes, which of the following graphs correctly represents the effect on the IS curve?
A)

B)
C)
D)

A)
B)
C)
D)
سؤال
If the U.S. dollar appreciates, which of the following graphs correctly represents the effect on the IS curve?
A)

B)

C)

D)

A)
B)
C)
D)
سؤال
If the Canadian dollar depreciates, which of the following graphs correctly represents the effect on the IS curve in Canada?
A)

B)

C)

D)

A)
B)
C)
D)
سؤال
If the default risk rises in Greece, which of the following graphs correctly represents the effect on the MP curve in Greece?
A)

B)

C)

D)

A)
B)
C)
D)
سؤال
Which of the following graphs correctly represents the effect on the MP curve if there is a rise in liquidity risk in the United States?
A)

B)

C)

D)

A)
B)
C)
D)
سؤال
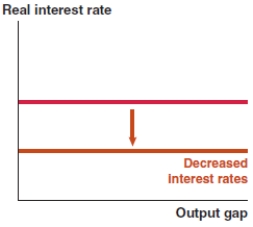
Which of the following graphs correctly represents the effect on the MP curve in Canada if mortgage rates decrease?
A)
B)

C)

D)
A)
B)
C)
D)
سؤال
Which of the following graphs correctly represents the effect on the MP curve if lenders become less risk averse?
A)

B)

C)

D)

A)
B)
C)
D)
سؤال
Which of the following graphs correctly represents the effect on the Phillips curve if there is widespread production technology improvement in Bangladesh?
A)

B)

C)

D)

A)
B)
C)
D)
سؤال
Which of the following graphs correctly represents the effect on the Phillips curve in India if the Indian rupee depreciates?
A)

B)

C)

D)

A)
B)
C)
D)
سؤال
Which of the following graphs correctly represents the effect on the Phillips curve in Ethiopia if the Ethiopian birr appreciates?
A)

B)

C)

D)

A)
B)
C)
D)
سؤال
In 2017, nearly 7.6% of Vietnamese imports were integrated circuits, which are used in the manufacture of electronics. If the price of integrated circuits rises significantly, what effect does this have on the Phillips curve in Vietnam?
A)

B)

C)

D)

A)
B)
C)
D)
سؤال
In 2017, nearly 3.5% of Vietnamese imports constituted of refined oil. If the price of oil rises significantly, what effect does this have on the Phillips curve in Vietnam?
A)

B)

C)

D)

A)
B)
C)
D)
سؤال
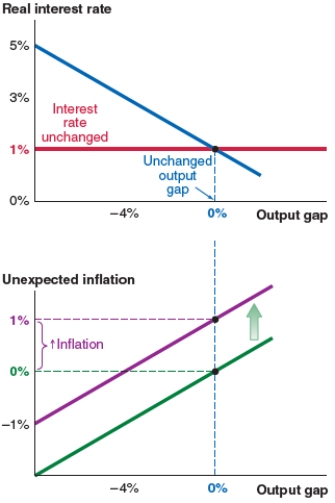
Assume that the economy starts at a 0% output gap. Now suppose that banks begin to fear the risk of default and the risk premium rises by 2%. Which of the following figures shows what happens in this scenario?
Figure A
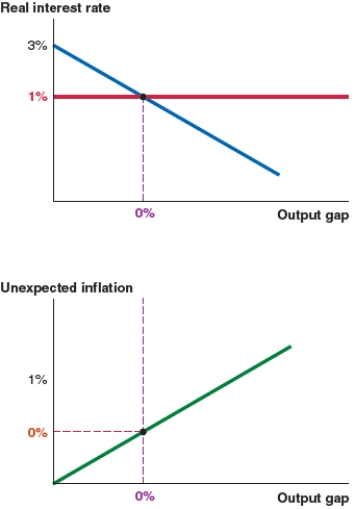
Figure B

Figure C

Figure D
A)Figure A (no change)
B)Figure B (an upward shift of the MP curve and a new interest rate of 3%)
C)Figure C (a leftward shift of the IS curve and an output gap of -4%)
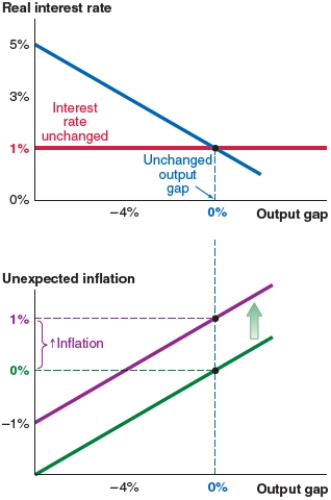
D)Figure D (an upward shift of the Phillips curve and 1% unexpected inflation)
Figure A
Figure B
Figure C
Figure D
A)Figure A (no change)
B)Figure B (an upward shift of the MP curve and a new interest rate of 3%)
C)Figure C (a leftward shift of the IS curve and an output gap of -4%)
D)Figure D (an upward shift of the Phillips curve and 1% unexpected inflation)
سؤال
The economy shown here begins at a 0% output gap. A rise in the risk premium by 2% leads to:

A)a new real interest rate of 3%.
B)unexpected inflation of 1%.
C)a new output gap of 2%.
D)a new real interest rate of 0%.
A)a new real interest rate of 3%.
B)unexpected inflation of 1%.
C)a new output gap of 2%.
D)a new real interest rate of 0%.
سؤال
The economy shown here begins at a 0% output gap. A rise in the risk premium by 2% leads to:
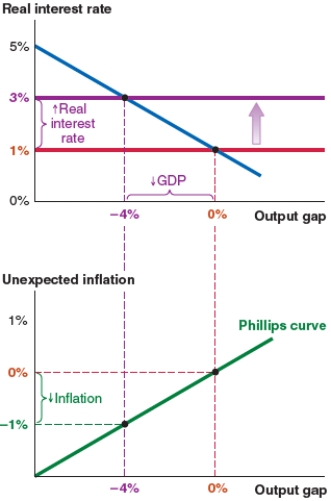
A)unexpected inflation of 0%.
B)unexpected inflation of 1%.
C)a new output gap of -4%.
D)a new real interest rate of 1%.
A)unexpected inflation of 0%.
B)unexpected inflation of 1%.
C)a new output gap of -4%.
D)a new real interest rate of 1%.
سؤال
The economy shown here begins at a 0% output gap. A rise in the risk premium by 2% leads to:

A)unexpected inflation of 0%.
B)unexpected inflation of -1%.
C)a new output gap of 2%.
D)a new real interest rate of 1%.
A)unexpected inflation of 0%.
B)unexpected inflation of -1%.
C)a new output gap of 2%.
D)a new real interest rate of 1%.
سؤال
The economy shown here begins at a 0% output gap. Now suppose that banks begin to fear the risk of default and the risk premium rises by 2%. If inflation expectations remain unchanged, the actual inflation rate will be:

A)2% higher.
B)1% higher.
C)1% lower.
D)4% lower.
A)2% higher.
B)1% higher.
C)1% lower.
D)4% lower.
سؤال
سؤال
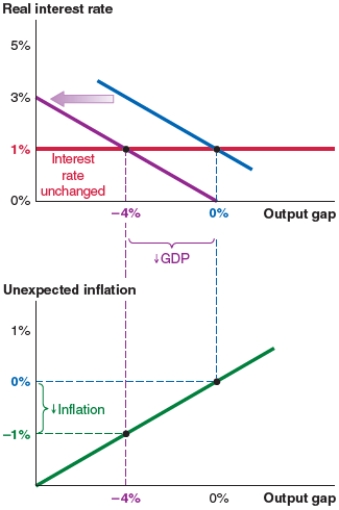
Assume that the economy starts at a 0% output gap. Now suppose that consumers fear a recession and reduce their spending. Based on this scenario, the economy experiences:
Figure A
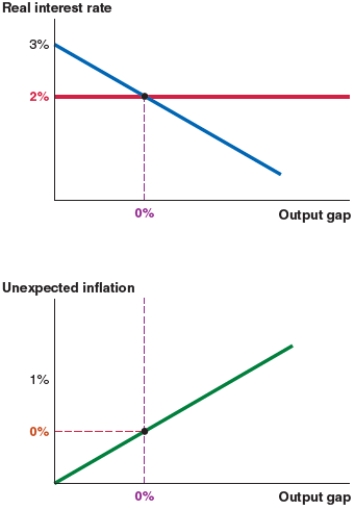
Figure B

Figure C

Figure D
A) no change, as shown in Figure A.
B) an upward shift of the MP curve and a new interest rate of 3%, as shown in Figure B.
C) a leftward shift of the IS curve and an output gap of -4%, as shown in Figure C.
D) an upward shift of the Phillips curve and 1% unexpected inflation, as shown in Figure D.
Figure A
Figure B
Figure C
Figure D
A) no change, as shown in Figure A.
B) an upward shift of the MP curve and a new interest rate of 3%, as shown in Figure B.
C) a leftward shift of the IS curve and an output gap of -4%, as shown in Figure C.
D) an upward shift of the Phillips curve and 1% unexpected inflation, as shown in Figure D.
سؤال
The economy shown here begins at a 0% output gap. Now suppose that consumers fear a recession and reduce their spending. This leads to:

A)a new real interest rate of 3%.
B)unexpected inflation of 1%.
C)a new output gap of -4%.
D)a new real interest rate of 0%.
A)a new real interest rate of 3%.
B)unexpected inflation of 1%.
C)a new output gap of -4%.
D)a new real interest rate of 0%.
سؤال
The economy shown here begins at a 0% output gap. Now suppose that consumers fear a recession and reduce their spending. This leads to:
A)a new real interest rate of 3%.
B)unexpected inflation of 1%.
C)a new output gap of 1%.
D)an unchanged interest rate.
A)a new real interest rate of 3%.
B)unexpected inflation of 1%.
C)a new output gap of 1%.
D)an unchanged interest rate.
سؤال
The economy shown here begins at a 0% output gap. Now suppose that consumers fear a recession and reduce their spending. This leads to:

A)unexpected inflation of 0%.
B)unexpected inflation of -1%.
C)a new output gap of 2%.
D)a new real interest rate of 3%.
A)unexpected inflation of 0%.
B)unexpected inflation of -1%.
C)a new output gap of 2%.
D)a new real interest rate of 3%.

فتح الحزمة
قم بالتسجيل لفتح البطاقات في هذه المجموعة!
Unlock Deck
Unlock Deck
1/125
العب
ملء الشاشة (f)
Deck 32: The Fed Model: Linking Interest Rates, Output, and Inflation
1
The framework that the Federal Reserve uses to analyze, forecast, and adjust the economy is called:
A)the Fed model.
B)the real GDP model.
C)expansionary monetary policy.
D)contractionary monetary policy.
A)the Fed model.
B)the real GDP model.
C)expansionary monetary policy.
D)contractionary monetary policy.
A
2
The Fed model combines the _____ curve, the _____ curve, and the ____ curve to link interest rates, the output gap, and inflation.
A)IS; MP; Phillips
B)AD; AS; Phillips
C)dollar demand; dollar supply; AS
D)demand for loanable funds; supply of loanable funds; AD
A)IS; MP; Phillips
B)AD; AS; Phillips
C)dollar demand; dollar supply; AS
D)demand for loanable funds; supply of loanable funds; AD
A
3
In the IS-MP analysis in the Fed model, the MP curve shows you the:
A)potential GDP level in the economy.
B)output level in the economy.
C)current real interest rate.
D)price level in the economy.
A)potential GDP level in the economy.
B)output level in the economy.
C)current real interest rate.
D)price level in the economy.
C
4
In the IS-MP analysis in the Fed model, the risk-free rate rises in response to:
A)increased capital inflows.
B)adverse supply shocks.
C)fiscal policy.
D)monetary policy.
A)increased capital inflows.
B)adverse supply shocks.
C)fiscal policy.
D)monetary policy.
فتح الحزمة
افتح القفل للوصول البطاقات البالغ عددها 125 في هذه المجموعة.
فتح الحزمة
k this deck
5
In the IS-MP analysis in the Fed model, a rise in the risk-free rate shifts the:
A)IS curve to the left.
B)IS curve to the right.
C)MP curve up.
D)MP curve down.
A)IS curve to the left.
B)IS curve to the right.
C)MP curve up.
D)MP curve down.
فتح الحزمة
افتح القفل للوصول البطاقات البالغ عددها 125 في هذه المجموعة.
فتح الحزمة
k this deck
6
In the IS-MP analysis in the Fed model, a decrease in the risk-free rate shifts the:
A)IS curve to the left.
B)IS curve to the right.
C)MP curve up.
D)MP curve down.
A)IS curve to the left.
B)IS curve to the right.
C)MP curve up.
D)MP curve down.
فتح الحزمة
افتح القفل للوصول البطاقات البالغ عددها 125 في هذه المجموعة.
فتح الحزمة
k this deck
7
In the IS-MP analysis in the Fed model, if the Federal Reserve raises the federal funds rate, the:
A)IS curve shifts to the left.
B)IS curve shifts to the right.
C)MP curve shifts up.
D)MP curve shifts down.
A)IS curve shifts to the left.
B)IS curve shifts to the right.
C)MP curve shifts up.
D)MP curve shifts down.
فتح الحزمة
افتح القفل للوصول البطاقات البالغ عددها 125 في هذه المجموعة.
فتح الحزمة
k this deck
8
In the IS-MP analysis in the Fed model, if the Federal Reserve lowers the federal funds rate, the:
A)IS curve shifts to the left.
B)IS curve shifts to the right.
C)MP curve shifts up.
D)MP curve shifts down.
A)IS curve shifts to the left.
B)IS curve shifts to the right.
C)MP curve shifts up.
D)MP curve shifts down.
فتح الحزمة
افتح القفل للوصول البطاقات البالغ عددها 125 في هذه المجموعة.
فتح الحزمة
k this deck
9
In the IS-MP analysis in the Fed model, a decrease in the risk premium shifts the:
A)IS curve to the left.
B)IS curve to the right.
C)MP curve up.
D)MP curve down.
A)IS curve to the left.
B)IS curve to the right.
C)MP curve up.
D)MP curve down.
فتح الحزمة
افتح القفل للوصول البطاقات البالغ عددها 125 في هذه المجموعة.
فتح الحزمة
k this deck
10
In the IS-MP analysis in the Fed model, a rise in the interest rate causes a:
A)movement to the left along the IS curve.
B)right shift of the IS curve.
C)left shift of the IS curve.
D)movement to the right along the IS curve.
A)movement to the left along the IS curve.
B)right shift of the IS curve.
C)left shift of the IS curve.
D)movement to the right along the IS curve.
فتح الحزمة
افتح القفل للوصول البطاقات البالغ عددها 125 في هذه المجموعة.
فتح الحزمة
k this deck
11
In the IS-MP analysis in the Fed model, a fall in the interest rate causes a:
A)right shift of the IS curve.
B)movement to the left along the IS curve.
C)left shift of the IS curve.
D)movement to the right along the IS curve.
A)right shift of the IS curve.
B)movement to the left along the IS curve.
C)left shift of the IS curve.
D)movement to the right along the IS curve.
فتح الحزمة
افتح القفل للوصول البطاقات البالغ عددها 125 في هذه المجموعة.
فتح الحزمة
k this deck
12
In the IS-MP analysis in the Fed model, the intersection of the IS and MP curves determines the:
A)equilibrium exchange rate.
B)output gap.
C)unemployment rate.
D)potential GDP.
A)equilibrium exchange rate.
B)output gap.
C)unemployment rate.
D)potential GDP.
فتح الحزمة
افتح القفل للوصول البطاقات البالغ عددها 125 في هذه المجموعة.
فتح الحزمة
k this deck
13
In the IS-MP analysis in the Fed model, a fall in government expenditure will shift the:
A)IS curve to the left.
B)IS curve to the right.
C)MP curve up.
D)MP curve down.
A)IS curve to the left.
B)IS curve to the right.
C)MP curve up.
D)MP curve down.
فتح الحزمة
افتح القفل للوصول البطاقات البالغ عددها 125 في هذه المجموعة.
فتح الحزمة
k this deck
14
In the IS-MP analysis in the Fed model, a rise in government expenditure will shift the:
A)IS curve to the left.
B)IS curve to the right.
C)MP curve up.
D)MP curve down.
A)IS curve to the left.
B)IS curve to the right.
C)MP curve up.
D)MP curve down.
فتح الحزمة
افتح القفل للوصول البطاقات البالغ عددها 125 في هذه المجموعة.
فتح الحزمة
k this deck
15
In the IS-MP analysis in the Fed model, a rise in investment will shift the:
A)IS curve to the left.
B)IS curve to the right.
C)MP curve up.
D)MP curve down.
A)IS curve to the left.
B)IS curve to the right.
C)MP curve up.
D)MP curve down.
فتح الحزمة
افتح القفل للوصول البطاقات البالغ عددها 125 في هذه المجموعة.
فتح الحزمة
k this deck
16
In the IS-MP analysis in the Fed model, a fall in investment will shift the:
A)IS curve to the left.
B)IS curve to the right.
C)MP curve up.
D)MP curve down.
A)IS curve to the left.
B)IS curve to the right.
C)MP curve up.
D)MP curve down.
فتح الحزمة
افتح القفل للوصول البطاقات البالغ عددها 125 في هذه المجموعة.
فتح الحزمة
k this deck
17
In the IS-MP analysis in the Fed model, expansionary fiscal policy will shift the:
A)IS curve to the left.
B)IS curve to the right.
C)MP curve up.
D)MP curve down.
A)IS curve to the left.
B)IS curve to the right.
C)MP curve up.
D)MP curve down.
فتح الحزمة
افتح القفل للوصول البطاقات البالغ عددها 125 في هذه المجموعة.
فتح الحزمة
k this deck
18
In the IS-MP analysis in the Fed model, contractionary fiscal policy will shift the:
A)IS curve to the left.
B)IS curve to the right.
C)MP curve up.
D)MP curve down.
A)IS curve to the left.
B)IS curve to the right.
C)MP curve up.
D)MP curve down.
فتح الحزمة
افتح القفل للوصول البطاقات البالغ عددها 125 في هذه المجموعة.
فتح الحزمة
k this deck
19
In the IS-MP analysis in the Fed model, an increase in imports will shift the:
A)MP curve up.
B)MP curve down.
C)IS curve to the left.
D)IS curve to the right.
A)MP curve up.
B)MP curve down.
C)IS curve to the left.
D)IS curve to the right.
فتح الحزمة
افتح القفل للوصول البطاقات البالغ عددها 125 في هذه المجموعة.
فتح الحزمة
k this deck
20
In the IS-MP analysis in the Fed model, a decrease in imports will shift the:
A)MP curve up.
B)MP curve down.
C)IS curve to the left.
D)IS curve to the right.
A)MP curve up.
B)MP curve down.
C)IS curve to the left.
D)IS curve to the right.
فتح الحزمة
افتح القفل للوصول البطاقات البالغ عددها 125 في هذه المجموعة.
فتح الحزمة
k this deck
21
The Fed model links the IS, MP, and Phillips curves. In the IS-MP analysis, an increase in exports will shift the:
A)MP curve up.
B)MP curve down.
C)IS curve to the left.
D)IS curve to the right.
A)MP curve up.
B)MP curve down.
C)IS curve to the left.
D)IS curve to the right.
فتح الحزمة
افتح القفل للوصول البطاقات البالغ عددها 125 في هذه المجموعة.
فتح الحزمة
k this deck
22
In the IS-MP analysis in the Fed model, a decrease in exports will shift the:
A)MP curve up.
B)MP curve down.
C)IS curve to the left.
D)IS curve to the right.
A)MP curve up.
B)MP curve down.
C)IS curve to the left.
D)IS curve to the right.
فتح الحزمة
افتح القفل للوصول البطاقات البالغ عددها 125 في هذه المجموعة.
فتح الحزمة
k this deck
23
In the IS-MP analysis in the Fed model, an increase in net exports will shift the:
A)MP curve up.
B)MP curve down.
C)IS curve to the left.
D)IS curve to the right.
A)MP curve up.
B)MP curve down.
C)IS curve to the left.
D)IS curve to the right.
فتح الحزمة
افتح القفل للوصول البطاقات البالغ عددها 125 في هذه المجموعة.
فتح الحزمة
k this deck
24
In the IS-MP analysis in the Fed model, a decrease in net exports will shift the:
A)MP curve up.
B)MP curve down.
C)IS curve to the left.
D)IS curve to the right.
A)MP curve up.
B)MP curve down.
C)IS curve to the left.
D)IS curve to the right.
فتح الحزمة
افتح القفل للوصول البطاقات البالغ عددها 125 في هذه المجموعة.
فتح الحزمة
k this deck
25
When using the Fed model, the first step is to:
A)find the output gap.
B)assess inflation.
C)identify the shock and shift the curve.
D)increase the federal funds rate.
A)find the output gap.
B)assess inflation.
C)identify the shock and shift the curve.
D)increase the federal funds rate.
فتح الحزمة
افتح القفل للوصول البطاقات البالغ عددها 125 في هذه المجموعة.
فتح الحزمة
k this deck
26
Once you have identified the point of equilibrium in the IS-MP graph in the Fed model, the vertical axis will show you the:
A)actual inflation.
B)unexpected inflation.
C)output gap.
D)equilibrium real interest rate.
A)actual inflation.
B)unexpected inflation.
C)output gap.
D)equilibrium real interest rate.
فتح الحزمة
افتح القفل للوصول البطاقات البالغ عددها 125 في هذه المجموعة.
فتح الحزمة
k this deck
27
Once you have identified the point of equilibrium in the IS-MP graph in the Fed model, the horizontal axis will show you the:
A)actual inflation.
B)unexpected inflation.
C)output gap.
D)equilibrium real interest rate.
A)actual inflation.
B)unexpected inflation.
C)output gap.
D)equilibrium real interest rate.
فتح الحزمة
افتح القفل للوصول البطاقات البالغ عددها 125 في هذه المجموعة.
فتح الحزمة
k this deck
28
Once you have identified the output gap in the IS-MP graph in the Fed model, how would you connect to the Phillips curve?
A)Trace the inflation rate from the IS-MP model down to the same inflation rate in the Phillips curve.
B)Trace the real interest rate from the IS-MP model down to the same real interest rate in the Phillips curve.
C)Trace the unemployment rate from the IS-MP model down to the same unemployment gap in the Phillips curve.
D)Trace the output gap from the IS-MP model down to the same output gap in the Phillips curve.
فتح الحزمة
افتح القفل للوصول البطاقات البالغ عددها 125 في هذه المجموعة.
فتح الحزمة
k this deck
29
Once you have connected the output gaps from the IS-MP model and the Phillips curve, the next step is to identify the:
A)price level from the Phillips curve.
B)unexpected inflation from the Phillips curve.
C)potential GDP level.
D)unemployment rate from the labor market.
A)price level from the Phillips curve.
B)unexpected inflation from the Phillips curve.
C)potential GDP level.
D)unemployment rate from the labor market.
فتح الحزمة
افتح القفل للوصول البطاقات البالغ عددها 125 في هذه المجموعة.
فتح الحزمة
k this deck
30
Once you have identified the unexpected inflation from the Phillips curve:
A)add the nominal interest rate to arrive at the real interest rate.
B)equate it to the actual inflation rate.
C)add the expected inflation rate to get the actual inflation rate.
D)subtract the expected inflation rate to get the actual inflation rate.
A)add the nominal interest rate to arrive at the real interest rate.
B)equate it to the actual inflation rate.
C)add the expected inflation rate to get the actual inflation rate.
D)subtract the expected inflation rate to get the actual inflation rate.
فتح الحزمة
افتح القفل للوصول البطاقات البالغ عددها 125 في هذه المجموعة.
فتح الحزمة
k this deck
31
Take a look at the IS-MP-PC model shown here. If a spending shock causes the IS curve to shift right until the output gap is 0%, what will the new equilibrium real interest rate be?
A)5%.
B)3%.
C)-4%.
D)0%.
A)5%.
B)3%.
C)-4%.
D)0%.
فتح الحزمة
افتح القفل للوصول البطاقات البالغ عددها 125 في هذه المجموعة.
فتح الحزمة
k this deck
32
Take a look at the IS-MP-PC model shown here. The equilibrium real interest rate is:
A)5%.
B)3%.
C)-4%.
D)-1%.
A)5%.
B)3%.
C)-4%.
D)-1%.
فتح الحزمة
افتح القفل للوصول البطاقات البالغ عددها 125 في هذه المجموعة.
فتح الحزمة
k this deck
33
Take a look at the IS-MP-PC model shown here. At equilibrium, the output gap is:
A)5%.
B)3%.
C)-4%.
D)-1%.
A)5%.
B)3%.
C)-4%.
D)-1%.
فتح الحزمة
افتح القفل للوصول البطاقات البالغ عددها 125 في هذه المجموعة.
فتح الحزمة
k this deck
34
Take a look at the IS-MP-PC model shown here. At equilibrium, unexpected inflation is:
A)5%.
B)3%.
C)-4%.
D)-1%.
A)5%.
B)3%.
C)-4%.
D)-1%.
فتح الحزمة
افتح القفل للوصول البطاقات البالغ عددها 125 في هذه المجموعة.
فتح الحزمة
k this deck
35
Take a look at the IS-MP-PC model shown here. If the expected inflation rate is 2%, the actual inflation rate is:
A)1%.
B)-1%.
C)3%.
D)2%.
A)1%.
B)-1%.
C)3%.
D)2%.
فتح الحزمة
افتح القفل للوصول البطاقات البالغ عددها 125 في هذه المجموعة.
فتح الحزمة
k this deck
36
Take a look at the IS-MP-PC model shown here. If the expected inflation rate is 2.5%, the actual inflation rate is:
A)2.5%.
B)1.5%.
C)-1.5%.
D)-2.5%.
A)2.5%.
B)1.5%.
C)-1.5%.
D)-2.5%.
فتح الحزمة
افتح القفل للوصول البطاقات البالغ عددها 125 في هذه المجموعة.
فتح الحزمة
k this deck
37
Take a look at the IS-MP-PC model shown here. The equilibrium real interest rate is:
A)4%.
B)3%.
C)2%.
D)-1%.
A)4%.
B)3%.
C)2%.
D)-1%.
فتح الحزمة
افتح القفل للوصول البطاقات البالغ عددها 125 في هذه المجموعة.
فتح الحزمة
k this deck
38
Take a look at the IS-MP-PC model shown here. At equilibrium, the output gap is:
A)4%.
B)3%.
C)-6%.
D)-1%.
A)4%.
B)3%.
C)-6%.
D)-1%.
فتح الحزمة
افتح القفل للوصول البطاقات البالغ عددها 125 في هذه المجموعة.
فتح الحزمة
k this deck
39
Take a look at the IS-MP-PC model shown here. If the expected inflation rate is 1.75%, the actual inflation rate is:
A)0.75%.
B)-0.75%.
C)1.75%.
D)2.75%.
A)0.75%.
B)-0.75%.
C)1.75%.
D)2.75%.
فتح الحزمة
افتح القفل للوصول البطاقات البالغ عددها 125 في هذه المجموعة.
فتح الحزمة
k this deck
40
If you see a newspaper headline that says "Oil prices rise sharply," this is an example of _____ shock.
A)a spending
B)an interest rate
C)a financial
D)a supply
A)a spending
B)an interest rate
C)a financial
D)a supply
فتح الحزمة
افتح القفل للوصول البطاقات البالغ عددها 125 في هذه المجموعة.
فتح الحزمة
k this deck
41
If you see a newspaper headline that says "Consumer spending booms," this is an example of _____ shock.
A)a spending
B)an interest rate
C)a financial
D)a supply
A)a spending
B)an interest rate
C)a financial
D)a supply
فتح الحزمة
افتح القفل للوصول البطاقات البالغ عددها 125 في هذه المجموعة.
فتح الحزمة
k this deck
42
If you see a newspaper headline that says "Consumer confidence falls as stock market plummets 1,500 points," this is an example of _____ shock.
A)a spending
B)an interest rate
C)a financial
D)a supply
A)a spending
B)an interest rate
C)a financial
D)a supply
فتح الحزمة
افتح القفل للوصول البطاقات البالغ عددها 125 في هذه المجموعة.
فتح الحزمة
k this deck
43
If you see a newspaper headline that says "Steel prices rise sharply," this is an example of _____ shock.
A)a spending
B)an interest rate
C)a financial
D)a supply
A)a spending
B)an interest rate
C)a financial
D)a supply
فتح الحزمة
افتح القفل للوصول البطاقات البالغ عددها 125 في هذه المجموعة.
فتح الحزمة
k this deck
44
If you see a newspaper headline that says "Banks shut doors - depositors scrambling to get their money back," this is an example of _____ shock.
A)a spending
B)an interest rate
C)a financial
D)a supply
A)a spending
B)an interest rate
C)a financial
D)a supply
فتح الحزمة
افتح القفل للوصول البطاقات البالغ عددها 125 في هذه المجموعة.
فتح الحزمة
k this deck
45
If you see a newspaper headline that says "U.S. exports plunge," this is an example of _____ shock.
A)a spending
B)an interest rate
C)a financial
D)a supply
A)a spending
B)an interest rate
C)a financial
D)a supply
فتح الحزمة
افتح القفل للوصول البطاقات البالغ عددها 125 في هذه المجموعة.
فتح الحزمة
k this deck
46
A spending shock is any change in:
A)aggregate expenditure at a given interest rate and level of income.
B)borrowing conditions that changes the real interest rate at which people can borrow.
C)production costs that leads suppliers to change the prices they charge at any given level of output.
D)potential GDP in the economy.
A)aggregate expenditure at a given interest rate and level of income.
B)borrowing conditions that changes the real interest rate at which people can borrow.
C)production costs that leads suppliers to change the prices they charge at any given level of output.
D)potential GDP in the economy.
فتح الحزمة
افتح القفل للوصول البطاقات البالغ عددها 125 في هذه المجموعة.
فتح الحزمة
k this deck
47
A financial shock is any change in:
A)aggregate expenditure, at a given interest rate and level of income.
B)borrowing conditions that changes the real interest rate at which people can borrow.
C)production costs that leads suppliers to change the prices they charge at any given level of output.
D)potential GDP in the economy.
A)aggregate expenditure, at a given interest rate and level of income.
B)borrowing conditions that changes the real interest rate at which people can borrow.
C)production costs that leads suppliers to change the prices they charge at any given level of output.
D)potential GDP in the economy.
فتح الحزمة
افتح القفل للوصول البطاقات البالغ عددها 125 في هذه المجموعة.
فتح الحزمة
k this deck
48
A supply shock is any change in:
A)aggregate expenditure at a given interest rate and level of income.
B)borrowing conditions that changes the real interest rate at which people can borrow.
C)production costs that leads suppliers to change the prices they charge at any given level of output.
D)potential GDP in the economy.
A)aggregate expenditure at a given interest rate and level of income.
B)borrowing conditions that changes the real interest rate at which people can borrow.
C)production costs that leads suppliers to change the prices they charge at any given level of output.
D)potential GDP in the economy.
فتح الحزمة
افتح القفل للوصول البطاقات البالغ عددها 125 في هذه المجموعة.
فتح الحزمة
k this deck
49
The first step in analyzing a macroeconomic shock is to:
A)assess inflation.
B)find the output gap.
C)identify the shock and shift the curve.
D)forecast future GDP growth.
A)assess inflation.
B)find the output gap.
C)identify the shock and shift the curve.
D)forecast future GDP growth.
فتح الحزمة
افتح القفل للوصول البطاقات البالغ عددها 125 في هذه المجموعة.
فتح الحزمة
k this deck
50
The second step in analyzing a macroeconomic shock is to:
A)assess inflation.
B)find the output gap.
C)identify the shock and shift the curve.
D)forecast future GDP growth.
A)assess inflation.
B)find the output gap.
C)identify the shock and shift the curve.
D)forecast future GDP growth.
فتح الحزمة
افتح القفل للوصول البطاقات البالغ عددها 125 في هذه المجموعة.
فتح الحزمة
k this deck
51
The third step in analyzing a macroeconomic shock is to:
A)assess inflation.
B)find the output gap.
C)identify the shock and shift the curve.
D)forecast future GDP growth.
A)assess inflation.
B)find the output gap.
C)identify the shock and shift the curve.
D)forecast future GDP growth.
فتح الحزمة
افتح القفل للوصول البطاقات البالغ عددها 125 في هذه المجموعة.
فتح الحزمة
k this deck
52
Which of the following graphs correctly represents a decrease in the risk premium on the MP curve?
A)
B)
C)
D)
A)
B)
C)
D)
فتح الحزمة
افتح القفل للوصول البطاقات البالغ عددها 125 في هذه المجموعة.
فتح الحزمة
k this deck
53
Which of the following graphs correctly represents a negative supply shock on the Phillips curve?
A)
B)
C)
D)
A)
B)
C)
D)
فتح الحزمة
افتح القفل للوصول البطاقات البالغ عددها 125 في هذه المجموعة.
فتح الحزمة
k this deck
54
Which of the following graphs correctly represents a positive spending shock on the IS curve?
A)
B)
C)
D)
A)
B)
C)
D)
فتح الحزمة
افتح القفل للوصول البطاقات البالغ عددها 125 في هذه المجموعة.
فتح الحزمة
k this deck
55
Which of the following graphs correctly represents an increase in the risk premium on the MP curve?
A)
B)
C)
D)
A)
B)
C)
D)
فتح الحزمة
افتح القفل للوصول البطاقات البالغ عددها 125 في هذه المجموعة.
فتح الحزمة
k this deck
56
Which of the following graphs correctly represents a positive supply shock on the Phillips curve?
A)
B)
C)
D)
A)
B)
C)
D)
فتح الحزمة
افتح القفل للوصول البطاقات البالغ عددها 125 في هذه المجموعة.
فتح الحزمة
k this deck
57
Which of the following graphs correctly represents a negative spending shock on the IS curve?
A)
B)
C)
D)
A)
B)
C)
D)
فتح الحزمة
افتح القفل للوصول البطاقات البالغ عددها 125 في هذه المجموعة.
فتح الحزمة
k this deck
58
Which of the following graphs correctly represents the effect of increased consumer confidence and spending on the IS curve?
A)
B)
C)
D)
A)
B)
C)
D)
فتح الحزمة
افتح القفل للوصول البطاقات البالغ عددها 125 في هذه المجموعة.
فتح الحزمة
k this deck
59
If the government lowers corporate taxes, which of the following graphs correctly represents the effect on the IS curve?
A)
B)
C)
D)
A)
B)
C)
D)
فتح الحزمة
افتح القفل للوصول البطاقات البالغ عددها 125 في هذه المجموعة.
فتح الحزمة
k this deck
60
If the U.S. dollar appreciates, which of the following graphs correctly represents the effect on the IS curve?
A)
B)
C)
D)
A)
B)
C)
D)
فتح الحزمة
افتح القفل للوصول البطاقات البالغ عددها 125 في هذه المجموعة.
فتح الحزمة
k this deck
61
If the Canadian dollar depreciates, which of the following graphs correctly represents the effect on the IS curve in Canada?
A)
B)
C)
D)
A)
B)
C)
D)
فتح الحزمة
افتح القفل للوصول البطاقات البالغ عددها 125 في هذه المجموعة.
فتح الحزمة
k this deck
62
If the default risk rises in Greece, which of the following graphs correctly represents the effect on the MP curve in Greece?
A)
B)
C)
D)
A)
B)
C)
D)
فتح الحزمة
افتح القفل للوصول البطاقات البالغ عددها 125 في هذه المجموعة.
فتح الحزمة
k this deck
63
Which of the following graphs correctly represents the effect on the MP curve if there is a rise in liquidity risk in the United States?
A)
B)
C)
D)
A)
B)
C)
D)
فتح الحزمة
افتح القفل للوصول البطاقات البالغ عددها 125 في هذه المجموعة.
فتح الحزمة
k this deck
64
Which of the following graphs correctly represents the effect on the MP curve in Canada if mortgage rates decrease?
A)
B)
C)
D)
A)
B)
C)
D)
فتح الحزمة
افتح القفل للوصول البطاقات البالغ عددها 125 في هذه المجموعة.
فتح الحزمة
k this deck
65
Which of the following graphs correctly represents the effect on the MP curve if lenders become less risk averse?
A)
B)
C)
D)
A)
B)
C)
D)
فتح الحزمة
افتح القفل للوصول البطاقات البالغ عددها 125 في هذه المجموعة.
فتح الحزمة
k this deck
66
Which of the following graphs correctly represents the effect on the Phillips curve if there is widespread production technology improvement in Bangladesh?
A)
B)
C)
D)
A)
B)
C)
D)
فتح الحزمة
افتح القفل للوصول البطاقات البالغ عددها 125 في هذه المجموعة.
فتح الحزمة
k this deck
67
Which of the following graphs correctly represents the effect on the Phillips curve in India if the Indian rupee depreciates?
A)
B)
C)
D)
A)
B)
C)
D)
فتح الحزمة
افتح القفل للوصول البطاقات البالغ عددها 125 في هذه المجموعة.
فتح الحزمة
k this deck
68
Which of the following graphs correctly represents the effect on the Phillips curve in Ethiopia if the Ethiopian birr appreciates?
A)
B)
C)
D)
A)
B)
C)
D)
فتح الحزمة
افتح القفل للوصول البطاقات البالغ عددها 125 في هذه المجموعة.
فتح الحزمة
k this deck
69
In 2017, nearly 7.6% of Vietnamese imports were integrated circuits, which are used in the manufacture of electronics. If the price of integrated circuits rises significantly, what effect does this have on the Phillips curve in Vietnam?
A)
B)
C)
D)
A)
B)
C)
D)
فتح الحزمة
افتح القفل للوصول البطاقات البالغ عددها 125 في هذه المجموعة.
فتح الحزمة
k this deck
70
In 2017, nearly 3.5% of Vietnamese imports constituted of refined oil. If the price of oil rises significantly, what effect does this have on the Phillips curve in Vietnam?
A)
B)
C)
D)
A)
B)
C)
D)
فتح الحزمة
افتح القفل للوصول البطاقات البالغ عددها 125 في هذه المجموعة.
فتح الحزمة
k this deck
71
Assume that the economy starts at a 0% output gap. Now suppose that banks begin to fear the risk of default and the risk premium rises by 2%. Which of the following figures shows what happens in this scenario?
Figure A
Figure B
Figure C
Figure D
A)Figure A (no change)
B)Figure B (an upward shift of the MP curve and a new interest rate of 3%)
C)Figure C (a leftward shift of the IS curve and an output gap of -4%)
D)Figure D (an upward shift of the Phillips curve and 1% unexpected inflation)
Figure A
Figure B
Figure C
Figure D
A)Figure A (no change)
B)Figure B (an upward shift of the MP curve and a new interest rate of 3%)
C)Figure C (a leftward shift of the IS curve and an output gap of -4%)
D)Figure D (an upward shift of the Phillips curve and 1% unexpected inflation)
فتح الحزمة
افتح القفل للوصول البطاقات البالغ عددها 125 في هذه المجموعة.
فتح الحزمة
k this deck
72
The economy shown here begins at a 0% output gap. A rise in the risk premium by 2% leads to:
A)a new real interest rate of 3%.
B)unexpected inflation of 1%.
C)a new output gap of 2%.
D)a new real interest rate of 0%.
A)a new real interest rate of 3%.
B)unexpected inflation of 1%.
C)a new output gap of 2%.
D)a new real interest rate of 0%.
فتح الحزمة
افتح القفل للوصول البطاقات البالغ عددها 125 في هذه المجموعة.
فتح الحزمة
k this deck
73
The economy shown here begins at a 0% output gap. A rise in the risk premium by 2% leads to:
A)unexpected inflation of 0%.
B)unexpected inflation of 1%.
C)a new output gap of -4%.
D)a new real interest rate of 1%.
A)unexpected inflation of 0%.
B)unexpected inflation of 1%.
C)a new output gap of -4%.
D)a new real interest rate of 1%.
فتح الحزمة
افتح القفل للوصول البطاقات البالغ عددها 125 في هذه المجموعة.
فتح الحزمة
k this deck
74
The economy shown here begins at a 0% output gap. A rise in the risk premium by 2% leads to:
A)unexpected inflation of 0%.
B)unexpected inflation of -1%.
C)a new output gap of 2%.
D)a new real interest rate of 1%.
A)unexpected inflation of 0%.
B)unexpected inflation of -1%.
C)a new output gap of 2%.
D)a new real interest rate of 1%.
فتح الحزمة
افتح القفل للوصول البطاقات البالغ عددها 125 في هذه المجموعة.
فتح الحزمة
k this deck
75
The economy shown here begins at a 0% output gap. Now suppose that banks begin to fear the risk of default and the risk premium rises by 2%. If inflation expectations remain unchanged, the actual inflation rate will be:
A)2% higher.
B)1% higher.
C)1% lower.
D)4% lower.
A)2% higher.
B)1% higher.
C)1% lower.
D)4% lower.
فتح الحزمة
افتح القفل للوصول البطاقات البالغ عددها 125 في هذه المجموعة.
فتح الحزمة
k this deck
76
You are an economic adviser using the Fed model to analyze the economy. What is the effect of a rise in the risk premium in the economy?
A)a rise in the real interest rate, falling output, and unexpected deflation
B)a rise in the real interest rate, rising output, and unexpected inflation
C)a fall in the real interest rate, falling output, and unexpected deflation
D)a fall in the real interest rate, rising output, and unexpected inflation
فتح الحزمة
افتح القفل للوصول البطاقات البالغ عددها 125 في هذه المجموعة.
فتح الحزمة
k this deck
77
Assume that the economy starts at a 0% output gap. Now suppose that consumers fear a recession and reduce their spending. Based on this scenario, the economy experiences:
Figure A
Figure B
Figure C
Figure D
A) no change, as shown in Figure A.
B) an upward shift of the MP curve and a new interest rate of 3%, as shown in Figure B.
C) a leftward shift of the IS curve and an output gap of -4%, as shown in Figure C.
D) an upward shift of the Phillips curve and 1% unexpected inflation, as shown in Figure D.
فتح الحزمة
افتح القفل للوصول البطاقات البالغ عددها 125 في هذه المجموعة.
فتح الحزمة
k this deck
78
The economy shown here begins at a 0% output gap. Now suppose that consumers fear a recession and reduce their spending. This leads to:
A)a new real interest rate of 3%.
B)unexpected inflation of 1%.
C)a new output gap of -4%.
D)a new real interest rate of 0%.
A)a new real interest rate of 3%.
B)unexpected inflation of 1%.
C)a new output gap of -4%.
D)a new real interest rate of 0%.
فتح الحزمة
افتح القفل للوصول البطاقات البالغ عددها 125 في هذه المجموعة.
فتح الحزمة
k this deck
79
The economy shown here begins at a 0% output gap. Now suppose that consumers fear a recession and reduce their spending. This leads to:
A)a new real interest rate of 3%.
B)unexpected inflation of 1%.
C)a new output gap of 1%.
D)an unchanged interest rate.
A)a new real interest rate of 3%.
B)unexpected inflation of 1%.
C)a new output gap of 1%.
D)an unchanged interest rate.
فتح الحزمة
افتح القفل للوصول البطاقات البالغ عددها 125 في هذه المجموعة.
فتح الحزمة
k this deck
80
The economy shown here begins at a 0% output gap. Now suppose that consumers fear a recession and reduce their spending. This leads to:
A)unexpected inflation of 0%.
B)unexpected inflation of -1%.
C)a new output gap of 2%.
D)a new real interest rate of 3%.
A)unexpected inflation of 0%.
B)unexpected inflation of -1%.
C)a new output gap of 2%.
D)a new real interest rate of 3%.
فتح الحزمة
افتح القفل للوصول البطاقات البالغ عددها 125 في هذه المجموعة.
فتح الحزمة
k this deck
فتح الحزمة
افتح القفل للوصول البطاقات البالغ عددها 125 في هذه المجموعة.


