Deck 12: Quantitative Data Analysis: Using Statistics for Description and Inference
ملء الشاشة (f)
سؤال
سؤال
سؤال
سؤال
سؤال
Consider the following table from the 2018 GSS, which shows the relationship between race and whether someone favors or opposes "a law which would require a person to obtain a police permit before he or she could buy a gun."
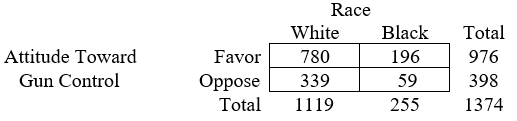 The data in this table suggest that (the answer may require some calculation)
A) there is a near-zero association between race and support for gun control.
B) whites are more likely to favor gun control than Blacks.
C) Blacks are more likely to favor gun control than whites.
D) neither whites or Blacks are likely to favor gun control.
The data in this table suggest that (the answer may require some calculation)A) there is a near-zero association between race and support for gun control.
B) whites are more likely to favor gun control than Blacks.
C) Blacks are more likely to favor gun control than whites.
D) neither whites or Blacks are likely to favor gun control.
سؤال
سؤال
سؤال
سؤال
Refer to the figure.
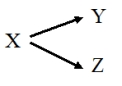 According to the theoretical model,
A) the inferred causal relationship between Y and Z is weak.
B) X is an intervening variable.
C) X affects Y and Z, but there is no causal relationship between Y and Z.
D) Y and Z are independent of X.
According to the theoretical model,A) the inferred causal relationship between Y and Z is weak.
B) X is an intervening variable.
C) X affects Y and Z, but there is no causal relationship between Y and Z.
D) Y and Z are independent of X.
سؤال
Refer to the following table.
Table 1. Percentage of Respondents Expressing High Tolerance of Civil Liberties for Political
Dissidents, by Gender and Religiosity
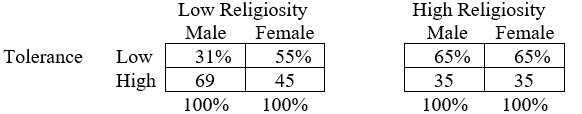 Which variable(s) is (are) controlled, or held constant, in each partial table of Table 1?
A) Gender
B) Religiosity
C) Gender and religiosity
D) Tolerance of civil liberties for political dissidents
Table 1. Percentage of Respondents Expressing High Tolerance of Civil Liberties for Political
Dissidents, by Gender and Religiosity
Which variable(s) is (are) controlled, or held constant, in each partial table of Table 1?A) Gender
B) Religiosity
C) Gender and religiosity
D) Tolerance of civil liberties for political dissidents
سؤال
سؤال
سؤال
سؤال
سؤال
سؤال
سؤال
سؤال
سؤال
سؤال
سؤال
سؤال
سؤال

فتح الحزمة
قم بالتسجيل لفتح البطاقات في هذه المجموعة!
Unlock Deck
Unlock Deck
1/23
العب
ملء الشاشة (f)
Deck 12: Quantitative Data Analysis: Using Statistics for Description and Inference
1
Which of the following most accurately describes Singleton's study of alcohol consumption and academic performance?
A) It involved the secondary analysis of a national survey.
B) It was based on a telephone interview survey.
C) It measured academic performance in terms of self-reported GPA.
D) It combined data from four campus surveys.
A) It involved the secondary analysis of a national survey.
B) It was based on a telephone interview survey.
C) It measured academic performance in terms of self-reported GPA.
D) It combined data from four campus surveys.
D
2
What is the order of steps in the quantitative analysis of survey data?
A) Inspect/modify data data processing bivariate analysis multivariate testing
B) Inspect/modify data data processing multivariate testing bivariate analysis
C) Data processing inspect/modify data bivariate analysis multivariate testing
D) Data processing inspect/modify data multivariate testing bivariate analysis
Data processing inspect/modify data bivariate analysis multivariate testing
3
What is the usual order of steps in processing completed survey interviews or questionnaires?
A) Data entry coding editing cleaning
B) Editing coding data entry cleaning
C) Cleaning coding data entry editing
D) Coding data entry cleaning editing
A) Data entry coding editing cleaning
B) Editing coding data entry cleaning
C) Cleaning coding data entry editing
D) Coding data entry cleaning editing
Editing coding data entry cleaning
4
In a campus survey, what was the shape of the distribution of reported number of drinks consumed on a typical weekend night?
A) Normal
B) Abnormal
C) Positively skewed
D) Negatively skewed
A) Normal
B) Abnormal
C) Positively skewed
D) Negatively skewed
فتح الحزمة
افتح القفل للوصول البطاقات البالغ عددها 23 في هذه المجموعة.
فتح الحزمة
k this deck
5
Consider the following table from the 2018 GSS, which shows the relationship between race and whether someone favors or opposes "a law which would require a person to obtain a police permit before he or she could buy a gun."
The data in this table suggest that (the answer may require some calculation)
A) there is a near-zero association between race and support for gun control.
B) whites are more likely to favor gun control than Blacks.
C) Blacks are more likely to favor gun control than whites.
D) neither whites or Blacks are likely to favor gun control.
The data in this table suggest that (the answer may require some calculation)A) there is a near-zero association between race and support for gun control.
B) whites are more likely to favor gun control than Blacks.
C) Blacks are more likely to favor gun control than whites.
D) neither whites or Blacks are likely to favor gun control.
فتح الحزمة
افتح القفل للوصول البطاقات البالغ عددها 23 في هذه المجموعة.
فتح الحزمة
k this deck
6
Suppose a researcher finds a statistically significant relationship between salary and job satisfaction among a random sample of employees. From this information, she can
A) reject the null hypothesis that there is no relationship between job satisfaction and salary.
B) conclude that differences in salary cause differences in job satisfaction.
C) conclude that the relationship between salary and job satisfaction probably occurred at random.
D) infer that salary is the most important factor in job satisfaction.
فتح الحزمة
افتح القفل للوصول البطاقات البالغ عددها 23 في هذه المجموعة.
فتح الحزمة
k this deck
7
For the 2018 GSS, you regress number of hours of television watched on the average day (Y) on number of years of education completed (X) and obtain the following result:
Y = 4.78 - .15X. How much change in hours of television watched is associated with a change of one year in a respondent's education?
A) 1
B) 4.78 - .15
C) 4.78
D) -.15
Y = 4.78 - .15X. How much change in hours of television watched is associated with a change of one year in a respondent's education?
A) 1
B) 4.78 - .15
C) 4.78
D) -.15
فتح الحزمة
افتح القفل للوصول البطاقات البالغ عددها 23 في هذه المجموعة.
فتح الحزمة
k this deck
8
Suppose two variables are negatively related. Which of the following regression equations might describe this relationship?
A) Y = 3.21 + 2.41X
B) Y = −.45 + 4.12X
C) Y = 18.62 - 1.21X
D) None of the above
A) Y = 3.21 + 2.41X
B) Y = −.45 + 4.12X
C) Y = 18.62 - 1.21X
D) None of the above
فتح الحزمة
افتح القفل للوصول البطاقات البالغ عددها 23 في هذه المجموعة.
فتح الحزمة
k this deck
9
Refer to the figure.
According to the theoretical model,
A) the inferred causal relationship between Y and Z is weak.
B) X is an intervening variable.
C) X affects Y and Z, but there is no causal relationship between Y and Z.
D) Y and Z are independent of X.
According to the theoretical model,A) the inferred causal relationship between Y and Z is weak.
B) X is an intervening variable.
C) X affects Y and Z, but there is no causal relationship between Y and Z.
D) Y and Z are independent of X.
فتح الحزمة
افتح القفل للوصول البطاقات البالغ عددها 23 في هذه المجموعة.
فتح الحزمة
k this deck
10
Refer to the following table.
Table 1. Percentage of Respondents Expressing High Tolerance of Civil Liberties for Political
Dissidents, by Gender and Religiosity
Which variable(s) is (are) controlled, or held constant, in each partial table of Table 1?
A) Gender
B) Religiosity
C) Gender and religiosity
D) Tolerance of civil liberties for political dissidents
Table 1. Percentage of Respondents Expressing High Tolerance of Civil Liberties for Political
Dissidents, by Gender and Religiosity
Which variable(s) is (are) controlled, or held constant, in each partial table of Table 1?A) Gender
B) Religiosity
C) Gender and religiosity
D) Tolerance of civil liberties for political dissidents
فتح الحزمة
افتح القفل للوصول البطاقات البالغ عددها 23 في هذه المجموعة.
فتح الحزمة
k this deck
11
Using the 2018 GSS, we regressed the number of hours of television watched on the average day on three variables: years of education, age, and marital status. Marital status is a dummy variables with 1 = married. We get the following results for the unstandardized regression coefficients: TVhours = 3.38 - .13Educ + .03Age - .52Married. According to this equation,
A) there is no association between age and television viewing.
B) younger people watch more hours of television, on average, than older people.
C) married people watch fewer hours of television, on average, than unmarried people.
D) age is more strongly associated with hours of television viewing than marital status.
فتح الحزمة
افتح القفل للوصول البطاقات البالغ عددها 23 في هذه المجموعة.
فتح الحزمة
k this deck
12
Using the 2018 GSS, we regressed the number of hours of television watched on the average day on three variables: years of education, age, and marital status. Marital status is a dummy variables with 1 = married. We get the following results for the unstandardized regression coefficients: TVhours = 3.38 - .13Educ + .03Age - .52Married. What is the predicted number of hours of television viewing for a 20-year old, unmarried person with 14 years of education?
A) 1.64
B) 2.16
C) 2.76
D) 3.38
A) 1.64
B) 2.16
C) 2.76
D) 3.38
فتح الحزمة
افتح القفل للوصول البطاقات البالغ عددها 23 في هذه المجموعة.
فتح الحزمة
k this deck
13
Using the 2018 GSS, we regressed the number of hours of television watched on the average day on three variables: years of education, age, and marital status. Marital status is a dummy variables with 1 = married. We get the following results for the standardized regression coefficients: TVhours = - .16Educ + .20Age - .10Married. According to this equation,
A) none of the variables is significantly related to television viewing.
B) all three variables are significantly related to television viewing.
C) age has the strongest association with television viewing.
D) one year of education has a greater impact on viewing than one year of age.
A) none of the variables is significantly related to television viewing.
B) all three variables are significantly related to television viewing.
C) age has the strongest association with television viewing.
D) one year of education has a greater impact on viewing than one year of age.
فتح الحزمة
افتح القفل للوصول البطاقات البالغ عددها 23 في هذه المجموعة.
فتح الحزمة
k this deck
14
Some data-processing activities can be programmed into computer-assisted interviewing.
فتح الحزمة
افتح القفل للوصول البطاقات البالغ عددها 23 في هذه المجموعة.
فتح الحزمة
k this deck
15
Univariate analysis can determine whether to recode variable categories for further analysis.
فتح الحزمة
افتح القفل للوصول البطاقات البالغ عددها 23 في هذه المجموعة.
فتح الحزمة
k this deck
16
Examining a scatterplot can reveal whether a linear regression analysis is appropriate.
فتح الحزمة
افتح القفل للوصول البطاقات البالغ عددها 23 في هذه المجموعة.
فتح الحزمة
k this deck
17
In the model X T Y, the relationship between X and Y is spurious.
فتح الحزمة
افتح القفل للوصول البطاقات البالغ عددها 23 في هذه المجموعة.
فتح الحزمة
k this deck
18
According to Box 12.3, leaving out important variables from a model is called a "specification error."
فتح الحزمة
افتح القفل للوصول البطاقات البالغ عددها 23 في هذه المجموعة.
فتح الحزمة
k this deck
19
According to Box 12.3, "collinearity" refers to a perfect linear fit between the independent and dependent variables.
فتح الحزمة
افتح القفل للوصول البطاقات البالغ عددها 23 في هذه المجموعة.
فتح الحزمة
k this deck
20
The quality of data is affected at several stages of social research, including data processing. What techniques do survey researchers apply to avoid errors and enhance data quality during data processing? Are data processing errors unavoidable, like random sampling error? Explain.
فتح الحزمة
افتح القفل للوصول البطاقات البالغ عددها 23 في هذه المجموعة.
فتح الحزمة
k this deck
21
Describe the differences in the univariate analysis of nominal/ordinal variables and interval/ratio variables. What descriptive statistics are used to describe each type of variable?
فتح الحزمة
افتح القفل للوصول البطاقات البالغ عددها 23 في هذه المجموعة.
فتح الحزمة
k this deck
22
Describe the differences in the bivariate analysis of nominal/ordinal variables and interval/ratio variables. What descriptive and inferential statistics are used to describe each type of variable?
فتح الحزمة
افتح القفل للوصول البطاقات البالغ عددها 23 في هذه المجموعة.
فتح الحزمة
k this deck
23
Someone at your college conducts a survey on helping and voluntarism. Suppose you are consulted about how to analyze the data to test the hypothesis that students majoring in the arts are more likely to do volunteer work than students majoring in the sciences. (a) What questions would you ask about the data before you make your recommendations? (b) As you might point out, why is a bivariate analysis seldom, if ever, sufficient to test a hypothesis that one variable causes another? (c) As you might explain, how is multiple regression superior to elaboration?
فتح الحزمة
افتح القفل للوصول البطاقات البالغ عددها 23 في هذه المجموعة.
فتح الحزمة
k this deck
فتح الحزمة
افتح القفل للوصول البطاقات البالغ عددها 23 في هذه المجموعة.


