Deck 7: Analyzing Data: Bivariate Relationships
ملء الشاشة (f)
سؤال
سؤال
سؤال
سؤال
سؤال
For the following crosstable, answer these questions:
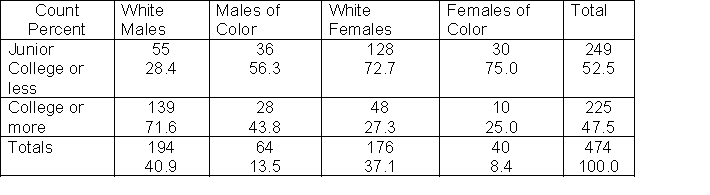
-what is the null hypothesis being tested here?
-what is the null hypothesis being tested here?
سؤال
For the following crosstable, answer these questions:
-Which is the independent variable and which is the dependent variable?
-Which is the independent variable and which is the dependent variable?
سؤال
For the following crosstable, answer these questions:
-put into words what the 56.3 says:
-put into words what the 56.3 says:
سؤال
For the following crosstable, answer these questions:
-what would you conclude about the hypothesis based on these data? Put into words what this data analysis is telling us.
-what would you conclude about the hypothesis based on these data? Put into words what this data analysis is telling us.
سؤال
For the following crosstable, answer these questions:
-Which statistics would you use to test the relationship?
-Which statistics would you use to test the relationship?
سؤال
سؤال
سؤال
سؤال
سؤال
سؤال

فتح الحزمة
قم بالتسجيل لفتح البطاقات في هذه المجموعة!
Unlock Deck
Unlock Deck
1/15
العب
ملء الشاشة (f)
Deck 7: Analyzing Data: Bivariate Relationships
1
Indicate which measure of relationship or association - in addition to chi-square -you would use to test each of the following null hypotheses (lambda, gamma, or Pearson r):
-there is no relationship between race and the type of car owned _______
-there is no relationship between race and the type of car owned _______
lambda
2
Indicate which measure of relationship or association - in addition to chi-square -you would use to test each of the following null hypotheses (lambda, gamma, or Pearson r):
-there is no relationship between height and GPA _______
-there is no relationship between height and GPA _______
Pearson r
3
Indicate which measure of relationship or association - in addition to chi-square -you would use to test each of the following null hypotheses (lambda, gamma, or Pearson r):
-there is no relationship between numerical scores on an exam and number of hours studied _________
-there is no relationship between numerical scores on an exam and number of hours studied _________
Pearson r
4
Indicate which measure of relationship or association - in addition to chi-square -you would use to test each of the following null hypotheses (lambda, gamma, or Pearson r):
-there is no relationship between schooling completed (measured as high school, some college, college, graduate school) and frequency of reading literary magazines (measured as daily, a few times a week, monthly, yearly) __________
-there is no relationship between schooling completed (measured as high school, some college, college, graduate school) and frequency of reading literary magazines (measured as daily, a few times a week, monthly, yearly) __________
فتح الحزمة
افتح القفل للوصول البطاقات البالغ عددها 15 في هذه المجموعة.
فتح الحزمة
k this deck
5
For the following crosstable, answer these questions:
-what is the null hypothesis being tested here?
-what is the null hypothesis being tested here?
فتح الحزمة
افتح القفل للوصول البطاقات البالغ عددها 15 في هذه المجموعة.
فتح الحزمة
k this deck
6
For the following crosstable, answer these questions:
-Which is the independent variable and which is the dependent variable?
-Which is the independent variable and which is the dependent variable?
فتح الحزمة
افتح القفل للوصول البطاقات البالغ عددها 15 في هذه المجموعة.
فتح الحزمة
k this deck
7
For the following crosstable, answer these questions:
-put into words what the 56.3 says:
-put into words what the 56.3 says:
فتح الحزمة
افتح القفل للوصول البطاقات البالغ عددها 15 في هذه المجموعة.
فتح الحزمة
k this deck
8
For the following crosstable, answer these questions:
-what would you conclude about the hypothesis based on these data? Put into words what this data analysis is telling us.
-what would you conclude about the hypothesis based on these data? Put into words what this data analysis is telling us.
فتح الحزمة
افتح القفل للوصول البطاقات البالغ عددها 15 في هذه المجموعة.
فتح الحزمة
k this deck
9
For the following crosstable, answer these questions:
-Which statistics would you use to test the relationship?
-Which statistics would you use to test the relationship?
فتح الحزمة
افتح القفل للوصول البطاقات البالغ عددها 15 في هذه المجموعة.
فتح الحزمة
k this deck
10
A correlation of .05 is a strong significant relationship.
فتح الحزمة
افتح القفل للوصول البطاقات البالغ عددها 15 في هذه المجموعة.
فتح الحزمة
k this deck
11
Which one of the following is the strongest correlation coefficient?
A) -.45
B) .56
C) -.78
D) .02
A) -.45
B) .56
C) -.78
D) .02
فتح الحزمة
افتح القفل للوصول البطاقات البالغ عددها 15 في هذه المجموعة.
فتح الحزمة
k this deck
12
The percentages for each value or category of the ___________ variable should add up to 100 percent.
فتح الحزمة
افتح القفل للوصول البطاقات البالغ عددها 15 في هذه المجموعة.
فتح الحزمة
k this deck
13
Put into words using the concept of PRE what each of the following correlations mean:
-Gamma = .65 for a relationship between categories of income and gender.
-Gamma = .65 for a relationship between categories of income and gender.
فتح الحزمة
افتح القفل للوصول البطاقات البالغ عددها 15 في هذه المجموعة.
فتح الحزمة
k this deck
14
Put into words using the concept of PRE what each of the following correlations mean:
-Lambda = .30 for a relationship between type of car owned and religious preference
-Lambda = .30 for a relationship between type of car owned and religious preference
فتح الحزمة
افتح القفل للوصول البطاقات البالغ عددها 15 في هذه المجموعة.
فتح الحزمة
k this deck
15
Put into words using the concept of PRE what each of the following correlations mean:
-Pearson r = -.40 for a relationship between GPA and number of hours partying in a typical week
-Pearson r = -.40 for a relationship between GPA and number of hours partying in a typical week
فتح الحزمة
افتح القفل للوصول البطاقات البالغ عددها 15 في هذه المجموعة.
فتح الحزمة
k this deck
فتح الحزمة
افتح القفل للوصول البطاقات البالغ عددها 15 في هذه المجموعة.


