Deck 10: Introducing Inference: Estimation From Samples
ملء الشاشة (f)
سؤال
سؤال
سؤال
سؤال
سؤال
سؤال
سؤال
سؤال
سؤال
سؤال
سؤال
سؤال
سؤال
سؤال
سؤال
سؤال
سؤال
سؤال
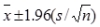
The formula for calculating a confidence interval for samples larger than 30 is .
سؤال
سؤال

فتح الحزمة
قم بالتسجيل لفتح البطاقات في هذه المجموعة!
Unlock Deck
Unlock Deck
1/20
العب
ملء الشاشة (f)
Deck 10: Introducing Inference: Estimation From Samples
1
The purpose of inferential statistics is to make inferences about characteristics of the population from which the data were drawn.
True
2
When both variables are categorical, the t-test should be used for hypothesis testing.
False
3
When both variables are continuous, the χ2 test should be used for hypothesis testing.
False
4
When both variables are continuous, simple regression can be used.
فتح الحزمة
افتح القفل للوصول البطاقات البالغ عددها 20 في هذه المجموعة.
فتح الحزمة
k this deck
5
Multivariate statistics involve statistics for three or more variables.
فتح الحزمة
افتح القفل للوصول البطاقات البالغ عددها 20 في هذه المجموعة.
فتح الحزمة
k this deck
6
It is practical to survey the entire population of a city.
فتح الحزمة
افتح القفل للوصول البطاقات البالغ عددها 20 في هذه المجموعة.
فتح الحزمة
k this deck
7
The population is the entire set of subjects of interest in any study, and a sample is a portion or subset of the population.
فتح الحزمة
افتح القفل للوصول البطاقات البالغ عددها 20 في هذه المجموعة.
فتح الحزمة
k this deck
8
Statistical inference is about drawing conclusions about a population from sample data.
فتح الحزمة
افتح القفل للوصول البطاقات البالغ عددها 20 في هذه المجموعة.
فتح الحزمة
k this deck
9
The best way to draw a sample is randomly-each subject should have an equal chance of being selected as part of your sample.
فتح الحزمة
افتح القفل للوصول البطاقات البالغ عددها 20 في هذه المجموعة.
فتح الحزمة
k this deck
10
We use population parameters to estimate unknown sample statistics.
فتح الحزمة
افتح القفل للوصول البطاقات البالغ عددها 20 في هذه المجموعة.
فتح الحزمة
k this deck
11
The estimation error is the difference between a sample statistic and a population parameter.
فتح الحزمة
افتح القفل للوصول البطاقات البالغ عددها 20 في هذه المجموعة.
فتح الحزمة
k this deck
12
A confidence interval is defined the range within which the unknown but true population parameter is estimated to lie.
فتح الحزمة
افتح القفل للوصول البطاقات البالغ عددها 20 في هذه المجموعة.
فتح الحزمة
k this deck
13
A 95% confidence interval is sometimes expressed as stating that when drawing many samples, 5% of the times the mean will lie within a confidence interval.
فتح الحزمة
افتح القفل للوصول البطاقات البالغ عددها 20 في هذه المجموعة.
فتح الحزمة
k this deck
14
The Central Limit Theorem is fundamental statistical insight that allows us to make inferences from a single sample to the population.
فتح الحزمة
افتح القفل للوصول البطاقات البالغ عددها 20 في هذه المجموعة.
فتح الحزمة
k this deck
15
A probability distribution is a statistical function which describes all possible values and likelihoods that a variable can take.
فتح الحزمة
افتح القفل للوصول البطاقات البالغ عددها 20 في هذه المجموعة.
فتح الحزمة
k this deck
16
A normal distribution (Appendix
A) A) is an example of a probability distribution.
A) A) is an example of a probability distribution.
فتح الحزمة
افتح القفل للوصول البطاقات البالغ عددها 20 في هذه المجموعة.
فتح الحزمة
k this deck
17
The standard deviation of a probability distribution is also called a standard error.
فتح الحزمة
افتح القفل للوصول البطاقات البالغ عددها 20 في هذه المجموعة.
فتح الحزمة
k this deck
18
The formula for calculating a confidence interval for samples larger than 30 is .
فتح الحزمة
افتح القفل للوصول البطاقات البالغ عددها 20 في هذه المجموعة.
فتح الحزمة
k this deck
19
When the sample size is smaller than 30, the normal distribution is replaced by the t distribution for calculating confidence interval.
فتح الحزمة
افتح القفل للوصول البطاقات البالغ عددها 20 في هذه المجموعة.
فتح الحزمة
k this deck
20
Confidence intervals are also calculated for proportions (e.g., polling data)
فتح الحزمة
افتح القفل للوصول البطاقات البالغ عددها 20 في هذه المجموعة.
فتح الحزمة
k this deck
فتح الحزمة
افتح القفل للوصول البطاقات البالغ عددها 20 في هذه المجموعة.


