Deck 10: Data Preparation and Basic Analysis
ملء الشاشة (f)
سؤال
Use Table 1 to answer the following
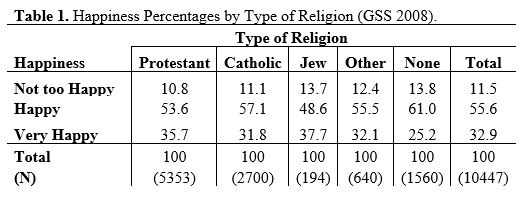
-In Table 1, rounded to whole percentages, the percentage of Jews who are very happy is __%.
A) 38
B) 14
C) 49
D) 100
-In Table 1, rounded to whole percentages, the percentage of Jews who are very happy is __%.
A) 38
B) 14
C) 49
D) 100
سؤال
Use Table 1 to answer the following
-In Table 1, rounded to whole percentages, the total percentage in this sample that is very happy is
A) 11
B) 33
C) 56
D) 12
-In Table 1, rounded to whole percentages, the total percentage in this sample that is very happy is
A) 11
B) 33
C) 56
D) 12
سؤال
Use Table 1 to answer the following
-Because there are more Protestants than Catholics in the dataset, the percentage results in Table 1, rounded to whole percentages, are
A) biased toward Protestants
B) biased toward Catholics
C) biased toward Jews
D) there is no bias by type of religion
-Because there are more Protestants than Catholics in the dataset, the percentage results in Table 1, rounded to whole percentages, are
A) biased toward Protestants
B) biased toward Catholics
C) biased toward Jews
D) there is no bias by type of religion
سؤال
Use Table 1 to answer the following
-The research hypothesis for Table 1, rounded to whole percentages, is
A) No difference in level of happiness by type of religion.
B) No difference in type of religion by level of happiness.
C) No difference between Catholics and Protestants in level of happiness.
D) none of these (a, b, c)
-The research hypothesis for Table 1, rounded to whole percentages, is
A) No difference in level of happiness by type of religion.
B) No difference in type of religion by level of happiness.
C) No difference between Catholics and Protestants in level of happiness.
D) none of these (a, b, c)
سؤال
Use Table 1 to answer the following
-In Table 1, rounded to whole percentages, the base (denominator) used to calculate the percentage of those reporting no religion is
A) 10447
B) 640
C) 1560
D) can't tell
-In Table 1, rounded to whole percentages, the base (denominator) used to calculate the percentage of those reporting no religion is
A) 10447
B) 640
C) 1560
D) can't tell

فتح الحزمة
قم بالتسجيل لفتح البطاقات في هذه المجموعة!
Unlock Deck
Unlock Deck
1/5
العب
ملء الشاشة (f)
Deck 10: Data Preparation and Basic Analysis
1
Use Table 1 to answer the following
-In Table 1, rounded to whole percentages, the percentage of Jews who are very happy is __%.
A) 38
B) 14
C) 49
D) 100
-In Table 1, rounded to whole percentages, the percentage of Jews who are very happy is __%.
A) 38
B) 14
C) 49
D) 100
38
2
Use Table 1 to answer the following
-In Table 1, rounded to whole percentages, the total percentage in this sample that is very happy is
A) 11
B) 33
C) 56
D) 12
-In Table 1, rounded to whole percentages, the total percentage in this sample that is very happy is
A) 11
B) 33
C) 56
D) 12
33
3
Use Table 1 to answer the following
-Because there are more Protestants than Catholics in the dataset, the percentage results in Table 1, rounded to whole percentages, are
A) biased toward Protestants
B) biased toward Catholics
C) biased toward Jews
D) there is no bias by type of religion
-Because there are more Protestants than Catholics in the dataset, the percentage results in Table 1, rounded to whole percentages, are
A) biased toward Protestants
B) biased toward Catholics
C) biased toward Jews
D) there is no bias by type of religion
there is no bias by type of religion
4
Use Table 1 to answer the following
-The research hypothesis for Table 1, rounded to whole percentages, is
A) No difference in level of happiness by type of religion.
B) No difference in type of religion by level of happiness.
C) No difference between Catholics and Protestants in level of happiness.
D) none of these (a, b, c)
-The research hypothesis for Table 1, rounded to whole percentages, is
A) No difference in level of happiness by type of religion.
B) No difference in type of religion by level of happiness.
C) No difference between Catholics and Protestants in level of happiness.
D) none of these (a, b, c)
فتح الحزمة
افتح القفل للوصول البطاقات البالغ عددها 5 في هذه المجموعة.
فتح الحزمة
k this deck
5
Use Table 1 to answer the following
-In Table 1, rounded to whole percentages, the base (denominator) used to calculate the percentage of those reporting no religion is
A) 10447
B) 640
C) 1560
D) can't tell
-In Table 1, rounded to whole percentages, the base (denominator) used to calculate the percentage of those reporting no religion is
A) 10447
B) 640
C) 1560
D) can't tell
فتح الحزمة
افتح القفل للوصول البطاقات البالغ عددها 5 في هذه المجموعة.
فتح الحزمة
k this deck
فتح الحزمة
افتح القفل للوصول البطاقات البالغ عددها 5 في هذه المجموعة.


