Deck 2: Data Representation
ملء الشاشة (f)
سؤال
سؤال
سؤال
سؤال
سؤال
سؤال
سؤال

فتح الحزمة
قم بالتسجيل لفتح البطاقات في هذه المجموعة!
Unlock Deck
Unlock Deck
1/7
العب
ملء الشاشة (f)
Deck 2: Data Representation
1
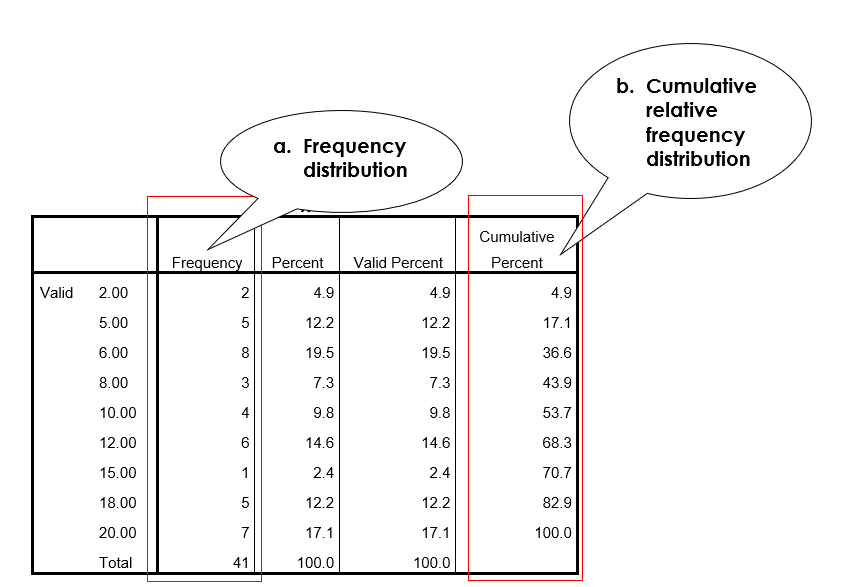
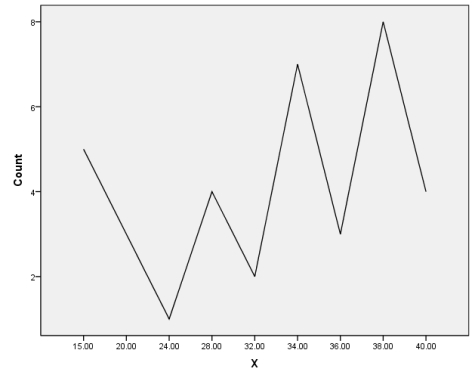
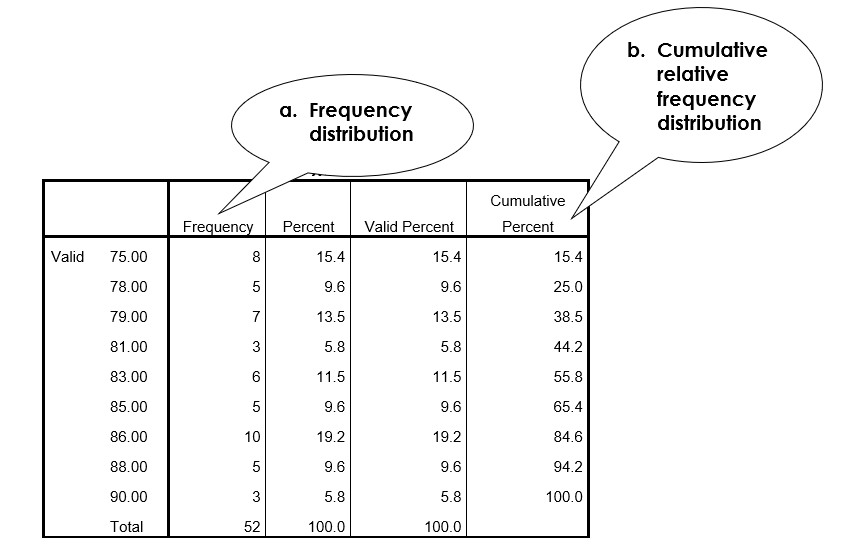
A sample distribution of variable X is as follows:
Calculate or draw each of the following for the sample distribution of X. Where possible, Use SPSS to generate the data.
a. Frequency distribution
b. Cumulative relative frequency distribution
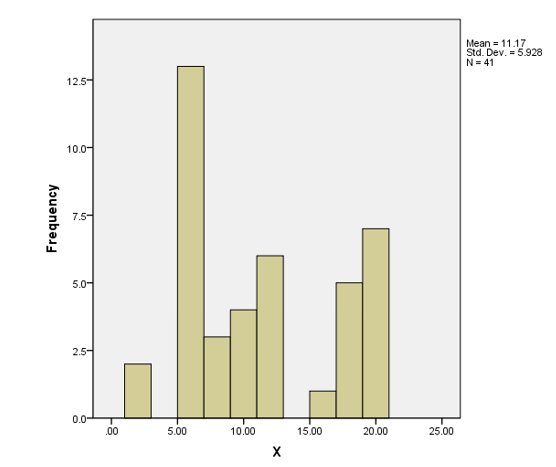
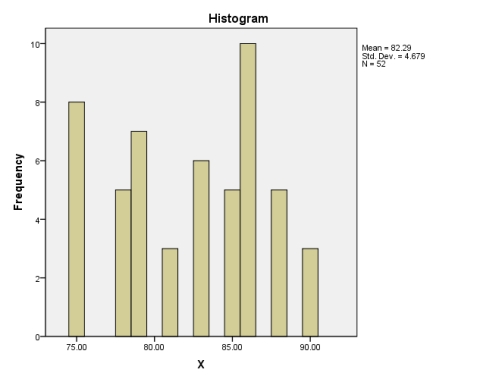
c. Histogram (ungrouped)
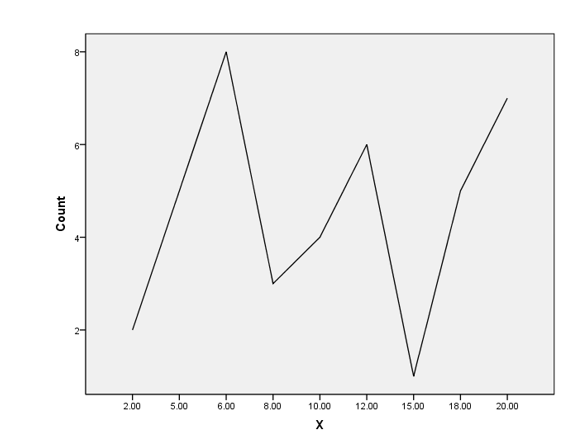
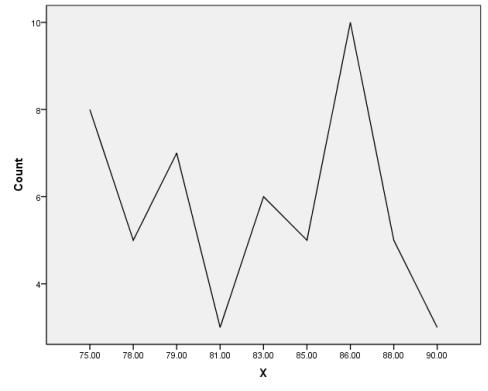
d. Frequency polygon
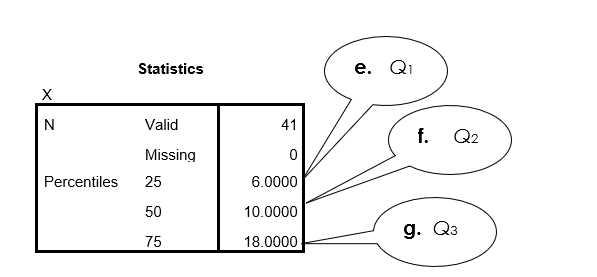
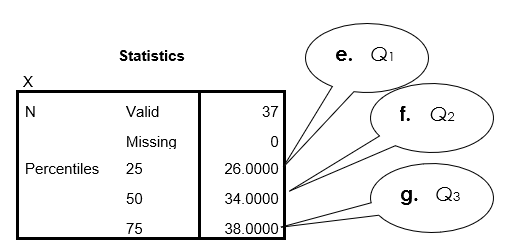
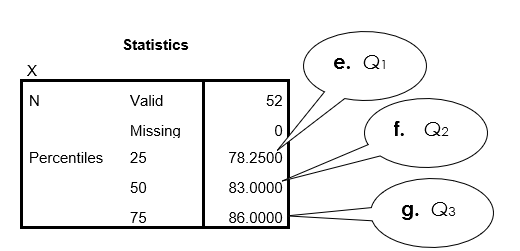
e. Q1
f. Q2
g. Q3
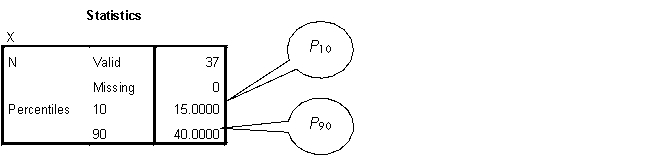
h. P10 and P90
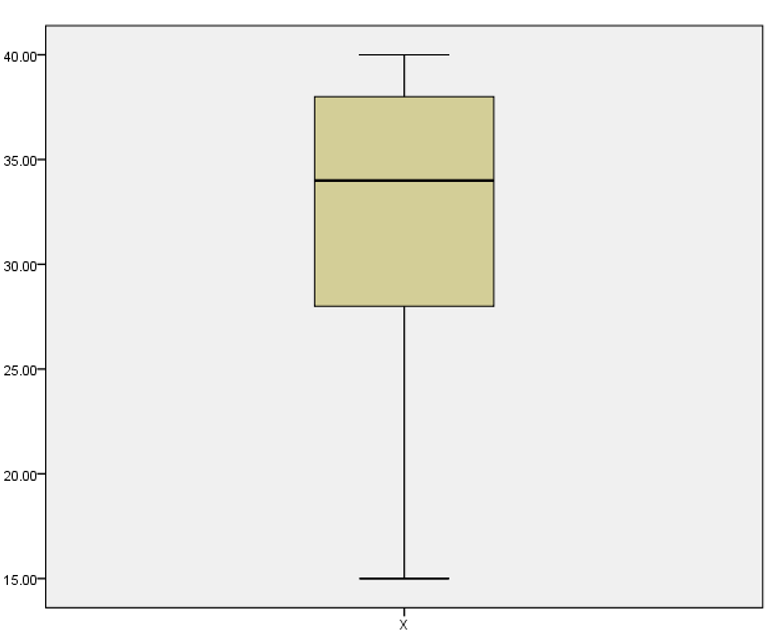
i. Box-and-whisker plot
Calculate or draw each of the following for the sample distribution of X. Where possible, Use SPSS to generate the data.
a. Frequency distribution
b. Cumulative relative frequency distribution
c. Histogram (ungrouped)
d. Frequency polygon
e. Q1
f. Q2
g. Q3
h. P10 and P90
i. Box-and-whisker plot
c.
d. frequency polygon
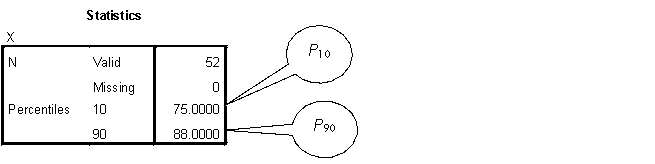
 h. P10 and P90
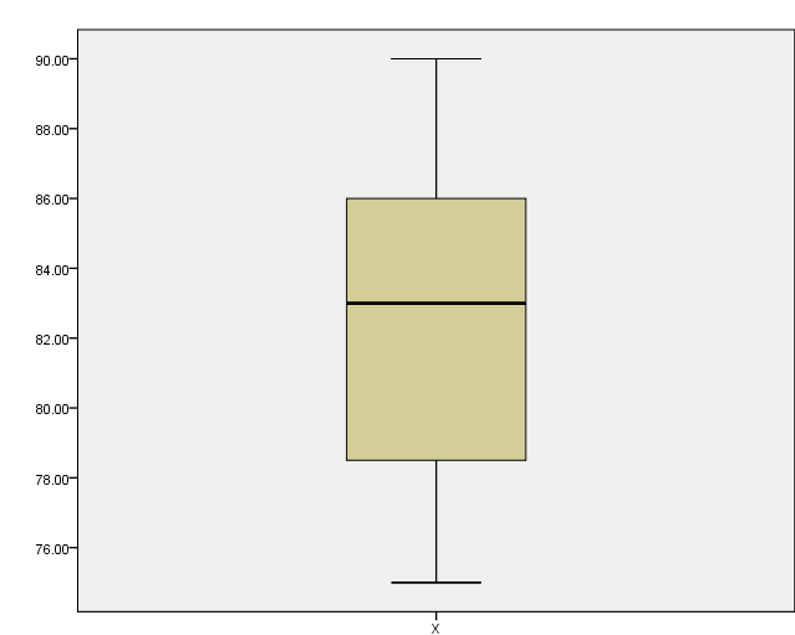
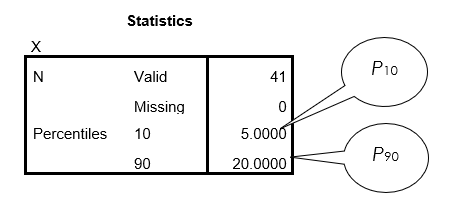 i. box-and-whisker plot
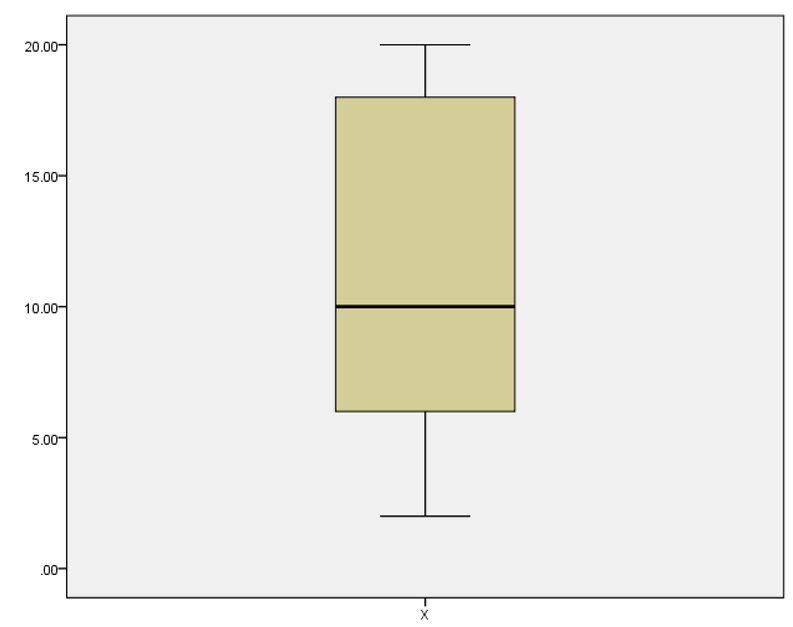
2
A sample distribution of variable X is as follows:
Calculate or draw each of the following for the sample distribution of X. Where possible, use SPSS to generate the data.
a. Frequency distribution
b. Cumulative relative frequency distribution
c. Histogram (ungrouped)
d. Frequency polygon
e. Q1
f. Q2
g. Q3
h. P10 and P90
i. Box-and-whisker plot
Calculate or draw each of the following for the sample distribution of X. Where possible, use SPSS to generate the data.
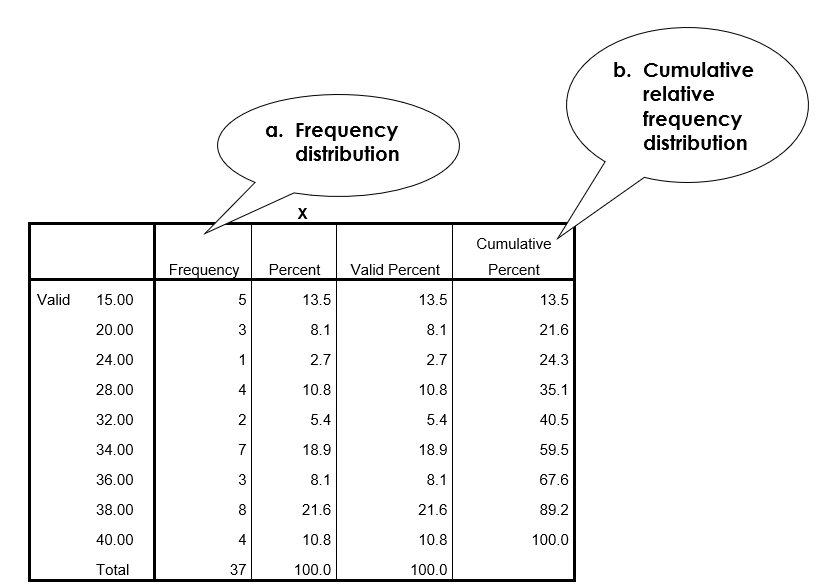
a. Frequency distribution
b. Cumulative relative frequency distribution
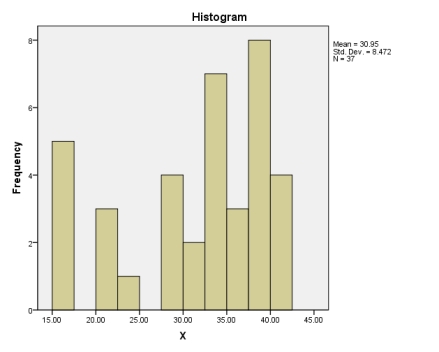
c. Histogram (ungrouped)
d. Frequency polygon
e. Q1
f. Q2
g. Q3
h. P10 and P90
i. Box-and-whisker plot
c. histogram (ungrouped)
d. frequency polygon
h. P10 and P90
i. box-and-whisker plot
3
A sample distribution of variable X is as follows:
Calculate or draw each of the following for the sample distribution of X. Where possible, use SPSS to generate the data.
a. Frequency distribution
b. Cumulative relative frequency distribution
c. Histogram (ungrouped)
d. Frequency polygon
e. Q1
f. Q2
g. Q3
h. P10 and P90
i. Box-and-whisker plot
Calculate or draw each of the following for the sample distribution of X. Where possible, use SPSS to generate the data.
a. Frequency distribution
b. Cumulative relative frequency distribution
c. Histogram (ungrouped)
d. Frequency polygon
e. Q1
f. Q2
g. Q3
h. P10 and P90
i. Box-and-whisker plot
c. histogram (ungrouped)
d. frequency polygon
h. P10 and P90
i. box-and-whisker plot
4
A sample distribution of variable X is as follows:
Calculate or draw each of the following for the sample distribution of X. Where possible, use SPSS to generate the data.
a. Frequency distribution
b. Cumulative relative frequency distribution
c. histogram (ungrouped)
d. Frequency polygon
e. Q1
f. Q2
g. Q3
h. P10 and P90
i. Box-and-whisker plot
Calculate or draw each of the following for the sample distribution of X. Where possible, use SPSS to generate the data.
a. Frequency distribution
b. Cumulative relative frequency distribution
c. histogram (ungrouped)
d. Frequency polygon
e. Q1
f. Q2
g. Q3
h. P10 and P90
i. Box-and-whisker plot
فتح الحزمة
افتح القفل للوصول البطاقات البالغ عددها 7 في هذه المجموعة.
فتح الحزمة
k this deck
5
Among the following, what is the preferred method for graphing data pertaining to favorite types of dance of a sample?
A) Bar graph
B) Cumulative frequency polygon
C) Frequency polygon
D) Histogram
A) Bar graph
B) Cumulative frequency polygon
C) Frequency polygon
D) Histogram
فتح الحزمة
افتح القفل للوصول البطاقات البالغ عددها 7 في هذه المجموعة.
فتح الحزمة
k this deck
6
In examining data collected over the past ten years, researchers at Sea World find that of 1,000 first-time guests: 452 visited during the summer months; 231 visited during the fall; 104 visited during the winter; and 213 visited during the spring. What is the relative frequency for guests who visited during the spring?
A) .45
B) .23
C) .21
D) .10
A) .45
B) .23
C) .21
D) .10
فتح الحزمة
افتح القفل للوصول البطاقات البالغ عددها 7 في هذه المجموعة.
فتح الحزمة
k this deck
7
Of 100 research participants, 10 are in group A, 22 in group B, 30 in group C, and 38 in group D. What is the relative frequency for participants in group D?
A) .010
B) .022
C) .030
D) .038
A) .010
B) .022
C) .030
D) .038
فتح الحزمة
افتح القفل للوصول البطاقات البالغ عددها 7 في هذه المجموعة.
فتح الحزمة
k this deck
فتح الحزمة
افتح القفل للوصول البطاقات البالغ عددها 7 في هذه المجموعة.


