Deck 2: The Art of Visual Storytelling: Creating Accurate Tables and Graphs
ملء الشاشة (f)
سؤال
سؤال
سؤال
سؤال
سؤال
سؤال
سؤال
سؤال
سؤال
سؤال
سؤال
سؤال
سؤال
سؤال
سؤال
سؤال
سؤال
سؤال
سؤال
سؤال
سؤال
سؤال
سؤال
سؤال
سؤال
سؤال
سؤال
سؤال
Describe what is wrong with the cells in the following crosstab and fix them:

سؤال
سؤال
سؤال
Here is an elaborated crosstab without percentages, using GSS2008 data and the variable "favor or oppose the death penalty for murder" as the dependent variable:
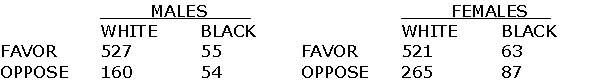 Unelaborate this crosstab so that you are looking at the simple relationship between race and attitude toward the death penalty, and add percentages to your resulting crosstab.
Unelaborate this crosstab so that you are looking at the simple relationship between race and attitude toward the death penalty, and add percentages to your resulting crosstab. سؤال
سؤال
سؤال
سؤال

فتح الحزمة
قم بالتسجيل لفتح البطاقات في هذه المجموعة!
Unlock Deck
Unlock Deck
1/35
العب
ملء الشاشة (f)
Deck 2: The Art of Visual Storytelling: Creating Accurate Tables and Graphs
1
Which one of these columns is not common in a frequency distribution?
A) Frequencies
B) Percentages
C) Cumulative Percentages
D) Cumulative Categories
A) Frequencies
B) Percentages
C) Cumulative Percentages
D) Cumulative Categories
D
2
Here is a part of a frequency distribution:
Cumulative
Which number goes in the blank?
A) 17%
B) 25%
C) 41.67%
D) 66.67%
Cumulative
Which number goes in the blank?
A) 17%
B) 25%
C) 41.67%
D) 66.67%
25%
3
In an SPSS-generated frequency distribution, which of these cannot be true regarding the Percent and Valid Percent columns:
A) the percentages for each category are the same for both the Percent column and the Valid Percent column
B) the percentages in the Percent column are smaller than the percentages in the Valid Percent column
C) the percentages in the Valid Percent column are smaller than the percentages in the Percent column
D) If the percentage for a category in the Percent column is 0%, the percentage for a category in the Valid Percent column is also 0%.
C
4
A table that shows the relationship between two variables is typically called:
A) a frequency distribution
B) a grouped frequency distribution
C) a crosstabulation
D) a bivariate distribution
A) a frequency distribution
B) a grouped frequency distribution
C) a crosstabulation
D) a bivariate distribution
فتح الحزمة
افتح القفل للوصول البطاقات البالغ عددها 35 في هذه المجموعة.
فتح الحزمة
k this deck
5
In a crosstab showing the relationship between sex and gun ownership, the number of women who own guns is 137. Where would you find this number?
A) In a column marginal
B) In a row marginal
C) In a cell
D) In the bottom right marginal
A) In a column marginal
B) In a row marginal
C) In a cell
D) In the bottom right marginal
فتح الحزمة
افتح القفل للوصول البطاقات البالغ عددها 35 في هذه المجموعة.
فتح الحزمة
k this deck
6
In a crosstab showing the relationship between sex and gun ownership, the number of people who own guns is 243. Where would you find this number?
A) In a column marginal
B) In a row marginal
C) In a cell
D) in the bottom right marginal
A) In a column marginal
B) In a row marginal
C) In a cell
D) in the bottom right marginal
فتح الحزمة
افتح القفل للوصول البطاقات البالغ عددها 35 في هذه المجموعة.
فتح الحزمة
k this deck
7
In a crosstab showing the relationship between sex and gun ownership, the number of people who are women is 201. Where would you find this number?
A) In a column marginal
B) In a row marginal
C) In a cell
D) in the bottom right marginal
A) In a column marginal
B) In a row marginal
C) In a cell
D) in the bottom right marginal
فتح الحزمة
افتح القفل للوصول البطاقات البالغ عددها 35 في هذه المجموعة.
فتح الحزمة
k this deck
8
Here is a crosstab with only the cell frequencies:
If the crosstab showed no relationship between sex and liking of math, what number would go in the blank?
A) 0
B) 100
C) 200
D) 600
If the crosstab showed no relationship between sex and liking of math, what number would go in the blank?
A) 0
B) 100
C) 200
D) 600
فتح الحزمة
افتح القفل للوصول البطاقات البالغ عددها 35 في هذه المجموعة.
فتح الحزمة
k this deck
9
Here is a crosstab with only the cell frequencies:
If the crosstab showed no relationship between marital status and happiness, what number would go in the blank?
A) 0
B) 50
C) 100
D) 200
If the crosstab showed no relationship between marital status and happiness, what number would go in the blank?
A) 0
B) 50
C) 100
D) 200
فتح الحزمة
افتح القفل للوصول البطاقات البالغ عددها 35 في هذه المجموعة.
فتح الحزمة
k this deck
10
Which of the following is NOT a rule of crosstab building from the textbook?
A) the placement rule
B) the marginal rule
C) the percentage rule
D) the title rule
A) the placement rule
B) the marginal rule
C) the percentage rule
D) the title rule
فتح الحزمة
افتح القفل للوصول البطاقات البالغ عددها 35 في هذه المجموعة.
فتح الحزمة
k this deck
11
If we were looking at the relationship between race and home ownership, what would be the best title for a crosstab looking at this relationship?
A) Home Ownership by Race
B) Race by Home Ownership
C) Home Ownership Crosstabulated with Race
D) Race and Home Ownership
A) Home Ownership by Race
B) Race by Home Ownership
C) Home Ownership Crosstabulated with Race
D) Race and Home Ownership
فتح الحزمة
افتح القفل للوصول البطاقات البالغ عددها 35 في هذه المجموعة.
فتح الحزمة
k this deck
12
Using crosstabs, we show that the relationship between age and happiness is stronger among blacks than among whites. We have engaged in the process called:
A) delineation
B) specification
C) elaboration
D) interaction
A) delineation
B) specification
C) elaboration
D) interaction
فتح الحزمة
افتح القفل للوصول البطاقات البالغ عددها 35 في هذه المجموعة.
فتح الحزمة
k this deck
13
Which of the following is an example of elaboration?
A) Men are more likely to give up their seat than women.
B) Older people are less likely to give up their seat than younger people.
C) Gender and age affect the likelihood of giving up your seat.
D) Age's effect on giving up your seat depends on which sex you're examining.
A) Men are more likely to give up their seat than women.
B) Older people are less likely to give up their seat than younger people.
C) Gender and age affect the likelihood of giving up your seat.
D) Age's effect on giving up your seat depends on which sex you're examining.
فتح الحزمة
افتح القفل للوصول البطاقات البالغ عددها 35 في هذه المجموعة.
فتح الحزمة
k this deck
14
The histogram is a graphic version of what?
A) a crosstab
B) an elaborated crosstab
C) a frequency distribution
D) a grouped frequency distribution
A) a crosstab
B) an elaborated crosstab
C) a frequency distribution
D) a grouped frequency distribution
فتح الحزمة
افتح القفل للوصول البطاقات البالغ عددها 35 في هذه المجموعة.
فتح الحزمة
k this deck
15
If one had data for thousands of respondents on a variable with thousands of values, all different from one another, which graph would be most appropriate to represent the distribution of this variable?
A) a stacked bar graph
B) a clustered bar graph
C) a histogram
D) a plotted pie graph
A) a stacked bar graph
B) a clustered bar graph
C) a histogram
D) a plotted pie graph
فتح الحزمة
افتح القفل للوصول البطاقات البالغ عددها 35 في هذه المجموعة.
فتح الحزمة
k this deck
16
Which bar graph's presentation of the data most resembles a crosstabulation's presentation of the data?
A) a clustered bar graph
B) a stacked bar graph
C) a tabular bar graph
D) a 3-D bar graph
A) a clustered bar graph
B) a stacked bar graph
C) a tabular bar graph
D) a 3-D bar graph
فتح الحزمة
افتح القفل للوصول البطاقات البالغ عددها 35 في هذه المجموعة.
فتح الحزمة
k this deck
17
The most typical combination of variables in a population pyramid is:
A) a ratio-level variable and a dichotomy
B) a ratio-level variable and an ordinal-level variable
C) two dichotomies
D) two ratio-level variables
A) a ratio-level variable and a dichotomy
B) a ratio-level variable and an ordinal-level variable
C) two dichotomies
D) two ratio-level variables
فتح الحزمة
افتح القفل للوصول البطاقات البالغ عددها 35 في هذه المجموعة.
فتح الحزمة
k this deck
18
A country is worried that, because of its low birthrate and high number of elderly people, its social security system will be stressed. What is a sign of this?
A) the population pyramid will be wider at the bottom (i.e. a regular, right-side-up pyramid).
B) the population pyramid will be wider at the top (i.e. an upside-down pyramid).
C) the population pyramid will be shaped like an hour glass.
D) the population pyramid will be shaped like a rectangle.
A) the population pyramid will be wider at the bottom (i.e. a regular, right-side-up pyramid).
B) the population pyramid will be wider at the top (i.e. an upside-down pyramid).
C) the population pyramid will be shaped like an hour glass.
D) the population pyramid will be shaped like a rectangle.
فتح الحزمة
افتح القفل للوصول البطاقات البالغ عددها 35 في هذه المجموعة.
فتح الحزمة
k this deck
19
The ideal value of the Lie Factor is:
A) 0
B) .5
C) 1
D) 10
A) 0
B) .5
C) 1
D) 10
فتح الحزمة
افتح القفل للوصول البطاقات البالغ عددها 35 في هذه المجموعة.
فتح الحزمة
k this deck
20
The Lie Factor for a graph is .25. Which statement is most correct?
A) The graph under-represents the change in the data by .75.
B) The graph under-represents the change in the data by a factor of 4.
C) The graph over-represents the change in the data by .25.
D) The graph over-represents the change in the data by a factor of 4.
A) The graph under-represents the change in the data by .75.
B) The graph under-represents the change in the data by a factor of 4.
C) The graph over-represents the change in the data by .25.
D) The graph over-represents the change in the data by a factor of 4.
فتح الحزمة
افتح القفل للوصول البطاقات البالغ عددها 35 في هذه المجموعة.
فتح الحزمة
k this deck
21
The Lie Factor for a graph is 4. Which state is most correct?
A) The graph under-represents the change in the data by .75.
B) The graph under-represents the change in the data by a factor of 4.
C) The graph over-represents the change in the data by .25.
D) The graph over-represents the change in the data by a factor of 4.
A) The graph under-represents the change in the data by .75.
B) The graph under-represents the change in the data by a factor of 4.
C) The graph over-represents the change in the data by .25.
D) The graph over-represents the change in the data by a factor of 4.
فتح الحزمة
افتح القفل للوصول البطاقات البالغ عددها 35 في هذه المجموعة.
فتح الحزمة
k this deck
22
Saperstein and Penner's article shows that:
A) racial classification is affected by social status
B) happiness is affected by employment status
C) happiness and health are related
D) support for marijuana legalization has increased in recent years
A) racial classification is affected by social status
B) happiness is affected by employment status
C) happiness and health are related
D) support for marijuana legalization has increased in recent years
فتح الحزمة
افتح القفل للوصول البطاقات البالغ عددها 35 في هذه المجموعة.
فتح الحزمة
k this deck
23
What was the Lie Factor for the graph from Saperstein and Penner's article on racial classification?
A) Far below 1: the graph underestimated the change in the data
B) 1: the graph accurately reflected the change in the data
C) 1.4: the graph slightly exaggerated the change in the data
D) 6: the graph greatly exaggerated the change in the data
A) Far below 1: the graph underestimated the change in the data
B) 1: the graph accurately reflected the change in the data
C) 1.4: the graph slightly exaggerated the change in the data
D) 6: the graph greatly exaggerated the change in the data
فتح الحزمة
افتح القفل للوصول البطاقات البالغ عددها 35 في هذه المجموعة.
فتح الحزمة
k this deck
24
In SPSS, when creating a crosstab, you want to put the independent variable in the ___________ box.
A) rows
B) columns
C) percentage
D) layers
A) rows
B) columns
C) percentage
D) layers
فتح الحزمة
افتح القفل للوصول البطاقات البالغ عددها 35 في هذه المجموعة.
فتح الحزمة
k this deck
25
In SPSS, you create a simple crosstab. Then, you want to elaborate this crosstab. You go back into the crosstabs box and put a variable in the _____ box.
A) rows
B) columns
C) percentage
D) layers
A) rows
B) columns
C) percentage
D) layers
فتح الحزمة
افتح القفل للوصول البطاقات البالغ عددها 35 في هذه المجموعة.
فتح الحزمة
k this deck
26
With regard to SPSS frequency distribution output, explain the difference between the "Percent" and the "Valid Percent" columns.
فتح الحزمة
افتح القفل للوصول البطاقات البالغ عددها 35 في هذه المجموعة.
فتح الحزمة
k this deck
27
You are creating a crosstab to investigate the relationship between the respondent's sex (in this case, male versus female) and whether or not the respondent voted in the 2016 presidential election. In order to make the worst crosstab as you can, describe how you would break all of the three crosstab rules described in the textbook.
فتح الحزمة
افتح القفل للوصول البطاقات البالغ عددها 35 في هذه المجموعة.
فتح الحزمة
k this deck
28
Describe what is wrong with the cells in the following crosstab and fix them:
فتح الحزمة
افتح القفل للوصول البطاقات البالغ عددها 35 في هذه المجموعة.
فتح الحزمة
k this deck
29
With regard to crosstabs, describe the process of elaboration.
فتح الحزمة
افتح القفل للوصول البطاقات البالغ عددها 35 في هذه المجموعة.
فتح الحزمة
k this deck
30
Your independent variable is race. Your dependent variable is support for the death penalty. Your elaboration variable is nativity (immigrant or non-immigrant). Rephrase all this as a hypothesis.
فتح الحزمة
افتح القفل للوصول البطاقات البالغ عددها 35 في هذه المجموعة.
فتح الحزمة
k this deck
31
Here is an elaborated crosstab without percentages, using GSS2008 data and the variable "favor or oppose the death penalty for murder" as the dependent variable:
Unelaborate this crosstab so that you are looking at the simple relationship between race and attitude toward the death penalty, and add percentages to your resulting crosstab.
Unelaborate this crosstab so that you are looking at the simple relationship between race and attitude toward the death penalty, and add percentages to your resulting crosstab. فتح الحزمة
افتح القفل للوصول البطاقات البالغ عددها 35 في هذه المجموعة.
فتح الحزمة
k this deck
32
Describe a variable for which you would want to use a histogram rather than a bar graph in order to represent its distribution.
فتح الحزمة
افتح القفل للوصول البطاقات البالغ عددها 35 في هذه المجموعة.
فتح الحزمة
k this deck
33
Explain why the Lie Factor should ideally be equal to 1.
فتح الحزمة
افتح القفل للوصول البطاقات البالغ عددها 35 في هذه المجموعة.
فتح الحزمة
k this deck
34
In the mid 1990s, approximately 50 million Americans had cellphones. By the mid 2000s, approximately 250 million Americans had cellphones. In a bar graph, the mid 1990s bar is 1 inch tall, and the mid 2000s bar is 10 inches tall. Find the Lie Factor for this situation, and fully explain what your result means.
فتح الحزمة
افتح القفل للوصول البطاقات البالغ عددها 35 في هذه المجموعة.
فتح الحزمة
k this deck
35
Explain the root cause of the problem with the graph in the Saperstein and Penner article on racial classification.
فتح الحزمة
افتح القفل للوصول البطاقات البالغ عددها 35 في هذه المجموعة.
فتح الحزمة
k this deck
فتح الحزمة
افتح القفل للوصول البطاقات البالغ عددها 35 في هذه المجموعة.


