Deck 4: Using Sample Crosstabs to Talk About Populations: the Chi-Square Test
ملء الشاشة (f)
سؤال
سؤال
سؤال
سؤال
سؤال
سؤال
سؤال
سؤال
سؤال
سؤال
سؤال
سؤال
سؤال
سؤال
سؤال
سؤال
سؤال
سؤال
سؤال
سؤال
سؤال
سؤال
سؤال
سؤال
سؤال
سؤال
سؤال
سؤال
سؤال
سؤال
سؤال
سؤال
The stereotype: men are more pro-military than women are. Is this stereotype supported by GSS2008 data, at least with regard to supporting military spending? Here is a crosstab:
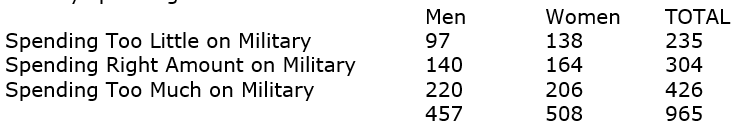 Address the above question, using a chi-square test along the way.
Address the above question, using a chi-square test along the way. سؤال
سؤال
سؤال

فتح الحزمة
قم بالتسجيل لفتح البطاقات في هذه المجموعة!
Unlock Deck
Unlock Deck
1/35
العب
ملء الشاشة (f)
Deck 4: Using Sample Crosstabs to Talk About Populations: the Chi-Square Test
1
A claim about a population based on statistics from a sample of this population is most commonly called
A) an inference
B) a hypothesis
C) a postulate
D) a population claim
A) an inference
B) a hypothesis
C) a postulate
D) a population claim
A
2
Which of the following is a likely sample size for the General Social Survey?
A) 300
B) 2,500
C) 10,000
D) 500,000
A) 300
B) 2,500
C) 10,000
D) 500,000
B
3
You want to select a random sample from a large class you are in, so you get a class roster from your instructor. This roster is called:
A) the sampling frame
B) the sample population
C) the sample list
D) the sampling cluster
A) the sampling frame
B) the sample population
C) the sample list
D) the sampling cluster
A
4
In order to assess the attitudes of Buddhists adequately, a researcher ensures that this group is sampled at a much higher rate than the rest of the population. This process is called:
A) cluster sampling
B) hypersampling
C) nonproportional sampling
D) oversampling
A) cluster sampling
B) hypersampling
C) nonproportional sampling
D) oversampling
فتح الحزمة
افتح القفل للوصول البطاقات البالغ عددها 35 في هذه المجموعة.
فتح الحزمة
k this deck
5
In a sample of 100 men and 100 women, we find that 75 of the men own dogs and 25 of the women own dogs. In the table of expected frequencies, how many women would we expect to own dogs?
A) 25
B) 50
C) 75
D) 43
A) 25
B) 50
C) 75
D) 43
فتح الحزمة
افتح القفل للوصول البطاقات البالغ عددها 35 في هذه المجموعة.
فتح الحزمة
k this deck
6
In a sample of 100 men and 200 women, we find that 75 of the men own dogs and 175 of the women own dogs. In the table of expected frequencies, how many men would we expect to own dogs?
A) 75
B) 25
C) 16.67
D) 83.33
A) 75
B) 25
C) 16.67
D) 83.33
فتح الحزمة
افتح القفل للوصول البطاقات البالغ عددها 35 في هذه المجموعة.
فتح الحزمة
k this deck
7
If our research question is "Do blacks and whites differ in their overall health?" Health is measured by a single self-assessment question with the possible responses being: excellent, good, fair, and poor. What is the most likely statistical procedure to use here?
A) The chi-square test
B) The median
C) Expected frequencies
D)The IQV
A) The chi-square test
B) The median
C) Expected frequencies
D)The IQV
فتح الحزمة
افتح القفل للوصول البطاقات البالغ عددها 35 في هذه المجموعة.
فتح الحزمة
k this deck
8
When you go to the chi-square table, the goal is to see how _____ _______ you can get with your chi-square value, in order to find your p-conclusion.
A) far to the left
B) far to the right
C) close to the top
D) close to the bottom
A) far to the left
B) far to the right
C) close to the top
D) close to the bottom
فتح الحزمة
افتح القفل للوصول البطاقات البالغ عددها 35 في هذه المجموعة.
فتح الحزمة
k this deck
9
To achieve statistical significance, the textbook's key p-value is that p must be below:
A) .50
B) .25
C) .05
D) .01
A) .50
B) .25
C) .05
D) .01
فتح الحزمة
افتح القفل للوصول البطاقات البالغ عددها 35 في هذه المجموعة.
فتح الحزمة
k this deck
10
A researcher claims based on sample results that men's and women's abortion attitudes differ in the population, but in reality, in the population, they do not differ. This researcher has made:
A) a Type A Error
B) a Type One Error
C) a Type Two Error
D) an inferential error
A) a Type A Error
B) a Type One Error
C) a Type Two Error
D) an inferential error
فتح الحزمة
افتح القفل للوصول البطاقات البالغ عددها 35 في هذه المجموعة.
فتح الحزمة
k this deck
11
A researcher claims based on sample results that men's and women's abortion attitudes do not differ in the population, but in reality, in the population, they do differ. This researcher has made:
A) a Type A Error
B) a Type One Error
C) a Type Two Error
D) an inferential error
A) a Type A Error
B) a Type One Error
C) a Type Two Error
D) an inferential error
فتح الحزمة
افتح القفل للوصول البطاقات البالغ عددها 35 في هذه المجموعة.
فتح الحزمة
k this deck
12
Using a crosstab, we are investigating the relationship between sex (M,F) and health (excellent, good, fair, poor). In this crosstab, how many degrees of freedom are there?
A) 2
B) 3
C) 6
D) 8
A) 2
B) 3
C) 6
D) 8
فتح الحزمة
افتح القفل للوصول البطاقات البالغ عددها 35 في هذه المجموعة.
فتح الحزمة
k this deck
13
What is the minimum number of degrees of freedom in a crosstab?
A) 0
B) 1
C) 2
D) 4
A) 0
B) 1
C) 2
D) 4
فتح الحزمة
افتح القفل للوصول البطاقات البالغ عددها 35 في هذه المجموعة.
فتح الحزمة
k this deck
14
Using a crosstab, we are investigating the relationship between educational degree (less than high school diploma, high school diploma, associate's degree, bachelor's degree, graduate degree) and agreement on a Likert-scale survey item (strongly agree, agree, neither agree nor disagree, disagree, strongly disagree). In this crosstab, how many degrees of freedom are there?
A) 10
B) 12
C) 16
D) 25
A) 10
B) 12
C) 16
D) 25
فتح الحزمة
افتح القفل للوصول البطاقات البالغ عددها 35 في هذه المجموعة.
فتح الحزمة
k this deck
15
A researcher thinks that attitudes toward the death penalty vary by sex. What is his likely Null Hypothesis?
A) The population of men and the population of women have similar attitudes toward the death penalty.
B) The population of men and the population of women have different attitudes toward the death penalty.
C) The population of men favors the death penalty more than the population of women does.
D) The population of women favors the death penalty more than the population of men does.
فتح الحزمة
افتح القفل للوصول البطاقات البالغ عددها 35 في هذه المجموعة.
فتح الحزمة
k this deck
16
In the chi-square distribution for a two-by-two crosstab, only a few of the values are above:
A) 0
B) .01
C) .05
D) 4
A) 0
B) .01
C) .05
D) 4
فتح الحزمة
افتح القفل للوصول البطاقات البالغ عددها 35 في هذه المجموعة.
فتح الحزمة
k this deck
17
The values in a chi-square distribution for a 3x3 crosstab are typically _____ than the values in a chi-square distribution for a 2x2 crosstab.
A) lower
B) higher
C) twice as small
D) twice as large
A) lower
B) higher
C) twice as small
D) twice as large
فتح الحزمة
افتح القفل للوصول البطاقات البالغ عددها 35 في هذه المجموعة.
فتح الحزمة
k this deck
18
What behavior did Weinberg and Williams study in order to provide insight into gender differences?
A) drinking
B) fighting
C) farting
D) talking about emotions
A) drinking
B) fighting
C) farting
D) talking about emotions
فتح الحزمة
افتح القفل للوصول البطاقات البالغ عددها 35 في هذه المجموعة.
فتح الحزمة
k this deck
19
In Weinberg and Williams' study of bodily behaviors, their sample can best be described as:
A) random on a national scale
B) random within the state they studied
C) random within the university they studied
D) non-random
A) random on a national scale
B) random within the state they studied
C) random within the university they studied
D) non-random
فتح الحزمة
افتح القفل للوصول البطاقات البالغ عددها 35 في هذه المجموعة.
فتح الحزمة
k this deck
20
According to the Weinberg and Williams research on bodily behaviors, which group was most similar to heterosexual women?
A) heterosexual men
B) non-heterosexual women
C) non-heterosexual men
D) all were similar
A) heterosexual men
B) non-heterosexual women
C) non-heterosexual men
D) all were similar
فتح الحزمة
افتح القفل للوصول البطاقات البالغ عددها 35 في هذه المجموعة.
فتح الحزمة
k this deck
21
According to the textbook, which country has the lowest percentage of women in government?
A) Mexico
B) China
C) Uganda
D) United States
A) Mexico
B) China
C) Uganda
D) United States
فتح الحزمة
افتح القفل للوصول البطاقات البالغ عددها 35 في هذه المجموعة.
فتح الحزمة
k this deck
22
Which data do Fox and Lawless use in their article about political ambition?
A) American National Election Studies data
B) General Social Survey data
C) Census data
D) Data that they themselves collected for this article
A) American National Election Studies data
B) General Social Survey data
C) Census data
D) Data that they themselves collected for this article
فتح الحزمة
افتح القفل للوصول البطاقات البالغ عددها 35 في هذه المجموعة.
فتح الحزمة
k this deck
23
Which statistical technique do Fox and Lawless say they use in their article?
A) Standard deviation
B) Median
C) Chi-square
D) They never explicitly say
A) Standard deviation
B) Median
C) Chi-square
D) They never explicitly say
فتح الحزمة
افتح القفل للوصول البطاقات البالغ عددها 35 في هذه المجموعة.
فتح الحزمة
k this deck
24
Which p-conclusion does SPSS report?
A) p<.05
B) p<.01
C) p<.001
D) SPSS does not report this type of p-conclusion
A) p<.05
B) p<.01
C) p<.001
D) SPSS does not report this type of p-conclusion
فتح الحزمة
افتح القفل للوصول البطاقات البالغ عددها 35 في هذه المجموعة.
فتح الحزمة
k this deck
25
According to the textbook, when you are presenting data with chi-square results, what should you report?
A) p-conclusions
B) p-conclusions and percentages
C) p-conclusions and frequencies
D) p-conclusions, percentages, and frequencies
A) p-conclusions
B) p-conclusions and percentages
C) p-conclusions and frequencies
D) p-conclusions, percentages, and frequencies
فتح الحزمة
افتح القفل للوصول البطاقات البالغ عددها 35 في هذه المجموعة.
فتح الحزمة
k this deck
26
Describe why inferential statistics are so important to social researchers.
فتح الحزمة
افتح القفل للوصول البطاقات البالغ عددها 35 في هذه المجموعة.
فتح الحزمة
k this deck
27
A student conducts a survey, using his Facebook friends as his sample. He then uses his results to build a crosstab and carry out chi-square tests. What is wrong with the student's approach?
فتح الحزمة
افتح القفل للوصول البطاقات البالغ عددها 35 في هذه المجموعة.
فتح الحزمة
k this deck
28
In a table of expected frequencies, what exactly is it that we are expecting?
فتح الحزمة
افتح القفل للوصول البطاقات البالغ عددها 35 في هذه المجموعة.
فتح الحزمة
k this deck
29
In the 2008 GSS, among the American Indian respondents, 4 say they are very happy, 15 say they're pretty happy, and 8 say they're not too happy. Among the Asian Indian respondents, 7 say they're very happy, 10 say they're pretty happy, and 1 said he/she was not too happy. Based on this information, create the table of expected frequencies.
فتح الحزمة
افتح القفل للوصول البطاقات البالغ عددها 35 في هذه المجموعة.
فتح الحزمة
k this deck
30
In the 2008GSS, they asked respondents whether or not they used a computer at work. We assume that this will be overwhelmingly true for the younger generation, with older generations using computers less. Surprisingly, the relationship goes in the opposite direction: 74% of 18-39-year-olds use a computer at work, compared to 77% of 40-59-year-olds, and 83% of those aged 60 and over. Is this difference within the sample large enough to claim that there exists a difference in the population?
Run a chi-square test on the crosstab to find out.
Run a chi-square test on the crosstab to find out.
فتح الحزمة
افتح القفل للوصول البطاقات البالغ عددها 35 في هذه المجموعة.
فتح الحزمة
k this deck
31
Among black respondents to the 2008 GSS, 167 had no small children at home, and 44 did have small children at home. Among those black respondents who had no small children at home, 62 of them had been to a zoo in the past year. Among those black respondents who did have small children at home, 23 of them had been to a zoo in the past year. Build a crosstab with these results, percentage it, run a chi-square test, and explain your results.
فتح الحزمة
افتح القفل للوصول البطاقات البالغ عددها 35 في هذه المجموعة.
فتح الحزمة
k this deck
32
The stereotype: men are more pro-military than women are. Is this stereotype supported by GSS2008 data, at least with regard to supporting military spending? Here is a crosstab:
Address the above question, using a chi-square test along the way.
Address the above question, using a chi-square test along the way. فتح الحزمة
افتح القفل للوصول البطاقات البالغ عددها 35 في هذه المجموعة.
فتح الحزمة
k this deck
33
A crosstab's observed frequencies are exactly the same as the expected frequencies. What would the chi-square value be and what would your p-conclusion be?
فتح الحزمة
افتح القفل للوصول البطاقات البالغ عددها 35 في هذه المجموعة.
فتح الحزمة
k this deck
34
Describe the shape of the chi-square probability distribution (where df=1) and why it is shaped that way.
فتح الحزمة
افتح القفل للوصول البطاقات البالغ عددها 35 في هذه المجموعة.
فتح الحزمة
k this deck
35
Why does the textbook claim that the Weinberg and Williams literature example did not use ideal sampling methods prior to their use of chi-square tests?
فتح الحزمة
افتح القفل للوصول البطاقات البالغ عددها 35 في هذه المجموعة.
فتح الحزمة
k this deck
فتح الحزمة
افتح القفل للوصول البطاقات البالغ عددها 35 في هذه المجموعة.


