Deck 2: Organizing Data Using Tables and Graphs
ملء الشاشة (f)
سؤال
سؤال
سؤال
سؤال
سؤال
سؤال
سؤال
سؤال
سؤال
سؤال
سؤال
سؤال
سؤال
سؤال
سؤال
سؤال
سؤال
سؤال
سؤال
سؤال
سؤال
سؤال
سؤال
سؤال
سؤال
سؤال
سؤال
سؤال
سؤال
سؤال
سؤال
سؤال
سؤال
سؤال
سؤال
سؤال
سؤال
سؤال
سؤال
سؤال
سؤال
سؤال
سؤال
سؤال
سؤال
سؤال
سؤال
سؤال
سؤال
سؤال
سؤال
سؤال
سؤال
سؤال
سؤال
سؤال
سؤال
A set of scores has the following distribution:
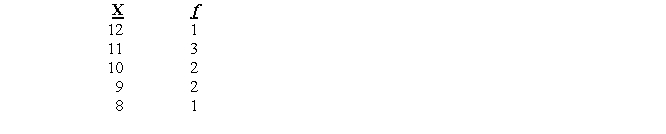 a. What is N?
b. What is the cumulative frequency of a score of 10?
c. What is the percentile rank of a score of 11?
d. What is the relative frequency of a score of 9?
a. What is N?b. What is the cumulative frequency of a score of 10?
c. What is the percentile rank of a score of 11?
d. What is the relative frequency of a score of 9?
سؤال
سؤال
Construct a grouped frequency distribution for the following set of scores?

فتح الحزمة
قم بالتسجيل لفتح البطاقات في هذه المجموعة!
Unlock Deck
Unlock Deck
1/59
العب
ملء الشاشة (f)
Deck 2: Organizing Data Using Tables and Graphs
1
The advantage of creating frequency distributions is that they
A) help to identify cause-and-effect relationships.
B) help to make patterns and general trends in the data more noticeable.
C) make it easier to see the raw scores.
D) help to determine the appropriate scale of measurement to use.
A) help to identify cause-and-effect relationships.
B) help to make patterns and general trends in the data more noticeable.
C) make it easier to see the raw scores.
D) help to determine the appropriate scale of measurement to use.
B
2
In a frequency distribution, N will equal
A) the sum of the X-scores.
B) the number of times a particular score occurs.
C) the sum of the f column.
D) the number of times a tally mark is placed next to a score.
A) the sum of the X-scores.
B) the number of times a particular score occurs.
C) the sum of the f column.
D) the number of times a tally mark is placed next to a score.
C
3
In a frequency distribution, f stands for
A) the number of times a particular score occurs.
B) the sum of the tally column.
C) the total number of scores.
D) the sum of the X-scores.
A) the number of times a particular score occurs.
B) the sum of the tally column.
C) the total number of scores.
D) the sum of the X-scores.
A
4
In constructing a simple frequency distribution,
A) scores are arranged in order from low to high beginning at the top, skipping score values that were not achieved by anyone.
B) scores are arranged in order from high to low, beginning at the top, skipping score values that were not achieved by anyone.
C) scores are arranged in order from high to low, beginning at the top, including scores that were not achieved by anyone.
D) scores are arranged in order from low to high beginning at the top, including scores that were not achieved by anyone.
فتح الحزمة
افتح القفل للوصول البطاقات البالغ عددها 59 في هذه المجموعة.
فتح الحزمة
k this deck
5
Relative frequency is found by
A) adding up the frequency column.
B) dividing a score's frequency by N.
C) dividing N by the score's frequency.
D) adding up the X-column.
A) adding up the frequency column.
B) dividing a score's frequency by N.
C) dividing N by the score's frequency.
D) adding up the X-column.
فتح الحزمة
افتح القفل للوصول البطاقات البالغ عددها 59 في هذه المجموعة.
فتح الحزمة
k this deck
6
Relative frequency refers to
A) the percentage of scores that fall at or below a given value.
B) how many times a particular score occurs.
C) the proportion of times that a particular score occurs.
D) the frequency of scores that fall at or below a particular score value.
A) the percentage of scores that fall at or below a given value.
B) how many times a particular score occurs.
C) the proportion of times that a particular score occurs.
D) the frequency of scores that fall at or below a particular score value.
فتح الحزمة
افتح القفل للوصول البطاقات البالغ عددها 59 في هذه المجموعة.
فتح الحزمة
k this deck
7
In a distribution of scores where N = 12, a score of 4 occurred three times. What is the relative frequency of that score?
A) .75
B) .25
C) .33
D) Not enough information is provided.
A) .75
B) .25
C) .33
D) Not enough information is provided.
فتح الحزمة
افتح القفل للوصول البطاقات البالغ عددها 59 في هذه المجموعة.
فتح الحزمة
k this deck
8
In a distribution of scores where N = 26, f = 4, and cf = 14 for a score of 7, what is the percentile rank for that score?
A) 53.85
B) .5385
C) .1538
D) 15.38
A) 53.85
B) .5385
C) .1538
D) 15.38
فتح الحزمة
افتح القفل للوصول البطاقات البالغ عددها 59 في هذه المجموعة.
فتح الحزمة
k this deck
9
A cumulative frequency distribution table indicates
A) the percentage of scores that fall at or below a particular score value.
B) the proportion of times that a particular score occurs.
C) the frequency with which a particular score occurs.
D) the frequency of scores that fall at or below a particular value.
A) the percentage of scores that fall at or below a particular score value.
B) the proportion of times that a particular score occurs.
C) the frequency with which a particular score occurs.
D) the frequency of scores that fall at or below a particular value.
فتح الحزمة
افتح القفل للوصول البطاقات البالغ عددها 59 في هذه المجموعة.
فتح الحزمة
k this deck
10
A cumulative frequency distribution begins with
A) a simple frequency distribution table.
B) a relative frequency distribution table.
C) percentile ranks.
D) a grouped frequency distribution table.
A) a simple frequency distribution table.
B) a relative frequency distribution table.
C) percentile ranks.
D) a grouped frequency distribution table.
فتح الحزمة
افتح القفل للوصول البطاقات البالغ عددها 59 في هذه المجموعة.
فتح الحزمة
k this deck
11
In a cumulative frequency distribution table, the cf at the top
A) gives the total sum of all of the scores.
B) gives the relative frequency for that particular score.
C) is equal to N.
D) is equal to the percentile rank.
A) gives the total sum of all of the scores.
B) gives the relative frequency for that particular score.
C) is equal to N.
D) is equal to the percentile rank.
فتح الحزمة
افتح القفل للوصول البطاقات البالغ عددها 59 في هذه المجموعة.
فتح الحزمة
k this deck
12
In a grouped frequency distribution i refers to
A) the range of the class interval.
B) the number of class intervals.
C) the number of scores in the class interval.
D) the first entry in the class interval.
A) the range of the class interval.
B) the number of class intervals.
C) the number of scores in the class interval.
D) the first entry in the class interval.
فتح الحزمة
افتح القفل للوصول البطاقات البالغ عددها 59 في هذه المجموعة.
فتح الحزمة
k this deck
13
One of the class intervals in a grouped frequency distribution is 60 - 64. What is the size of the interval?
A) 5
B) 4
C) 63
D) 64
A) 5
B) 4
C) 63
D) 64
فتح الحزمة
افتح القفل للوصول البطاقات البالغ عددها 59 في هذه المجموعة.
فتح الحزمة
k this deck
14
Which of the following is NOT one of the ground rules discussed in your text for constructing grouped frequency distributions?
A) Interval sizes should be 2, 3, or 5.
B) Between 10 and 20 class intervals should be used.
C) The smallest scores go at the top of the distribution.
D) Your first class intervals should begin with a multiple of i.
A) Interval sizes should be 2, 3, or 5.
B) Between 10 and 20 class intervals should be used.
C) The smallest scores go at the top of the distribution.
D) Your first class intervals should begin with a multiple of i.
فتح الحزمة
افتح القفل للوصول البطاقات البالغ عددها 59 في هذه المجموعة.
فتح الحزمة
k this deck
15
The interval size of a grouped frequency distribution is 3 and the lowest score in the data set is 46. The first class interval entry should be _____________.
A) 46 - 49
B) 45 - 47
C) 46 - 48
D) 45 - 46
A) 46 - 49
B) 45 - 47
C) 46 - 48
D) 45 - 46
فتح الحزمة
افتح القفل للوصول البطاقات البالغ عددها 59 في هذه المجموعة.
فتح الحزمة
k this deck
16
For which type of distribution table do we need to calculate the range for the scores?
A) a relative frequency distribution
B) a simple frequency distribution
C) a cumulative frequency distribution
D) a grouped frequency distribution
A) a relative frequency distribution
B) a simple frequency distribution
C) a cumulative frequency distribution
D) a grouped frequency distribution
فتح الحزمة
افتح القفل للوصول البطاقات البالغ عددها 59 في هذه المجموعة.
فتح الحزمة
k this deck
17
The ground rules in your text specify that the size of class intervals should be
A) 2, 3, or 5.
B) 2, 3, or 4.
C) 3, 5, or 10.
D) 10 or 20.
A) 2, 3, or 5.
B) 2, 3, or 4.
C) 3, 5, or 10.
D) 10 or 20.
فتح الحزمة
افتح القفل للوصول البطاقات البالغ عددها 59 في هذه المجموعة.
فتح الحزمة
k this deck
18
The ground rules in your text specify that the number of class intervals should be
A) between 5 and 10.
B) between 10 and 20.
C) 2, 3, or 5.
D) 5, 10, or 20.
A) between 5 and 10.
B) between 10 and 20.
C) 2, 3, or 5.
D) 5, 10, or 20.
فتح الحزمة
افتح القفل للوصول البطاقات البالغ عددها 59 في هذه المجموعة.
فتح الحزمة
k this deck
19
If the range in a distribution of scores is 63, we should use an i of
A) 2.
B) 3.
C) 5.
D) 10.
A) 2.
B) 3.
C) 5.
D) 10.
فتح الحزمة
افتح القفل للوصول البطاقات البالغ عددها 59 في هذه المجموعة.
فتح الحزمة
k this deck
20
The highest score in a distribution is 74 and the lowest score is 51. What is the range?
A) 24.5
B) 23.5
C) 23
D) 24
A) 24.5
B) 23.5
C) 23
D) 24
فتح الحزمة
افتح القفل للوصول البطاقات البالغ عددها 59 في هذه المجموعة.
فتح الحزمة
k this deck
21
When the data from a frequency distribution are graphed, the frequencies are shown
A) along the y-axis.
B) along the x-axis.
C) along the abscissa.
D) across the top of the graph.
A) along the y-axis.
B) along the x-axis.
C) along the abscissa.
D) across the top of the graph.
فتح الحزمة
افتح القفل للوصول البطاقات البالغ عددها 59 في هذه المجموعة.
فتح الحزمة
k this deck
22
Abscissa is to ordinate as
A) y-axis is to x-axis.
B) x-axis is to y-axis.
C) vertical line is to horizontal line.
D) positive skew is to negative skew.
A) y-axis is to x-axis.
B) x-axis is to y-axis.
C) vertical line is to horizontal line.
D) positive skew is to negative skew.
فتح الحزمة
افتح القفل للوصول البطاقات البالغ عددها 59 في هذه المجموعة.
فتح الحزمة
k this deck
23
In the graph of a frequency distribution, the ordinate represents
A) the frequencies of scores.
B) the values of the variable being measured.
C) the scores on the vertical axis.
D) the width of the class intervals.
A) the frequencies of scores.
B) the values of the variable being measured.
C) the scores on the vertical axis.
D) the width of the class intervals.
فتح الحزمة
افتح القفل للوصول البطاقات البالغ عددها 59 في هذه المجموعة.
فتح الحزمة
k this deck
24
Which of the following does not belong?
A) bar graph
B) histogram
C) percentile rank
D) frequency polygon
A) bar graph
B) histogram
C) percentile rank
D) frequency polygon
فتح الحزمة
افتح القفل للوصول البطاقات البالغ عددها 59 في هذه المجموعة.
فتح الحزمة
k this deck
25
Which of the following is NOT true of bar graphs?
A) They are used for qualitative variables that differ in kind.
B) They are used for quantitative variables that differ in amount.
C) The bars are spatially separated.
D) They can be used for data measured on nominal or ordinal scales.
A) They are used for qualitative variables that differ in kind.
B) They are used for quantitative variables that differ in amount.
C) The bars are spatially separated.
D) They can be used for data measured on nominal or ordinal scales.
فتح الحزمة
افتح القفل للوصول البطاقات البالغ عددها 59 في هذه المجموعة.
فتح الحزمة
k this deck
26
Which of the following is true of bar graphs?
A) They are used for quantitative variables that differ in kind.
B) They can be used for data measured on interval or ratio scales.
C) The bars touch each other to reflect the continuous nature of the variable being measured.
D) The bars are spatially separated.
A) They are used for quantitative variables that differ in kind.
B) They can be used for data measured on interval or ratio scales.
C) The bars touch each other to reflect the continuous nature of the variable being measured.
D) The bars are spatially separated.
فتح الحزمة
افتح القفل للوصول البطاقات البالغ عددها 59 في هذه المجموعة.
فتح الحزمة
k this deck
27
Which of the following is NOT true of histograms.
A) They are used for quantitative variables that differ in kind.
B) They can be used for data measured on interval or ratio scales.
C) The bars touch each other to reflect the continuous nature of the variable being measured.
D) The bars are spatially separated.
A) They are used for quantitative variables that differ in kind.
B) They can be used for data measured on interval or ratio scales.
C) The bars touch each other to reflect the continuous nature of the variable being measured.
D) The bars are spatially separated.
فتح الحزمة
افتح القفل للوصول البطاقات البالغ عددها 59 في هذه المجموعة.
فتح الحزمة
k this deck
28
Which type of graph uses dots rather than bars?
A) bar graphs
B) histograms
C) percentile ranks
D) frequency polygons
A) bar graphs
B) histograms
C) percentile ranks
D) frequency polygons
فتح الحزمة
افتح القفل للوصول البطاقات البالغ عددها 59 في هذه المجموعة.
فتح الحزمة
k this deck
29
Which type of graph is best for making comparisons between two sets of data?
A) frequency polygons
B) histograms
C) percentile ranks
D) bar graphs
A) frequency polygons
B) histograms
C) percentile ranks
D) bar graphs
فتح الحزمة
افتح القفل للوصول البطاقات البالغ عددها 59 في هذه المجموعة.
فتح الحزمة
k this deck
30
Which type of graphs are appropriate for data measured on interval and ratio scales?
A) bar graphs and histograms
B) frequency polygons and bar graphs
C) histograms and frequency polygons
D) bar graphs, histograms, and frequency polygons
A) bar graphs and histograms
B) frequency polygons and bar graphs
C) histograms and frequency polygons
D) bar graphs, histograms, and frequency polygons
فتح الحزمة
افتح القفل للوصول البطاقات البالغ عددها 59 في هذه المجموعة.
فتح الحزمة
k this deck
31
Which type of graph should be used to show the frequency data for the scores of male and female athletes?
A) histogram
B) frequency polygon
C) percentile rank
D) bar graph
A) histogram
B) frequency polygon
C) percentile rank
D) bar graph
فتح الحزمة
افتح القفل للوصول البطاقات البالغ عددها 59 في هذه المجموعة.
فتح الحزمة
k this deck
32
For which scale of measurement(s) can bar graphs be used?
A) interval only
B) nominal only
C) interval or ratio
D) nominal or ordinal
A) interval only
B) nominal only
C) interval or ratio
D) nominal or ordinal
فتح الحزمة
افتح القفل للوصول البطاقات البالغ عددها 59 في هذه المجموعة.
فتح الحزمة
k this deck
33
For which scale of measurement(s) can histograms be used?
A) interval only
B) nominal only
C) interval or ratio
D) nominal or ordinal
A) interval only
B) nominal only
C) interval or ratio
D) nominal or ordinal
فتح الحزمة
افتح القفل للوصول البطاقات البالغ عددها 59 في هذه المجموعة.
فتح الحزمة
k this deck
34
A histogram or frequency polygon should be used for graphing which of the following data?
A) military rank
B) distance traveled
C) types of trees
D) letter grades
A) military rank
B) distance traveled
C) types of trees
D) letter grades
فتح الحزمة
افتح القفل للوصول البطاقات البالغ عددها 59 في هذه المجموعة.
فتح الحزمة
k this deck
35
A bar graph should be used for illustrating which of the following data?
A) types of cars
B) blood pressures
C) heights of children
D) running speed
A) types of cars
B) blood pressures
C) heights of children
D) running speed
فتح الحزمة
افتح القفل للوصول البطاقات البالغ عددها 59 في هذه المجموعة.
فتح الحزمة
k this deck
36
Empirical distributions are
A) theoretical.
B) based on the mathematical probability of the frequencies of scores in a population.
C) based on actual frequencies of scores.
D) drawn with smooth lines without dots.
A) theoretical.
B) based on the mathematical probability of the frequencies of scores in a population.
C) based on actual frequencies of scores.
D) drawn with smooth lines without dots.
فتح الحزمة
افتح القفل للوصول البطاقات البالغ عددها 59 في هذه المجموعة.
فتح الحزمة
k this deck
37
Which of the following is NOT true of theoretical distributions?
A) They are based on frequencies of actual scores.
B) They are based on the mathematical probability of scores in a population.
C) They are drawn with smooth lines without dots.
D) An example is the normal distribution curve.
A) They are based on frequencies of actual scores.
B) They are based on the mathematical probability of scores in a population.
C) They are drawn with smooth lines without dots.
D) An example is the normal distribution curve.
فتح الحزمة
افتح القفل للوصول البطاقات البالغ عددها 59 في هذه المجموعة.
فتح الحزمة
k this deck
38
Which of the following is NOT true of the normal distribution curve?
A) It has tails that are asymptotic.
B) It is based on an infinite number of cases.
C) It begins with a frequency of 0.
D) The tails never touch the baseline.
A) It has tails that are asymptotic.
B) It is based on an infinite number of cases.
C) It begins with a frequency of 0.
D) The tails never touch the baseline.
فتح الحزمة
افتح القفل للوصول البطاقات البالغ عددها 59 في هذه المجموعة.
فتح الحزمة
k this deck
39
In a normal distribution curve
A) the most frequently occurring scores are toward the right side.
B) the most frequently occurring scores are in the middle.
C) the most frequently occurring scores are towards the left side.
D) the scores are distributed equally across the entire distribution.
A) the most frequently occurring scores are toward the right side.
B) the most frequently occurring scores are in the middle.
C) the most frequently occurring scores are towards the left side.
D) the scores are distributed equally across the entire distribution.
فتح الحزمة
افتح القفل للوصول البطاقات البالغ عددها 59 في هذه المجموعة.
فتح الحزمة
k this deck
40
Skewed distributions
A) are symmetrical.
B) are a type of normal distribution.
C) have scores that stack up at either the high or low end of the distribution.
D) both b and c are true.
A) are symmetrical.
B) are a type of normal distribution.
C) have scores that stack up at either the high or low end of the distribution.
D) both b and c are true.
فتح الحزمة
افتح القفل للوصول البطاقات البالغ عددها 59 في هذه المجموعة.
فتح الحزمة
k this deck
41
In a positively skewed distribution
A) all of the scores are negative.
B) all of the scores are positive.
C) there are more high scores than low scores.
D) there are more low scores than high scores.
A) all of the scores are negative.
B) all of the scores are positive.
C) there are more high scores than low scores.
D) there are more low scores than high scores.
فتح الحزمة
افتح القفل للوصول البطاقات البالغ عددها 59 في هذه المجموعة.
فتح الحزمة
k this deck
42
In a negatively skewed distribution
A) there are fewer high scores than low scores.
B) there are fewer low scores than high scores.
C) all of the scores are positive.
D) all of the scores are negative.
A) there are fewer high scores than low scores.
B) there are fewer low scores than high scores.
C) all of the scores are positive.
D) all of the scores are negative.
فتح الحزمة
افتح القفل للوصول البطاقات البالغ عددها 59 في هذه المجموعة.
فتح الحزمة
k this deck
43
The most frequently occurring scores are in the middle in a __________________ distribution.
A) normal
B) positively skewed
C) negatively skewed
D) rectangular
A) normal
B) positively skewed
C) negatively skewed
D) rectangular
فتح الحزمة
افتح القفل للوصول البطاقات البالغ عددها 59 في هذه المجموعة.
فتح الحزمة
k this deck
44
In a positively skewed distribution of scores that ranges from 0 to 100, the most frequently occurring scores will be nearest to
A) 20.
B) 40.
C) 60.
D) 80.
A) 20.
B) 40.
C) 60.
D) 80.
فتح الحزمة
افتح القفل للوصول البطاقات البالغ عددها 59 في هذه المجموعة.
فتح الحزمة
k this deck
45
In a negatively skewed distribution that ranges from 0 to 50, the least frequently occurring scores will be nearest to
A) 10.
B) 30.
C) 40.
D) 50.
A) 10.
B) 30.
C) 40.
D) 50.
فتح الحزمة
افتح القفل للوصول البطاقات البالغ عددها 59 في هذه المجموعة.
فتح الحزمة
k this deck
46
In a distribution of US salaries, most are at the lower end and there are fewer who make high salaries. This describes a _______________ distribution.
A) normal
B) negatively skewed
C) positively skewed
D) bimodal
A) normal
B) negatively skewed
C) positively skewed
D) bimodal
فتح الحزمة
افتح القفل للوصول البطاقات البالغ عددها 59 في هذه المجموعة.
فتح الحزمة
k this deck
47
If a test is very easy, the shape of the distribution will be
A) normal.
B) negatively skewed.
C) positively skewed.
D) bimodal.
A) normal.
B) negatively skewed.
C) positively skewed.
D) bimodal.
فتح الحزمة
افتح القفل للوصول البطاقات البالغ عددها 59 في هذه المجموعة.
فتح الحزمة
k this deck
48
For the scores: 4, 4, 4, 6, 6, 6, 6, 8, 8, 8, what is the shape of the distribution?
A) symmetrical
B) positively skewed
C) negatively skewed
D) bimodal
A) symmetrical
B) positively skewed
C) negatively skewed
D) bimodal
فتح الحزمة
افتح القفل للوصول البطاقات البالغ عددها 59 في هذه المجموعة.
فتح الحزمة
k this deck
49
For the scores: 85, 79, 25, 15, 85, 85, 80, 75, what is the shape of the distribution?
A) symmetrical
B) positively skewed
C) negatively skewed
D) bimodal
A) symmetrical
B) positively skewed
C) negatively skewed
D) bimodal
فتح الحزمة
افتح القفل للوصول البطاقات البالغ عددها 59 في هذه المجموعة.
فتح الحزمة
k this deck
50
For the scores: 5, 5, 7, 7, 7, 7, 10, 10, 10, 10, 12, 12, 12, 20, 20, 35, 40, what is the shape of the distribution?
A) symmetrical
B) positively skewed
C) negatively skewed
D) bimodal
A) symmetrical
B) positively skewed
C) negatively skewed
D) bimodal
فتح الحزمة
افتح القفل للوصول البطاقات البالغ عددها 59 في هذه المجموعة.
فتح الحزمة
k this deck
51
What is the benefit of creating a grouped frequency distribution table rather than an ungrouped simple frequency distribution table?
فتح الحزمة
افتح القفل للوصول البطاقات البالغ عددها 59 في هذه المجموعة.
فتح الحزمة
k this deck
52
How are bar graphs different from histograms?
فتح الحزمة
افتح القفل للوصول البطاقات البالغ عددها 59 في هذه المجموعة.
فتح الحزمة
k this deck
53
What is the main advantage of using frequency polygons over histograms?
فتح الحزمة
افتح القفل للوصول البطاقات البالغ عددها 59 في هذه المجموعة.
فتح الحزمة
k this deck
54
Identify the appropriate type of graph(s) that should be used for the variables listed below.
a. Brands of coffee _____________________
b. Degree longitude _____________________
c. Reaction time _____________________
d. Favorite flowers _____________________
e. Temperature Fahrenheit _____________________
f. Distance traveled _____________________
g. A comparison of pre-test and post-test scores _____________________
h. Ice cream preferences _____________________
فتح الحزمة
افتح القفل للوصول البطاقات البالغ عددها 59 في هذه المجموعة.
فتح الحزمة
k this deck
55
Compare and contrast positively skewed distributions and negatively skewed distributions and give an example of each.
فتح الحزمة
افتح القفل للوصول البطاقات البالغ عددها 59 في هذه المجموعة.
فتح الحزمة
k this deck
56
Identify whether scores on the following variables would result in graphs that are positively skewed (PS) or negatively skewed (NS).
a. Age at retirement __________
b. Weights of marathon runners __________
c. Income of professional athletes __________
d. Self-esteem of celebrities __________
e. Scores of 5th graders on a college entrance exam __________
f. Racing speed of tortoises __________
a. Age at retirement __________
b. Weights of marathon runners __________
c. Income of professional athletes __________
d. Self-esteem of celebrities __________
e. Scores of 5th graders on a college entrance exam __________
f. Racing speed of tortoises __________
فتح الحزمة
افتح القفل للوصول البطاقات البالغ عددها 59 في هذه المجموعة.
فتح الحزمة
k this deck
57
A set of scores has the following distribution:
a. What is N?
b. What is the cumulative frequency of a score of 10?
c. What is the percentile rank of a score of 11?
d. What is the relative frequency of a score of 9?
a. What is N?b. What is the cumulative frequency of a score of 10?
c. What is the percentile rank of a score of 11?
d. What is the relative frequency of a score of 9?
فتح الحزمة
افتح القفل للوصول البطاقات البالغ عددها 59 في هذه المجموعة.
فتح الحزمة
k this deck
58
Suppose you are constructing a grouped frequency distribution for a data set that has a high score of 59 and a low score of 35.
a. What is the range?
b. What should the size of the class interval be?
c. What should the first entry be at the bottom of the distribution?
a. What is the range?
b. What should the size of the class interval be?
c. What should the first entry be at the bottom of the distribution?
فتح الحزمة
افتح القفل للوصول البطاقات البالغ عددها 59 في هذه المجموعة.
فتح الحزمة
k this deck
59
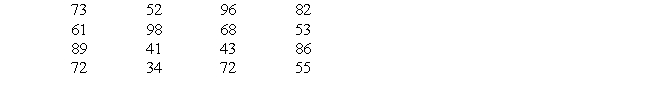
Construct a grouped frequency distribution for the following set of scores?
فتح الحزمة
افتح القفل للوصول البطاقات البالغ عددها 59 في هذه المجموعة.
فتح الحزمة
k this deck
فتح الحزمة
افتح القفل للوصول البطاقات البالغ عددها 59 في هذه المجموعة.


