Deck 17: Simple Linear Regression
ملء الشاشة (f)
سؤال
سؤال
سؤال
سؤال
سؤال
سؤال
سؤال
It is known that rXY = 0.5, sX2 = 1, sY2 = 1. A simple linear regression model is estimated. The regression line will have a slope of which one of the following?
A) 0
B) 0.5
C) 0.5 or -0.5
D) 1 or -1
E) It depends on the values of and
and  .
.
A) 0
B) 0.5
C) 0.5 or -0.5
D) 1 or -1
E) It depends on the values of
and . سؤال
سؤال
سؤال
The standardized regression slope (  )
)
A) may never be negative.
B) may never be greater than +1.00.
C) is always equal to 0.
D) None of the above.
)A) may never be negative.
B) may never be greater than +1.00.
C) is always equal to 0.
D) None of the above.
سؤال
سؤال
سؤال
سؤال
سؤال
سؤال
In which of the following situations is it most appropriate to use the simple linear regression model?
A)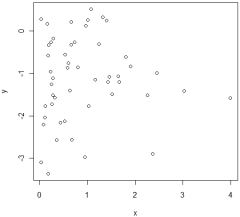
B)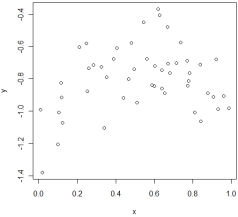
C)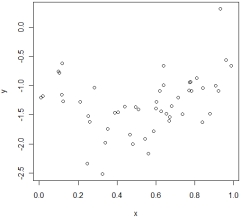
D)
A)
B)
C)
D)
سؤال
سؤال
سؤال
Derek is studying the relation between the selling price of a house (in dollars) (Y) and the age of the house (in years) (X). It is shown that rXY = - 0.2,  = 40,
= 40,  = 460,000. If Derek's own house was constructed 50 years ago, then the predicted selling price of his house based on simple linear regression would be
A) more than 460,000 dollars.
B) less than 460,000 dollars.
C) exactly 460,000 dollars.
D) impossible to be determined based on the information given.
= 40, = 460,000. If Derek's own house was constructed 50 years ago, then the predicted selling price of his house based on simple linear regression would beA) more than 460,000 dollars.
B) less than 460,000 dollars.
C) exactly 460,000 dollars.
D) impossible to be determined based on the information given.
سؤال
In simple linear regression, the unstandardized regression line will always pass
A) at least one data point.
B) at least two data points.
C) the point ( ,
,  ).
).
D) the point (0,0).
A) at least one data point.
B) at least two data points.
C) the point (
, ).D) the point (0,0).
سؤال
سؤال
سؤال
سؤال
سؤال
سؤال
سؤال
سؤال
سؤال
سؤال
Dr. Watt is studying the relation between the percentage of a population who has a bachelor's degree (X) and the average income (Y) in 108 cities. After fitting a simple linear regression model, he decides to assess whether the assumptions of the model are reasonably satisfied. Below is one of the plots he uses to assess the assumptions.
 (a) What assumption(s) is Dr. Watt trying to assess using this plot?
(b) Based on the plot, is there any indication of assumption violations? If so, which assumption(s) has (have) been violated?
(c) What are the possible consequences of the assumption violation(s)?
(d) Suggest at least one solution to fix the problem.
(a) What assumption(s) is Dr. Watt trying to assess using this plot?(b) Based on the plot, is there any indication of assumption violations? If so, which assumption(s) has (have) been violated?
(c) What are the possible consequences of the assumption violation(s)?
(d) Suggest at least one solution to fix the problem.
سؤال
سؤال
سؤال
سؤال
سؤال
Dr. Watt is studying the relation between the percentage of a population who has a bachelor's degree (X) and the average income (Y) in 108 cities. After fitting a simple linear regression model, he decides to assess whether the assumptions of the model are reasonably satisfied. Below is one of the plots he uses to assess the assumptions.
 (a) What assumption(s) is Dr. Watt trying to assess using this plot?
(b) Based on the plot, is there any indication of assumption violations? If so, which assumption(s) has (have) been violated?
(c) What are the possible consequences of the assumption violation(s)?
(d) Suggest at least one solution to fix the problem.
(a) What assumption(s) is Dr. Watt trying to assess using this plot?(b) Based on the plot, is there any indication of assumption violations? If so, which assumption(s) has (have) been violated?
(c) What are the possible consequences of the assumption violation(s)?
(d) Suggest at least one solution to fix the problem.

فتح الحزمة
قم بالتسجيل لفتح البطاقات في هذه المجموعة!
Unlock Deck
Unlock Deck
1/35
العب
ملء الشاشة (f)
Deck 17: Simple Linear Regression
1
The regression line for predicting college GPA from SAT scores is found to be Y' = 0.0016X + 0.6. Karen's SAT score is 1800, and Mary's SAT score is 1600. What is the predicted difference in their college GPA?
A) Karen's predicted GPA is 0.32 higher than Mary's predicted GPA.
B) Karen's predicted GPA is 0.92 higher than Mary's predicted GPA.
C) Karen's predicted GPA is 0.32 lower than Mary's predicted GPA.
D) Karen's predicted GPA is 0.32 lower than Mary's predicted GPA.
E) Karen and Mary have the same predicted GPA.
A
2
In simple linear regression, if the slope is found to be -0.002,
A) the value of Y is equal to -.002 when X is 0.
B) the value of Y is equal to -.002 when X is 1.
C) the value of Y will decrease by 0.002 units when X increases by 1 unit.
D) there is a negative, but very weak relationship between X and Y.
A) the value of Y is equal to -.002 when X is 0.
B) the value of Y is equal to -.002 when X is 1.
C) the value of Y will decrease by 0.002 units when X increases by 1 unit.
D) there is a negative, but very weak relationship between X and Y.
C
3
Sarah collected the data on heights and weights from 100 graduate students. Based on the data, she built a simple linear regression model to predict weight (in lbs) from height (in inches). The regression line is found to be Y' = 4X - 136. Which of the following statements is the correct interpretation of the equation?
A) When weight increases by 1 lb, height is expected to increase by 4 inches.
B) When weight decreases by 4 lbs, height is expected to increase by 1 inch.
C) When height increases by 1 inch, weight is expected to increase by 4 lbs.
D) When height increases by 4 inches, weight is expected to decrease by 1 lb.
C
4
In the scenario as described in Question 3, Sarah now used the regression line she obtained to predict the weight of her three-year old niece, who is 34 inches tall. The predicted weight for her niece, however, turned out to be 0 lb. What is the problem with Sarah's prediction?
A) Sarah must have incorrectly estimated the intercept of the regression line.
B) The regression line was correct, but a computational error was made in the prediction.
C) Sarah should have included the error term (ei) in the regression model when she made the prediction.
D) Sarah was extrapolating beyond the sample predictor data.
E) There is no problem with Sarah's prediction. This is how statistics work.
فتح الحزمة
افتح القفل للوصول البطاقات البالغ عددها 35 في هذه المجموعة.
فتح الحزمة
k this deck
5
It is known that X = 1.5, X2 = 25, Y = 10, Y2 = 0. A simple linear regression model was estimated. Which of the following is the variance of the predicted values of Y?
A) 0
B) 15
C) 25
D) 250
E) It depends on the correlation between X and Y.
A) 0
B) 15
C) 25
D) 250
E) It depends on the correlation between X and Y.
فتح الحزمة
افتح القفل للوصول البطاقات البالغ عددها 35 في هذه المجموعة.
فتح الحزمة
k this deck
6
It is known that X = 10, X2 = 16, Y = 52, Y2 = 8, XY = 0. A simple linear regression model is estimated. Which of the following statements is true?
A) X and Y are completely unrelated.
B) The slope of the regression model will be zero.
C) The intercept of the regression model will be zero.
D) The prediction of Y based on the linear model will be very accurate.
A) X and Y are completely unrelated.
B) The slope of the regression model will be zero.
C) The intercept of the regression model will be zero.
D) The prediction of Y based on the linear model will be very accurate.
فتح الحزمة
افتح القفل للوصول البطاقات البالغ عددها 35 في هذه المجموعة.
فتح الحزمة
k this deck
7
It is known that rXY = 0.5, sX2 = 1, sY2 = 1. A simple linear regression model is estimated. The regression line will have a slope of which one of the following?
A) 0
B) 0.5
C) 0.5 or -0.5
D) 1 or -1
E) It depends on the values of and .
A) 0
B) 0.5
C) 0.5 or -0.5
D) 1 or -1
E) It depends on the values of
and . فتح الحزمة
افتح القفل للوصول البطاقات البالغ عددها 35 في هذه المجموعة.
فتح الحزمة
k this deck
8
In a study of the relation between hours watching TV per day (X) and scores on the final exam (Y), the equation of regression line is found to be Y' = -7X + 100. Suppose Jamie watches TV two hours per day, and he scored a 91 on the exam. What is the residual score for Jamie?
A) -7
B) -5
C) 0
D) 5
E) 100
A) -7
B) -5
C) 0
D) 5
E) 100
فتح الحزمة
افتح القفل للوصول البطاقات البالغ عددها 35 في هذه المجموعة.
فتح الحزمة
k this deck
9
Doug wanted to use simple linear regression to study the relation between the time to complete a marathon (in hours) (Y) and the fluid intake (in ml) during the race (X). Based on the same data set, he estimated two models.
Model 1: X1 = total amount of fluid intake; Y = .00028X1 + 3.97. R12 = .014.
Model 2: X2 = amount of fluid intake per hour; Y = -.0052X2 + 7.84. R22 = .65.
Suppose for both models, all assumptions for linear regression are satisfied. Compare the two models.
A) Doug should use model 1, because the correlation between X1 and Y is stronger than that between X2 and Y (bYX1 > bYX2).
B) Doug should use model 2, because it gives more accurate prediction of Y (the finishing time) than model 1 (R12 < R22).
C) Doug should use model 1, because model 2 will give unreasonable (negative) predicted values of Y when X is large.
D) Both models are problematic, because the units of X are different from the unit of Y.
فتح الحزمة
افتح القفل للوصول البطاقات البالغ عددها 35 في هذه المجموعة.
فتح الحزمة
k this deck
10
The standardized regression slope ( )
A) may never be negative.
B) may never be greater than +1.00.
C) is always equal to 0.
D) None of the above.
)A) may never be negative.
B) may never be greater than +1.00.
C) is always equal to 0.
D) None of the above.
فتح الحزمة
افتح القفل للوصول البطاقات البالغ عددها 35 في هذه المجموعة.
فتح الحزمة
k this deck
11
If two individuals have the same observed score on the dependent variable Y, their residual scores will be which one of the following?
A) Always be equal.
B) Be equal only when they have the same score on X.
C) Be equal only when the slope equals zero.
D) Both b and c
A) Always be equal.
B) Be equal only when they have the same score on X.
C) Be equal only when the slope equals zero.
D) Both b and c
فتح الحزمة
افتح القفل للوصول البطاقات البالغ عددها 35 في هذه المجموعة.
فتح الحزمة
k this deck
12
In simple linear regression, if rXY = .3, the proportion of variation in Y that is not predictable from X is which one of the following?
A) 0.09
B) 0.3
C) 0.7
D) 0.91
E) It depends on the slope.
A) 0.09
B) 0.3
C) 0.7
D) 0.91
E) It depends on the slope.
فتح الحزمة
افتح القفل للوصول البطاقات البالغ عددها 35 في هذه المجموعة.
فتح الحزمة
k this deck
13
Bob and Brian both used simple linear regression to predict the consumption of ice cream (ml/person) (Y) based on temperature (°F) (X). However, they used two different data sets to estimate the model: Bob's sample includes only children younger than 12 (rXY = 0.6), while Brian's sample includes only adult consumers (rXY = 0.4). Which of the following statements is always true?
A) Bob and Brian will get different estimates of intercept.
B) Bob and Brian will get different estimates of slope.
C) Bob and Brian will get different prediction equations.
D) Bob and Brian will get different R2 for their models.
A) Bob and Brian will get different estimates of intercept.
B) Bob and Brian will get different estimates of slope.
C) Bob and Brian will get different prediction equations.
D) Bob and Brian will get different R2 for their models.
فتح الحزمة
افتح القفل للوصول البطاقات البالغ عددها 35 في هذه المجموعة.
فتح الحزمة
k this deck
14
In the scenario described in Question 13, suppose Bob and Brian have both converted their data to z score scale and estimated regression models using the standardized scores. Which of the following statements is false?
A) Bob and Brian will get different estimates of intercept.
B) Bob and Brian will get different estimates of slope.
C) Bob and Brian will get different prediction equations.
D) Bob and Brian will get different R2 for their model.
A) Bob and Brian will get different estimates of intercept.
B) Bob and Brian will get different estimates of slope.
C) Bob and Brian will get different prediction equations.
D) Bob and Brian will get different R2 for their model.
فتح الحزمة
افتح القفل للوصول البطاقات البالغ عددها 35 في هذه المجموعة.
فتح الحزمة
k this deck
15
The assumptions of the simple linear regression model do not include:
A) The errors are normally distributed.
B) The errors have constant variance across different values of X.
C) The errors are independent of each other.
D) The errors have mean of 0 and variance of 1.
A) The errors are normally distributed.
B) The errors have constant variance across different values of X.
C) The errors are independent of each other.
D) The errors have mean of 0 and variance of 1.
فتح الحزمة
افتح القفل للوصول البطاقات البالغ عددها 35 في هذه المجموعة.
فتح الحزمة
k this deck
16
In which of the following situations is it most appropriate to use the simple linear regression model?
A)
B)
C)
D)
A)
B)
C)
D)
فتح الحزمة
افتح القفل للوصول البطاقات البالغ عددها 35 في هذه المجموعة.
فتح الحزمة
k this deck
17
If the slope of the estimated regression line is positive, the correlation between X and Y
A) must be positive.
B) must be negative.
C) may be zero.
D) depends on the mean and variance of X and Y.
A) must be positive.
B) must be negative.
C) may be zero.
D) depends on the mean and variance of X and Y.
فتح الحزمة
افتح القفل للوصول البطاقات البالغ عددها 35 في هذه المجموعة.
فتح الحزمة
k this deck
18
If rXY = 1, which of the following statements is true?
A) All points will fall on the regression line.
B) The regression line will have an intercept of 0.
C) The regression line will have a slope of 1.
D) The prediction of future observations will be 100% accurate.
A) All points will fall on the regression line.
B) The regression line will have an intercept of 0.
C) The regression line will have a slope of 1.
D) The prediction of future observations will be 100% accurate.
فتح الحزمة
افتح القفل للوصول البطاقات البالغ عددها 35 في هذه المجموعة.
فتح الحزمة
k this deck
19
Derek is studying the relation between the selling price of a house (in dollars) (Y) and the age of the house (in years) (X). It is shown that rXY = - 0.2, = 40, = 460,000. If Derek's own house was constructed 50 years ago, then the predicted selling price of his house based on simple linear regression would be
A) more than 460,000 dollars.
B) less than 460,000 dollars.
C) exactly 460,000 dollars.
D) impossible to be determined based on the information given.
= 40, = 460,000. If Derek's own house was constructed 50 years ago, then the predicted selling price of his house based on simple linear regression would beA) more than 460,000 dollars.
B) less than 460,000 dollars.
C) exactly 460,000 dollars.
D) impossible to be determined based on the information given.
فتح الحزمة
افتح القفل للوصول البطاقات البالغ عددها 35 في هذه المجموعة.
فتح الحزمة
k this deck
20
In simple linear regression, the unstandardized regression line will always pass
A) at least one data point.
B) at least two data points.
C) the point ( , ).
D) the point (0,0).
A) at least one data point.
B) at least two data points.
C) the point (
, ).D) the point (0,0).
فتح الحزمة
افتح القفل للوصول البطاقات البالغ عددها 35 في هذه المجموعة.
فتح الحزمة
k this deck
21
Which assumption(s) involved in simple linear regression can be assessed by examining the residual plot (ei vs. Xi)?
A) Independence
B) Homogeneity
C) Linearity
D) All of the above
A) Independence
B) Homogeneity
C) Linearity
D) All of the above
فتح الحزمة
افتح القفل للوصول البطاقات البالغ عددها 35 في هذه المجموعة.
فتح الحزمة
k this deck
22
If the homogeneity assumption is violated, the possible consequences include
A) biased estimates of regression coefficients.
B) deflated standard error of estimates.
C) larger number of Type I errors.
D) nonnormal conditional distribution of Y.
A) biased estimates of regression coefficients.
B) deflated standard error of estimates.
C) larger number of Type I errors.
D) nonnormal conditional distribution of Y.
فتح الحزمة
افتح القفل للوصول البطاقات البالغ عددها 35 في هذه المجموعة.
فتح الحزمة
k this deck
23
In simple linear regression, the assumption of normality states that
A) the observed scores on Y are normally distributed.
B) the conditional distributions of Y are normal in shape.
C) the observed scores on X are normally distributed.
D) the distributions of regression coefficients are normal in shape.
E) there are no outliers.
A) the observed scores on Y are normally distributed.
B) the conditional distributions of Y are normal in shape.
C) the observed scores on X are normally distributed.
D) the distributions of regression coefficients are normal in shape.
E) there are no outliers.
فتح الحزمة
افتح القفل للوصول البطاقات البالغ عددها 35 في هذه المجموعة.
فتح الحزمة
k this deck
24
Dr. Guinea was studying the relation between the amount of caffeine intake and people's performance on a difficult task. He found out that as the amount of caffeine intake increases, the time to finish the task first decreases, and then increases. If he used the data to fit a linear regression model, which assumption would likely be violated?
A) Independence
B) Homogeneity
C) Linearity
D) Normality
E) Fixed X
A) Independence
B) Homogeneity
C) Linearity
D) Normality
E) Fixed X
فتح الحزمة
افتح القفل للوصول البطاقات البالغ عددها 35 في هذه المجموعة.
فتح الحزمة
k this deck
25
In a simple linear regression, if SSres = 150 and SStotal = 200, what is the proportion of variation in Y that is predictable from X?
A) 25%
B) 42.86%
C) 56.25%
D) 75%
A) 25%
B) 42.86%
C) 56.25%
D) 75%
فتح الحزمة
افتح القفل للوصول البطاقات البالغ عددها 35 في هذه المجموعة.
فتح الحزمة
k this deck
26
You are given the following pairs of scores on X (Pretest score) and Y (Posttest score).
a. Find the linear regression model for predicting Y from X.
b. Use the prediction model obtained to predict the value of Y for a new person who scored 80 on the pretest.
a. Find the linear regression model for predicting Y from X.
b. Use the prediction model obtained to predict the value of Y for a new person who scored 80 on the pretest.
فتح الحزمة
افتح القفل للوصول البطاقات البالغ عددها 35 في هذه المجموعة.
فتح الحزمة
k this deck
27
You are given the following pairs of scores on X (Percentage of students whose families are below poverty line) and Y (Percentage of students at or above proficiency level) for nine schools.
a. Find the linear regression model for predicting Y from X.
b. Use the prediction model obtained to predict the value of Y for a school that has 50% of students whose families are below the poverty line.
a. Find the linear regression model for predicting Y from X.
b. Use the prediction model obtained to predict the value of Y for a school that has 50% of students whose families are below the poverty line.
فتح الحزمة
افتح القفل للوصول البطاقات البالغ عددها 35 في هذه المجموعة.
فتح الحزمة
k this deck
28
The prediction equation for predicting Y (the amount of ice cream in pints consumed per person) from X (temperature in Fahrenheit) is Y' = 0.003X + 0.2. What is the observed mean for Y if X = 70 and X2 = 25?
فتح الحزمة
افتح القفل للوصول البطاقات البالغ عددها 35 في هذه المجموعة.
فتح الحزمة
k this deck
29
You are given the following pairs of scores on X (height in inches) and Y (weight in lbs).
Perform the following computations using = .05.
a. The regression equation of Y predicted by X.
b. Test of the significance of X as a predictor.
c. Plot Y versus X.
d. Compute the residuals.
e. Plot residuals versus X.
Perform the following computations using = .05.
a. The regression equation of Y predicted by X.
b. Test of the significance of X as a predictor.
c. Plot Y versus X.
d. Compute the residuals.
e. Plot residuals versus X.
فتح الحزمة
افتح القفل للوصول البطاقات البالغ عددها 35 في هذه المجموعة.
فتح الحزمة
k this deck
30
Dr. Watt is studying the relation between the percentage of a population who has a bachelor's degree (X) and the average income (Y) in 108 cities. After fitting a simple linear regression model, he decides to assess whether the assumptions of the model are reasonably satisfied. Below is one of the plots he uses to assess the assumptions.
(a) What assumption(s) is Dr. Watt trying to assess using this plot?
(b) Based on the plot, is there any indication of assumption violations? If so, which assumption(s) has (have) been violated?
(c) What are the possible consequences of the assumption violation(s)?
(d) Suggest at least one solution to fix the problem.
(a) What assumption(s) is Dr. Watt trying to assess using this plot?(b) Based on the plot, is there any indication of assumption violations? If so, which assumption(s) has (have) been violated?
(c) What are the possible consequences of the assumption violation(s)?
(d) Suggest at least one solution to fix the problem.
فتح الحزمة
افتح القفل للوصول البطاقات البالغ عددها 35 في هذه المجموعة.
فتح الحزمة
k this deck
31
You are given the following pairs of scores on X (Pretest score) and Y (Posttest score).
a. Find the linear regression model for predicting Y from X.
b. Use the prediction model obtained to predict the value of Y for a new person who scored 80 on the pretest.
a. Find the linear regression model for predicting Y from X.
b. Use the prediction model obtained to predict the value of Y for a new person who scored 80 on the pretest.
فتح الحزمة
افتح القفل للوصول البطاقات البالغ عددها 35 في هذه المجموعة.
فتح الحزمة
k this deck
32
You are given the following pairs of scores on X (Percentage of students whose families are below poverty line) and Y (Percentage of students at or above proficiency level) for nine schools.
a. Find the linear regression model for predicting Y from X.
b. Use the prediction model obtained to predict the value of Y for a school that has 50% of students whose families are below the poverty line.
a. Find the linear regression model for predicting Y from X.
b. Use the prediction model obtained to predict the value of Y for a school that has 50% of students whose families are below the poverty line.
فتح الحزمة
افتح القفل للوصول البطاقات البالغ عددها 35 في هذه المجموعة.
فتح الحزمة
k this deck
33
The prediction equation for predicting Y (the amount of ice cream in pints consumed per person) from X (temperature in Fahrenheit) is Y' = 0.003X + 0.2. What is the observed mean for Y if X = 70 and X2 = 25?
فتح الحزمة
افتح القفل للوصول البطاقات البالغ عددها 35 في هذه المجموعة.
فتح الحزمة
k this deck
34
You are given the following pairs of scores on X (height in inches) and Y (weight in lbs).
Perform the following computations using = .05.
a. The regression equation of Y predicted by X.
b. Test of the significance of X as a predictor.
c. Plot Y versus X.
d. Compute the residuals.
e. Plot residuals versus X.
Perform the following computations using = .05.
a. The regression equation of Y predicted by X.
b. Test of the significance of X as a predictor.
c. Plot Y versus X.
d. Compute the residuals.
e. Plot residuals versus X.
فتح الحزمة
افتح القفل للوصول البطاقات البالغ عددها 35 في هذه المجموعة.
فتح الحزمة
k this deck
35
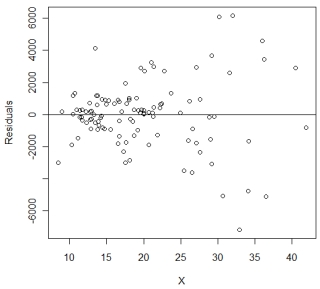
Dr. Watt is studying the relation between the percentage of a population who has a bachelor's degree (X) and the average income (Y) in 108 cities. After fitting a simple linear regression model, he decides to assess whether the assumptions of the model are reasonably satisfied. Below is one of the plots he uses to assess the assumptions.
(a) What assumption(s) is Dr. Watt trying to assess using this plot?
(b) Based on the plot, is there any indication of assumption violations? If so, which assumption(s) has (have) been violated?
(c) What are the possible consequences of the assumption violation(s)?
(d) Suggest at least one solution to fix the problem.
(a) What assumption(s) is Dr. Watt trying to assess using this plot?(b) Based on the plot, is there any indication of assumption violations? If so, which assumption(s) has (have) been violated?
(c) What are the possible consequences of the assumption violation(s)?
(d) Suggest at least one solution to fix the problem.
فتح الحزمة
افتح القفل للوصول البطاقات البالغ عددها 35 في هذه المجموعة.
فتح الحزمة
k this deck
فتح الحزمة
افتح القفل للوصول البطاقات البالغ عددها 35 في هذه المجموعة.


