Deck 12: Bivariate Statistics and Statistical Inference
ملء الشاشة (f)
سؤال
سؤال
سؤال
سؤال
سؤال
سؤال
سؤال
سؤال
سؤال
سؤال
سؤال
سؤال
سؤال
سؤال
سؤال
سؤال
سؤال
سؤال
سؤال
سؤال
سؤال
سؤال
سؤال
سؤال
سؤال
سؤال
سؤال
سؤال
سؤال
سؤال
سؤال
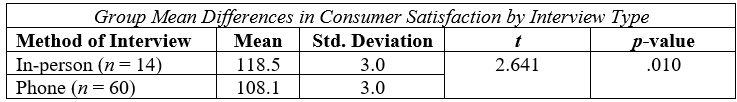
The following table reports the results of an independent samples t-test comparing consumer satisfaction between clients participating in a telephone interview and clients participating in an in-person interview. What do you surmise regarding differences in satisfaction between these two groups; is there a statistically significant difference?
سؤال

فتح الحزمة
قم بالتسجيل لفتح البطاقات في هذه المجموعة!
Unlock Deck
Unlock Deck
1/32
العب
ملء الشاشة (f)
Deck 12: Bivariate Statistics and Statistical Inference
1
Which involves making a calculated decision based on the results of an observation by employing mathematical calculation of the odds?
A) Logical inference.
B) Calculus decision making.
C) Mathematical model.
D) Statistical inference.
A) Logical inference.
B) Calculus decision making.
C) Mathematical model.
D) Statistical inference.
D
2
A statistical inference is based on which of the following?
A) The knowledge of the social worker.
B) Probability.
C) Computer technology.
D) Advanced mathematics.
A) The knowledge of the social worker.
B) Probability.
C) Computer technology.
D) Advanced mathematics.
B
3
Determining the likelihood that the findings from sample data are real is referred to as:
A) Probability testing.
B) Data testing.
C) Reality testing.
D) Statistical significance testing.
A) Probability testing.
B) Data testing.
C) Reality testing.
D) Statistical significance testing.
D
4
The null hypothesis is a statement that there is:
A) No relationship or difference.
B) A statistically significant relationship.
C) A testable research question.
D) A relationship or a difference.
A) No relationship or difference.
B) A statistically significant relationship.
C) A testable research question.
D) A relationship or a difference.
فتح الحزمة
افتح القفل للوصول البطاقات البالغ عددها 32 في هذه المجموعة.
فتح الحزمة
k this deck
5
The alternative or research hypothesis is a statement that:
A) There is a relationship or a difference.
B) Is identical to the research question.
C) Includes the association of two concepts.
D) There is a probability of truth.
A) There is a relationship or a difference.
B) Is identical to the research question.
C) Includes the association of two concepts.
D) There is a probability of truth.
فتح الحزمة
افتح القفل للوصول البطاقات البالغ عددها 32 في هذه المجموعة.
فتح الحزمة
k this deck
6
Which of the following represents a null hypothesis?
A) There is no difference between the baseline mean and the treatment mean.
B) There is a "real" relationship between income and mental health.
C) The sample has a case of sample error.
D) All of the above.
A) There is no difference between the baseline mean and the treatment mean.
B) There is a "real" relationship between income and mental health.
C) The sample has a case of sample error.
D) All of the above.
فتح الحزمة
افتح القفل للوصول البطاقات البالغ عددها 32 في هذه المجموعة.
فتح الحزمة
k this deck
7
Statistical significance testing is a process:
A) Of employing an inductive framework to uncover the truth.
B) Whereby we determine the probability that our findings are the result of sample error.
C) That has a p value that is greater than 90%.
D) When the null hypothesis is accepted.
A) Of employing an inductive framework to uncover the truth.
B) Whereby we determine the probability that our findings are the result of sample error.
C) That has a p value that is greater than 90%.
D) When the null hypothesis is accepted.
فتح الحزمة
افتح القفل للوصول البطاقات البالغ عددها 32 في هذه المجموعة.
فتح الحزمة
k this deck
8
A p-value is the probability:
A) Of a type two error.
B) That a relationship/difference found in a sample is a result of sample error.
C) Of accepting the null hypothesis.
D) All of the above.
A) Of a type two error.
B) That a relationship/difference found in a sample is a result of sample error.
C) Of accepting the null hypothesis.
D) All of the above.
فتح الحزمة
افتح القفل للوصول البطاقات البالغ عددها 32 في هذه المجموعة.
فتح الحزمة
k this deck
9
By statistical significance, we mean:
A) Proof that the research hypothesis is true.
B) That the results cannot be proven false.
C) The result is not likely to be due to sample error.
D) The truth has been uncovered.
A) Proof that the research hypothesis is true.
B) That the results cannot be proven false.
C) The result is not likely to be due to sample error.
D) The truth has been uncovered.
فتح الحزمة
افتح القفل للوصول البطاقات البالغ عددها 32 في هذه المجموعة.
فتح الحزمة
k this deck
10
Which of the following represents a Type I error?
A) Rejecting the null hypothesis when the null hypothesis is true.
B) Rejecting the null hypothesis when the null hypothesis is false.
C) Failing to reject the null hypothesis when the null hypothesis is true.
D) Failing to reject the null hypothesis when the null hypothesis is false.
A) Rejecting the null hypothesis when the null hypothesis is true.
B) Rejecting the null hypothesis when the null hypothesis is false.
C) Failing to reject the null hypothesis when the null hypothesis is true.
D) Failing to reject the null hypothesis when the null hypothesis is false.
فتح الحزمة
افتح القفل للوصول البطاقات البالغ عددها 32 في هذه المجموعة.
فتح الحزمة
k this deck
11
Which is a Type II error?
A) Rejecting the null hypothesis when the null hypothesis is true.
B) Rejecting the null hypothesis when the null hypothesis is false.
C) Failing to reject the null hypothesis when the null hypothesis is true.
D) Failing to reject the null hypothesis when the null hypothesis is false.
A) Rejecting the null hypothesis when the null hypothesis is true.
B) Rejecting the null hypothesis when the null hypothesis is false.
C) Failing to reject the null hypothesis when the null hypothesis is true.
D) Failing to reject the null hypothesis when the null hypothesis is false.
فتح الحزمة
افتح القفل للوصول البطاقات البالغ عددها 32 في هذه المجموعة.
فتح الحزمة
k this deck
12
Statistical significance testing is most appropriate:
A) When the data are from a random sample.
B) If a quota sample is used.
C) When a survey is taken.
D) All of the above.
A) When the data are from a random sample.
B) If a quota sample is used.
C) When a survey is taken.
D) All of the above.
فتح الحزمة
افتح القفل للوصول البطاقات البالغ عددها 32 في هذه المجموعة.
فتح الحزمة
k this deck
13
Research designs that involve randomization are rare in social work because of:
A) Expense.
B) Little practical application.
C) Ethical objections.
D) Knowledge.
A) Expense.
B) Little practical application.
C) Ethical objections.
D) Knowledge.
فتح الحزمة
افتح القفل للوصول البطاقات البالغ عددها 32 في هذه المجموعة.
فتح الحزمة
k this deck
14
If the sample is not truly random:
A) The significance test can overstate the accuracy of the results.
B) The population must become the sample.
C) The sample must be extremely high.
D) The null hypothesis cannot be rejected.
A) The significance test can overstate the accuracy of the results.
B) The population must become the sample.
C) The sample must be extremely high.
D) The null hypothesis cannot be rejected.
فتح الحزمة
افتح القفل للوصول البطاقات البالغ عددها 32 في هذه المجموعة.
فتح الحزمة
k this deck
15
Parametric statistics are used when:
A) At least one of the two variables being analyzed is measured at the interval or ratio level.
B) The data are normally distributed in the population.
C) The mean, median, and mode are roughly equal.
D) All of the above.
A) At least one of the two variables being analyzed is measured at the interval or ratio level.
B) The data are normally distributed in the population.
C) The mean, median, and mode are roughly equal.
D) All of the above.
فتح الحزمة
افتح القفل للوصول البطاقات البالغ عددها 32 في هذه المجموعة.
فتح الحزمة
k this deck
16
Nonparametric statistics are used for analyzing:
A) Data that are normally distributed in the population.
B) Data at the nominal level of measurement.
C) The mean, median, and mode are roughly equal.
D) None of the above.
A) Data that are normally distributed in the population.
B) Data at the nominal level of measurement.
C) The mean, median, and mode are roughly equal.
D) None of the above.
فتح الحزمة
افتح القفل للوصول البطاقات البالغ عددها 32 في هذه المجموعة.
فتح الحزمة
k this deck
17
Which of the following correlation coefficients is the strongest?
A) -.70
B) .02
C) .35
D) .52
A) -.70
B) .02
C) .35
D) .52
فتح الحزمة
افتح القفل للوصول البطاقات البالغ عددها 32 في هذه المجموعة.
فتح الحزمة
k this deck
18
A straight line drawn though the points on a scatter plot so that one half of the points are above the line and one half are below it is called:
A) A perfect correlation.
B) The line of best fit.
C) An r between .9 and 1.0.
D) The scatter plot line.
A) A perfect correlation.
B) The line of best fit.
C) An r between .9 and 1.0.
D) The scatter plot line.
فتح الحزمة
افتح القفل للوصول البطاقات البالغ عددها 32 في هذه المجموعة.
فتح الحزمة
k this deck
19
A moderate correlation or substantial relationship is represented by which of the following?
A) Less than .20
B) .20 - .40
C) .40 - .70
D) .70 - .90
A) Less than .20
B) .20 - .40
C) .40 - .70
D) .70 - .90
فتح الحزمة
افتح القفل للوصول البطاقات البالغ عددها 32 في هذه المجموعة.
فتح الحزمة
k this deck
20
The minimum expected value for each chi square cell is:
A) 1
B) 5
C) 10
D) 100
A) 1
B) 5
C) 10
D) 100
فتح الحزمة
افتح القفل للوصول البطاقات البالغ عددها 32 في هذه المجموعة.
فتح الحزمة
k this deck
21
A professor wants to know if students learn as well taking an online course versus a face-to-face course. The online class has 21 students while the face-to-face class has 16 students. The professor wants to know if the averages between the same final exams are significantly different. What statistic should be used?
A) Independent samples t-test.
B) Paired t-test.
C) One sample t-test.
D) ANOVA.
A) Independent samples t-test.
B) Paired t-test.
C) One sample t-test.
D) ANOVA.
فتح الحزمة
افتح القفل للوصول البطاقات البالغ عددها 32 في هذه المجموعة.
فتح الحزمة
k this deck
22
An administrator of a TANF program is concerned about the length of time hard-to-place clients were able to gain employment. He wants to contrast the average length of time at a job for his clients with the national average. What statistic should he use?
A) Independent samples t-test.
B) Paired t-test.
C) One sample t-test.
D) ANOVA.
A) Independent samples t-test.
B) Paired t-test.
C) One sample t-test.
D) ANOVA.
فتح الحزمة
افتح القفل للوصول البطاقات البالغ عددها 32 في هذه المجموعة.
فتح الحزمة
k this deck
23
What involves calculating the probability of committing a Type II error based on the type of test, the sample size, and an estimate of the strength of the relationship?
A) Null hypothesis testing.
B) Statistical power analysis.
C) Test of significance.
D) p-value analysis.
A) Null hypothesis testing.
B) Statistical power analysis.
C) Test of significance.
D) p-value analysis.
فتح الحزمة
افتح القفل للوصول البطاقات البالغ عددها 32 في هذه المجموعة.
فتح الحزمة
k this deck
24
Explain the relationship between statistical significance testing and probability.
فتح الحزمة
افتح القفل للوصول البطاقات البالغ عددها 32 في هذه المجموعة.
فتح الحزمة
k this deck
25
Develop a simple research question appropriate for hypothesis testing; state the null hypothesis, a nondirectional or two-tailed hypothesis; and a directional or one-tailed hypothesis.
فتح الحزمة
افتح القفل للوصول البطاقات البالغ عددها 32 في هذه المجموعة.
فتح الحزمة
k this deck
26
Several difference p-values are listed below; identify which one is considered statistically significant according to typical standards in social work research, then briefly discuss what this value actually means.
.75
.50
.03
.21
.13
.75
.50
.03
.21
.13
فتح الحزمة
افتح القفل للوصول البطاقات البالغ عددها 32 في هذه المجموعة.
فتح الحزمة
k this deck
27
Briefly describe when parametric statistics are appropriate and when nonparametric statistics are appropriate.
فتح الحزمة
افتح القفل للوصول البطاقات البالغ عددها 32 في هذه المجموعة.
فتح الحزمة
k this deck
28
A social worker conducts a research study and finds that two variables have a Pearson's r of -.45. What does this value indicate regarding the strength and the direction of the relationship between these two values?
فتح الحزمة
افتح القفل للوصول البطاقات البالغ عددها 32 في هذه المجموعة.
فتح الحزمة
k this deck
29
Using the following data, construct a cross tabulation table comparing BSW students and MSW students in terms of their value of gerontology in social work education (value or do not value). Simple addition and subtraction is necessary.
Total BSW students = 125
Total MSW students = 75
Frequency/percent of BSW students who value gerontology = 80(.64)
Frequency/percent of MSW students who value gerontology = 25(.33)
Total BSW students = 125
Total MSW students = 75
Frequency/percent of BSW students who value gerontology = 80(.64)
Frequency/percent of MSW students who value gerontology = 25(.33)
فتح الحزمة
افتح القفل للوصول البطاقات البالغ عددها 32 في هذه المجموعة.
فتح الحزمة
k this deck
30
Which statistical test of significance would be appropriate for hypothesis testing with the social work student data presented above?
فتح الحزمة
افتح القفل للوصول البطاقات البالغ عددها 32 في هذه المجموعة.
فتح الحزمة
k this deck
31
The following table reports the results of an independent samples t-test comparing consumer satisfaction between clients participating in a telephone interview and clients participating in an in-person interview. What do you surmise regarding differences in satisfaction between these two groups; is there a statistically significant difference?
فتح الحزمة
افتح القفل للوصول البطاقات البالغ عددها 32 في هذه المجموعة.
فتح الحزمة
k this deck
32
Briefly explain what is meant by statistical power.
فتح الحزمة
افتح القفل للوصول البطاقات البالغ عددها 32 في هذه المجموعة.
فتح الحزمة
k this deck
فتح الحزمة
افتح القفل للوصول البطاقات البالغ عددها 32 في هذه المجموعة.


