Deck 2: Understanding Data: Critical Concepts
ملء الشاشة (f)
سؤال
Use Figure 2.1 to answer the following 3 questions.
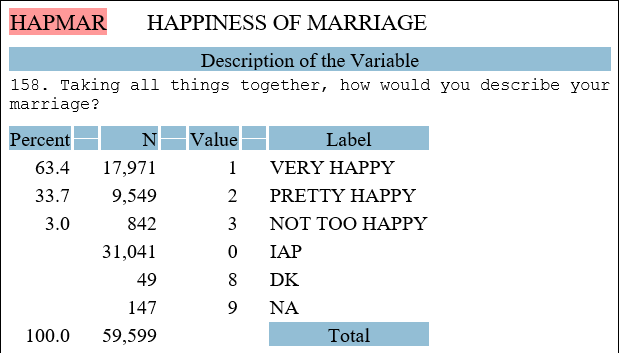
-Which of the following best describes the modal category for the variable, HAPMAR?
A) Very happy
B) Pretty happy
C) Not too happy
-Which of the following best describes the modal category for the variable, HAPMAR?
A) Very happy
B) Pretty happy
C) Not too happy
سؤال
Use Figure 2.1 to answer the following 3 questions.
-The variable, HAPMAR, is best described as what type of variable?
A) A dummy variable.
B) An ordinal-level variable.
C) An interval-ratio level variable.
-The variable, HAPMAR, is best described as what type of variable?
A) A dummy variable.
B) An ordinal-level variable.
C) An interval-ratio level variable.
سؤال
Use Figure 2.1 to answer the following 3 questions.
-The number 31,041 in Figure 2.1 indicates that:
A) 31,041 respondents refused to answer when questioned about their level of marital happiness
B) 31,041 respondents were not asked about their level of marital happiness
C) 31,041 respondents provided valid responses when asked about their level of marital happiness
D) 31,041 respondents were married.
سؤال
Use Figure 2.2 to answer the following 3 questions.
Figure 2.2
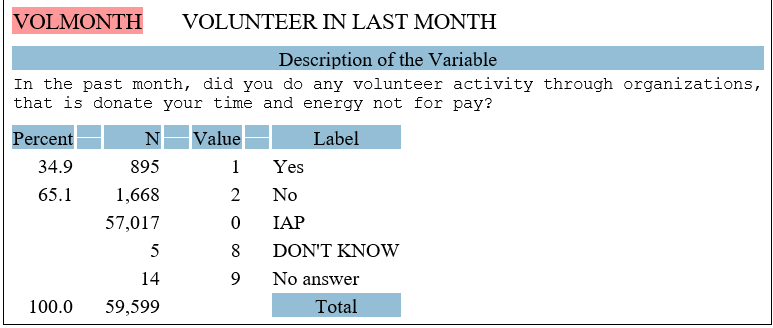
-The variable, VOLMONTH, is best described as what type of variable?
A) A dummy variable.
B) An ordinal-level variable.
C) An interval-ratio level variable.
Figure 2.2
-The variable, VOLMONTH, is best described as what type of variable?
A) A dummy variable.
B) An ordinal-level variable.
C) An interval-ratio level variable.
سؤال
Use Figure 2.2 to answer the following 3 questions.
Figure 2.2
-How many respondents indicated that they had done volunteer activity through an organization, in the past month?
A) 895
B) 1668
C) 57,017
D) 59,599
Figure 2.2
-How many respondents indicated that they had done volunteer activity through an organization, in the past month?
A) 895
B) 1668
C) 57,017
D) 59,599
سؤال
Use Figure 2.2 to answer the following 3 questions.
Figure 2.2
-Of those who provided valid responses, what percent of respondents indicated they did NOT participate in volunteer activity through an organization, in the past month?
A) 34.9%
B) 65.1%
C) 100%
D) This information is not provided in the table.
Use Figure 2.3 to answer the following questions.
سؤال
Use Figure 2.3 to answer the following questions.
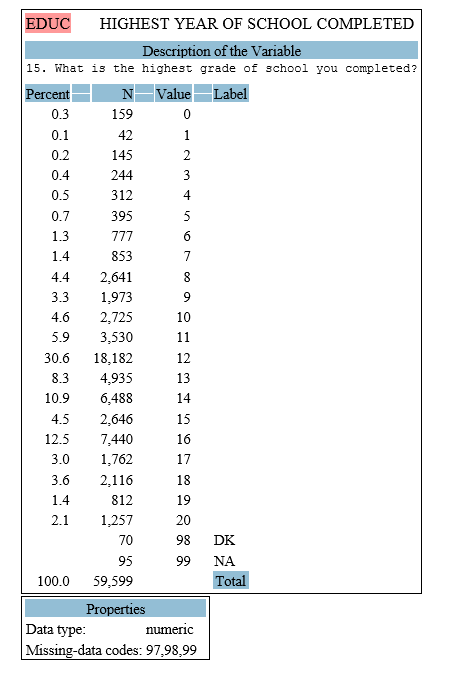
-The variable EDUC, shown in Figure 2.3, corresponds to the number of years of formal education that a respondent has. This variable is best described as a(n):
A) Nominal-level variable.
B) Dummy variable.
C) Ordinal-level variable.
D) Interval-ratio-level variable.
-The variable EDUC, shown in Figure 2.3, corresponds to the number of years of formal education that a respondent has. This variable is best described as a(n):
A) Nominal-level variable.
B) Dummy variable.
C) Ordinal-level variable.
D) Interval-ratio-level variable.
سؤال
Use Figure 2.3 to answer the following questions.
-Using the information presented in Figure 2.3, approximately what percentage of GSS respondents indicated that they have16 years of education?
A) 7.4%
B) 12.5%
C) 30.6%
D) 50%
-Using the information presented in Figure 2.3, approximately what percentage of GSS respondents indicated that they have16 years of education?
A) 7.4%
B) 12.5%
C) 30.6%
D) 50%
سؤال
Use Figure 2.3 to answer the following questions.
-Using the information presented in Figure 2.3, what is the average number of years of education that respondents report having?
A) 3.18
B) 12.0
C) 12.79
D) 97
-Using the information presented in Figure 2.3, what is the average number of years of education that respondents report having?
A) 3.18
B) 12.0
C) 12.79
D) 97
سؤال
Use Figure 2.3 to answer the following questions.
-Which of the following statements is NOT correct, according to Figure 2.3?
A) Among the GSS respondents, the category with the highest number of responses is "12 years of education"
B) Most respondents have fewer than 16 years of education
C) 70 respondents report having 98 years of formal education.
D) All of the above are true, based on the information presented in Figure 2.3

فتح الحزمة
قم بالتسجيل لفتح البطاقات في هذه المجموعة!
Unlock Deck
Unlock Deck
1/10
العب
ملء الشاشة (f)
Deck 2: Understanding Data: Critical Concepts
1
Use Figure 2.1 to answer the following 3 questions.
-Which of the following best describes the modal category for the variable, HAPMAR?
A) Very happy
B) Pretty happy
C) Not too happy
-Which of the following best describes the modal category for the variable, HAPMAR?
A) Very happy
B) Pretty happy
C) Not too happy
A
2
Use Figure 2.1 to answer the following 3 questions.
-The variable, HAPMAR, is best described as what type of variable?
A) A dummy variable.
B) An ordinal-level variable.
C) An interval-ratio level variable.
-The variable, HAPMAR, is best described as what type of variable?
A) A dummy variable.
B) An ordinal-level variable.
C) An interval-ratio level variable.
B
3
Use Figure 2.1 to answer the following 3 questions.
-The number 31,041 in Figure 2.1 indicates that:
A) 31,041 respondents refused to answer when questioned about their level of marital happiness
B) 31,041 respondents were not asked about their level of marital happiness
C) 31,041 respondents provided valid responses when asked about their level of marital happiness
D) 31,041 respondents were married.
B
4
Use Figure 2.2 to answer the following 3 questions.
Figure 2.2
-The variable, VOLMONTH, is best described as what type of variable?
A) A dummy variable.
B) An ordinal-level variable.
C) An interval-ratio level variable.
Figure 2.2
-The variable, VOLMONTH, is best described as what type of variable?
A) A dummy variable.
B) An ordinal-level variable.
C) An interval-ratio level variable.
فتح الحزمة
افتح القفل للوصول البطاقات البالغ عددها 10 في هذه المجموعة.
فتح الحزمة
k this deck
5
Use Figure 2.2 to answer the following 3 questions.
Figure 2.2
-How many respondents indicated that they had done volunteer activity through an organization, in the past month?
A) 895
B) 1668
C) 57,017
D) 59,599
Figure 2.2
-How many respondents indicated that they had done volunteer activity through an organization, in the past month?
A) 895
B) 1668
C) 57,017
D) 59,599
فتح الحزمة
افتح القفل للوصول البطاقات البالغ عددها 10 في هذه المجموعة.
فتح الحزمة
k this deck
6
Use Figure 2.2 to answer the following 3 questions.
Figure 2.2
-Of those who provided valid responses, what percent of respondents indicated they did NOT participate in volunteer activity through an organization, in the past month?
A) 34.9%
B) 65.1%
C) 100%
D) This information is not provided in the table.
Use Figure 2.3 to answer the following questions.
فتح الحزمة
افتح القفل للوصول البطاقات البالغ عددها 10 في هذه المجموعة.
فتح الحزمة
k this deck
7
Use Figure 2.3 to answer the following questions.
-The variable EDUC, shown in Figure 2.3, corresponds to the number of years of formal education that a respondent has. This variable is best described as a(n):
A) Nominal-level variable.
B) Dummy variable.
C) Ordinal-level variable.
D) Interval-ratio-level variable.
-The variable EDUC, shown in Figure 2.3, corresponds to the number of years of formal education that a respondent has. This variable is best described as a(n):
A) Nominal-level variable.
B) Dummy variable.
C) Ordinal-level variable.
D) Interval-ratio-level variable.
فتح الحزمة
افتح القفل للوصول البطاقات البالغ عددها 10 في هذه المجموعة.
فتح الحزمة
k this deck
8
Use Figure 2.3 to answer the following questions.
-Using the information presented in Figure 2.3, approximately what percentage of GSS respondents indicated that they have16 years of education?
A) 7.4%
B) 12.5%
C) 30.6%
D) 50%
-Using the information presented in Figure 2.3, approximately what percentage of GSS respondents indicated that they have16 years of education?
A) 7.4%
B) 12.5%
C) 30.6%
D) 50%
فتح الحزمة
افتح القفل للوصول البطاقات البالغ عددها 10 في هذه المجموعة.
فتح الحزمة
k this deck
9
Use Figure 2.3 to answer the following questions.
-Using the information presented in Figure 2.3, what is the average number of years of education that respondents report having?
A) 3.18
B) 12.0
C) 12.79
D) 97
-Using the information presented in Figure 2.3, what is the average number of years of education that respondents report having?
A) 3.18
B) 12.0
C) 12.79
D) 97
فتح الحزمة
افتح القفل للوصول البطاقات البالغ عددها 10 في هذه المجموعة.
فتح الحزمة
k this deck
10
Use Figure 2.3 to answer the following questions.
-Which of the following statements is NOT correct, according to Figure 2.3?
A) Among the GSS respondents, the category with the highest number of responses is "12 years of education"
B) Most respondents have fewer than 16 years of education
C) 70 respondents report having 98 years of formal education.
D) All of the above are true, based on the information presented in Figure 2.3
فتح الحزمة
افتح القفل للوصول البطاقات البالغ عددها 10 في هذه المجموعة.
فتح الحزمة
k this deck
فتح الحزمة
افتح القفل للوصول البطاقات البالغ عددها 10 في هذه المجموعة.


