Deck 9: Introduction to Regression
ملء الشاشة (f)
سؤال
سؤال
سؤال
سؤال
سؤال
سؤال
سؤال
سؤال
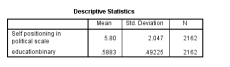
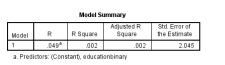
Using the diagram below, the p-value for the education binary is:
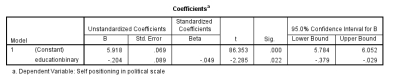
A) -0.379
B) -.204
C) 0.022
D) 0.000
A) -0.379
B) -.204
C) 0.022
D) 0.000
سؤال
سؤال
سؤال
سؤال
سؤال
سؤال
سؤال
سؤال
سؤال
سؤال
سؤال
سؤال

فتح الحزمة
قم بالتسجيل لفتح البطاقات في هذه المجموعة!
Unlock Deck
Unlock Deck
1/20
العب
ملء الشاشة (f)
Deck 9: Introduction to Regression
1
What is the constant?
A) The value of the dependent variable when the independent variable is zero
B) The slope of the line that best describes the relationship between the independent and dependent variables
C) A measure of the accuracy of the predictions made by the regression line
D) It measures how precisely the regression model estimates the coefficient's value for the population
A
2
What symbol represents the unstandardized beta coefficient?
A) yi
B) α
C) β
D) X
A) yi
B) α
C) β
D) X
C
3
What measures how precisely the regression model estimates a coefficient's value for the population?
A) Standard error of the coefficient
B) Confidence interval
C) Standard error of the estimate
D) Confidence range
A) Standard error of the coefficient
B) Confidence interval
C) Standard error of the estimate
D) Confidence range
A
4
Regression analysis is used to determine the:
A) degree of association between variables
B) median
C) amount variation within a variable
D) degree of bias within a variable
A) degree of association between variables
B) median
C) amount variation within a variable
D) degree of bias within a variable
فتح الحزمة
افتح القفل للوصول البطاقات البالغ عددها 20 في هذه المجموعة.
فتح الحزمة
k this deck
5
Which symbol represents the constant?
A) x3
B) α
C) Yi
D) β1
A) x3
B) α
C) Yi
D) β1
فتح الحزمة
افتح القفل للوصول البطاقات البالغ عددها 20 في هذه المجموعة.
فتح الحزمة
k this deck
6
The notion of helps assess the independent effect of each independent variable on the dependent variable while we make the assumption that the other independent variables are held constant.
A) control
B) standard error
C) regression
D) omitted variable bias
A) control
B) standard error
C) regression
D) omitted variable bias
فتح الحزمة
افتح القفل للوصول البطاقات البالغ عددها 20 في هذه المجموعة.
فتح الحزمة
k this deck
7
At the 95% confidence interval, a significance level of 0.02 would compel you to:
A) reject the research hypothesis
B) reject the null hypothesis
C) accept the null hypothesis
D) prove the null hypothesis
A) reject the research hypothesis
B) reject the null hypothesis
C) accept the null hypothesis
D) prove the null hypothesis
فتح الحزمة
افتح القفل للوصول البطاقات البالغ عددها 20 في هذه المجموعة.
فتح الحزمة
k this deck
8
Using the diagram below, the p-value for the education binary is:
A) -0.379
B) -.204
C) 0.022
D) 0.000
A) -0.379
B) -.204
C) 0.022
D) 0.000
فتح الحزمة
افتح القفل للوصول البطاقات البالغ عددها 20 في هذه المجموعة.
فتح الحزمة
k this deck
9
What is the unstandardized beta coefficient in regression?
A) It is the expected change in the dependent variable for a one-unit change in the independent variable
B) It is the expected change in the independent variable for a one-unit change in the dependent variable
C) It is the significance level for the test
D) The confidence interval
A) It is the expected change in the dependent variable for a one-unit change in the independent variable
B) It is the expected change in the independent variable for a one-unit change in the dependent variable
C) It is the significance level for the test
D) The confidence interval
فتح الحزمة
افتح القفل للوصول البطاقات البالغ عددها 20 في هذه المجموعة.
فتح الحزمة
k this deck
10
A constant is considered interpretable when the:
A) variable's scale has a 0 associated with it
B) variable's scale has a 1 associated with it
C) variable does not have any variation
D) variable's size is large
A) variable's scale has a 0 associated with it
B) variable's scale has a 1 associated with it
C) variable does not have any variation
D) variable's size is large
فتح الحزمة
افتح القفل للوصول البطاقات البالغ عددها 20 في هذه المجموعة.
فتح الحزمة
k this deck
11
The difference between R2 and adjusted R2 is that:
A) adjusted R2 always increases with each independent variable added while R2 does not
B) adjusted R2 takes the number of independent variables into consideration
C) R2 is better in explaining the amount of variation
D) there is really no difference between the two, especially when the number of independent variables is large
فتح الحزمة
افتح القفل للوصول البطاقات البالغ عددها 20 في هذه المجموعة.
فتح الحزمة
k this deck
12
Omitted variable bias is:
A) leaving out independent variables that explain variation in the dependent variable
B) leaving out dependent variables that explain variation in the independent variable
C) especially problematic when regression analysis includes multiple independent variables
D) especially problematic when regression analysis includes multiple dependent variables
فتح الحزمة
افتح القفل للوصول البطاقات البالغ عددها 20 في هذه المجموعة.
فتح الحزمة
k this deck
13
One strength of multivariate regression is:
A) an increase in the significance level of each independent variable
B) the confidence interval for each independent variable should be narrower when several independent variables are included in a regression equation
C) we save time from performing individual univariate regressions
D) we can tell which independent variable is the most significant in explaining variation in the dependent variable
فتح الحزمة
افتح القفل للوصول البطاقات البالغ عددها 20 في هذه المجموعة.
فتح الحزمة
k this deck
14
If in a linear regression model the dependent variable is "Test Score Percentage" and independent variable is "Hours Studied," a coefficient of 3 could be interpreted as for every:
A) three hours of study, the expected test score increases by one point
B) hour studied, the expected test score percentage increases by three points
C) one unit increase in test score percentage, the expected number of hours studied is three
D) three hours of study, a test score is expected to increase by three points
فتح الحزمة
افتح القفل للوصول البطاقات البالغ عددها 20 في هذه المجموعة.
فتح الحزمة
k this deck
15
Multicollinearity occurs when:
A) two dependent variables in an equation are highly correlated
B) two independent variables in an equation are highly correlated
C) the dependent variable and independent variable in an equation are highly correlated
D) an independent variable with explanatory power is excluded
A) two dependent variables in an equation are highly correlated
B) two independent variables in an equation are highly correlated
C) the dependent variable and independent variable in an equation are highly correlated
D) an independent variable with explanatory power is excluded
فتح الحزمة
افتح القفل للوصول البطاقات البالغ عددها 20 في هذه المجموعة.
فتح الحزمة
k this deck
16
Logistic regression is used for:
A) ordinal dependent variables
B) interval dependent variables
C) ratio dependent variables
D) binary dependent variables
A) ordinal dependent variables
B) interval dependent variables
C) ratio dependent variables
D) binary dependent variables
فتح الحزمة
افتح القفل للوصول البطاقات البالغ عددها 20 في هذه المجموعة.
فتح الحزمة
k this deck
17
In regression, when a confidence interval contains a possibility of 0 for an independent variable's coefficient:
A) the coefficient is likely significant
B) the coefficient cannot be significant because there is the possibility of there being no correlation between the independent and dependent variables in the population
C) the coefficient has a small effect on the dependent variable
D) the sample is not a representative one
فتح الحزمة
افتح القفل للوصول البطاقات البالغ عددها 20 في هذه المجموعة.
فتح الحزمة
k this deck
18
The three S's (sign, size, significance) are relevant for the:
A) unstandardized beta coefficient for each independent variable
B) the constant
C) the p-value for each independent variable
D) the dependent variable
A) unstandardized beta coefficient for each independent variable
B) the constant
C) the p-value for each independent variable
D) the dependent variable
فتح الحزمة
افتح القفل للوصول البطاقات البالغ عددها 20 في هذه المجموعة.
فتح الحزمة
k this deck
19
Why is the sign of a coefficient important?
A) It tells us whether a coefficient is significant
B) A positive coefficient indicates a large relationship; a negative coefficient indicates a small relationship
C) It is used in the determination of the confidence interval
D) It tells us whether the direction of a research hypothesis is confirmed
فتح الحزمة
افتح القفل للوصول البطاقات البالغ عددها 20 في هذه المجموعة.
فتح الحزمة
k this deck
20
The standard error of the estimate:
A) tells us whether there was a lot of error in the estimation of the coefficient
B) tells us whether the results can be applied to the population from which a sample was derived
C) is the average of all the deviations between the actual and predicted values of the dependent variable for given values of the independent variable(s)
D) is used to estimate the confidence interval for the population
فتح الحزمة
افتح القفل للوصول البطاقات البالغ عددها 20 في هذه المجموعة.
فتح الحزمة
k this deck
فتح الحزمة
افتح القفل للوصول البطاقات البالغ عددها 20 في هذه المجموعة.


