Deck 15: Data Processing and Elementary Data Analysis
ملء الشاشة (f)
سؤال
سؤال
سؤال
سؤال
سؤال
سؤال
سؤال
سؤال
سؤال
سؤال
سؤال
سؤال
سؤال
سؤال
سؤال
سؤال
سؤال
سؤال
سؤال
سؤال
سؤال
سؤال
سؤال
سؤال
سؤال
سؤال
سؤال
Consider the following table from the 2016 GSS, which shows the relationship between race and whether someone favors or opposes "the death penalty for persons convicted of murder."
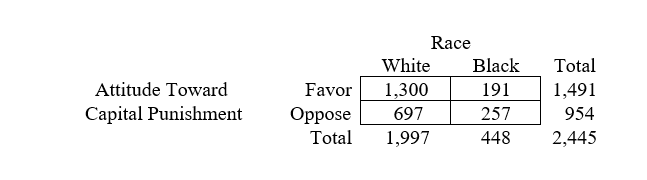 The data in this table suggest that (the answer may require some calculation)
A) there is a near-zero association between race and support for the death penalty.
B) whites are more likely to favor the death penalty than blacks.
C) blacks are more likely to favor the death penalty than whites.
The data in this table suggest that (the answer may require some calculation)A) there is a near-zero association between race and support for the death penalty.
B) whites are more likely to favor the death penalty than blacks.
C) blacks are more likely to favor the death penalty than whites.
سؤال
Consider the following table from the 2016 GSS, which shows the relationship between age and whether someone favors or opposes "the death penalty for persons convicted of murder."
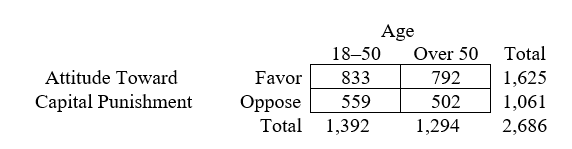 The data in this table suggest that (the answer may require some calculation)
A) there is a near-zero association between age and support for the death penalty.
B) older people are more likely to favor the death penalty than younger people.
C) younger people are more likely to favor the death penalty than older people.
The data in this table suggest that (the answer may require some calculation)A) there is a near-zero association between age and support for the death penalty.
B) older people are more likely to favor the death penalty than younger people.
C) younger people are more likely to favor the death penalty than older people.
سؤال
سؤال
سؤال
سؤال
سؤال
سؤال
سؤال
سؤال
سؤال
سؤال
سؤال
سؤال
سؤال
سؤال
سؤال
سؤال
سؤال
سؤال
سؤال
سؤال
سؤال
سؤال
سؤال
سؤال
سؤال
سؤال
سؤال
سؤال
سؤال
سؤال
سؤال
سؤال
سؤال
سؤال
سؤال
سؤال
سؤال
سؤال
سؤال
سؤال
سؤال
سؤال
سؤال
The 1994 GSS asked the following question: Do you sometimes drink more than you think you should? The table below breaks down responses to this question by sex.
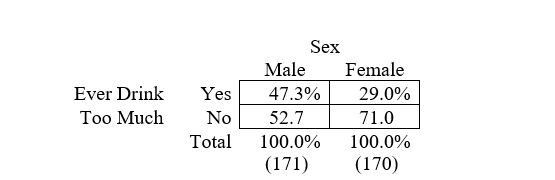 a. What is the percentage difference for determining the association between these variables?
b. Who is more likely to say that they sometimes drink more than they think they should?
c. Chi-square for this table is 12.50, which is significant at p < .001. What does this indicate about the relationship between the variables?
d. The value of phi for this table is .19. What does this statistic tell us about the relationship?
a. What is the percentage difference for determining the association between these variables?b. Who is more likely to say that they sometimes drink more than they think they should?
c. Chi-square for this table is 12.50, which is significant at p < .001. What does this indicate about the relationship between the variables?
d. The value of phi for this table is .19. What does this statistic tell us about the relationship?
سؤال

فتح الحزمة
قم بالتسجيل لفتح البطاقات في هذه المجموعة!
Unlock Deck
Unlock Deck
1/72
العب
ملء الشاشة (f)
Deck 15: Data Processing and Elementary Data Analysis
1
What is the order of steps in the quantitative analysis of survey data?
A) inspect/modify data data processing bivariate analysis multivariate testing
B) inspect/modify data data processing multivariate testing bivariate analysis
C) data processing inspect/modify data bivariate analysis multivariate testing
D) data processing inspect/modify data multivariate testing bivariate analysis
data processing inspect/modify data bivariate analysis multivariate testing
2
Editing of survey data
A) involves checking for inconsistencies and omitted responses.
B) is carried out prior to the process of data collection.
C) is applied mostly to computer-assisted interviewing surveys.
D) is the sole responsibility of the project supervisor.
A) involves checking for inconsistencies and omitted responses.
B) is carried out prior to the process of data collection.
C) is applied mostly to computer-assisted interviewing surveys.
D) is the sole responsibility of the project supervisor.
A
3
Editing may include all but which one of the following activities?
A) evaluating interviewers and detecting interview problems
B) checking for improper responses such as multiple answers to a single item
C) correcting and coding missing data
D) checking for wild code data-entry errors
A) evaluating interviewers and detecting interview problems
B) checking for improper responses such as multiple answers to a single item
C) correcting and coding missing data
D) checking for wild code data-entry errors
D
4
Which of the following statements is not true of coding responses to open-ended questions?
A) Coding categories are usually developed from a sample of 50 to 100 responses.
B) The number of coding categories usually exceeds 100.
C) Both theory and data guide the construction of coding categories.
D) Unique numbers or codes are assigned to each category of response.
A) Coding categories are usually developed from a sample of 50 to 100 responses.
B) The number of coding categories usually exceeds 100.
C) Both theory and data guide the construction of coding categories.
D) Unique numbers or codes are assigned to each category of response.
فتح الحزمة
افتح القفل للوصول البطاقات البالغ عددها 72 في هذه المجموعة.
فتح الحزمة
k this deck
5
Generally, the coding of closed-ended questions takes place
A) before data collection.
B) during data collection.
C) after data collection.
D) after data processing.
A) before data collection.
B) during data collection.
C) after data collection.
D) after data processing.
فتح الحزمة
افتح القفل للوصول البطاقات البالغ عددها 72 في هذه المجموعة.
فتح الحزمة
k this deck
6
Obtaining frequency distributions for all the variables in a data file is one way to
A) do wild-code checking.
B) do consistency checking.
C) verify data entry.
D) edit the data.
A) do wild-code checking.
B) do consistency checking.
C) verify data entry.
D) edit the data.
فتح الحزمة
افتح القفل للوصول البطاقات البالغ عددها 72 في هذه المجموعة.
فتح الحزمة
k this deck
7
Wild-code checking and consistency checking are techniques for
A) data entry.
B) data modification.
C) coding data.
D) cleaning data.
A) data entry.
B) data modification.
C) coding data.
D) cleaning data.
فتح الحزمة
افتح القفل للوصول البطاقات البالغ عددها 72 في هذه المجموعة.
فتح الحزمة
k this deck
8
What is the usual order of steps in processing completed survey interviews or questionnaires?
A) data entry coding editing cleaning
B) editing coding data entry cleaning
C) cleaning coding data entry editing
D) coding data entry cleaning editing
A) data entry coding editing cleaning
B) editing coding data entry cleaning
C) cleaning coding data entry editing
D) coding data entry cleaning editing
فتح الحزمة
افتح القفل للوصول البطاقات البالغ عددها 72 في هذه المجموعة.
فتح الحزمة
k this deck
9
In terms of data processing, one advantage of computer-assisted interviewing over paper-and-pencil questionnaire surveys is that
A) it is easier to determine if interviewers are recording answers accurately and adequately.
B) there is no need to code responses.
C) open-ended questions can be coded more easily.
D) data entry occurs directly when interviewers record respondents' answers.
A) it is easier to determine if interviewers are recording answers accurately and adequately.
B) there is no need to code responses.
C) open-ended questions can be coded more easily.
D) data entry occurs directly when interviewers record respondents' answers.
فتح الحزمة
افتح القفل للوصول البطاقات البالغ عددها 72 في هذه المجموعة.
فتح الحزمة
k this deck
10
In a data matrix, __________ are placed in rows and __________ are placed in columns.
A) variables; missing data
B) cases or observations; variables
C) dependent variables; independent variables
D) independent variables, dependent variables
A) variables; missing data
B) cases or observations; variables
C) dependent variables; independent variables
D) independent variables, dependent variables
فتح الحزمة
افتح القفل للوصول البطاقات البالغ عددها 72 في هذه المجموعة.
فتح الحزمة
k this deck
11
Codebooks may contain all but which one of the following?
A) raw survey data
B) numerical codes for each response
C) question wording
D) editing and coding rules
E) interviewer directions
A) raw survey data
B) numerical codes for each response
C) question wording
D) editing and coding rules
E) interviewer directions
فتح الحزمة
افتح القفل للوصول البطاقات البالغ عددها 72 في هذه المجموعة.
فتح الحزمة
k this deck
12
Which type(s) of statistical analysis did Broh use to examine the relationship between playing interscholastic sports and academic achievement?
A) descriptive statistics
B) inferential statistics
C) both descriptive and inferential statistics
D) neither descriptive nor inferential statistics.
A) descriptive statistics
B) inferential statistics
C) both descriptive and inferential statistics
D) neither descriptive nor inferential statistics.
فتح الحزمة
افتح القفل للوصول البطاقات البالغ عددها 72 في هذه المجموعة.
فتح الحزمة
k this deck
13
A researcher measures job satisfaction among a random sample of employees at XYZ Company and finds that 65 percent are "very satisfied" with their jobs. To estimate job satisfaction among all XYZ employees from this information, the researcher should
A) compare means.
B) study more employees.
C) use descriptive statistics.
D) use inferential statistics.
A) compare means.
B) study more employees.
C) use descriptive statistics.
D) use inferential statistics.
فتح الحزمة
افتح القفل للوصول البطاقات البالغ عددها 72 في هذه المجموعة.
فتح الحزمة
k this deck
14
Percentage distributions
A) may be applied only to interval-/ratio-scale variables.
B) should include missing values in the computation of percentages.
C) cannot be computed when there are missing data.
D) provide an explicit comparative framework for interpreting distributions.
A) may be applied only to interval-/ratio-scale variables.
B) should include missing values in the computation of percentages.
C) cannot be computed when there are missing data.
D) provide an explicit comparative framework for interpreting distributions.
فتح الحزمة
افتح القفل للوصول البطاقات البالغ عددها 72 في هذه المجموعة.
فتح الحزمة
k this deck
15
Consider the following survey question: "How satisfied are you with the direction that the country is going at this time? Would you say you are very satisfied, somewhat satisfied, not very satisfied, or not at all satisfied?" To collapse the responses into two categories, you would be best advised to
A) collapse and divide according to response similarity, such as "satisfied" versus "dissatisfied."
B) make the most frequently selected "polar" response ("very satisfied" or "not at all satisfied") one category and combine the remaining three responses into a second category.
C) combine adjacent responses to obtain an approximately equal proportion of cases in each category.
D) place valid responses in one category and missing "values" in the other.
فتح الحزمة
افتح القفل للوصول البطاقات البالغ عددها 72 في هذه المجموعة.
فتح الحزمة
k this deck
16
Univariate distributions of interval-/ratio-scale variables include all but which one of the following properties?
A) regression
B) central tendency
C) dispersion
D) shape
A) regression
B) central tendency
C) dispersion
D) shape
فتح الحزمة
افتح القفل للوصول البطاقات البالغ عددها 72 في هذه المجموعة.
فتح الحزمة
k this deck
17
If the median in a distribution is 75, this means that
A) 75 percent of the cases scored above the median.
B) a score of 75 has the highest frequency.
C) 75 is average score.
D) a score of 75 divides the frequency distribution in half.
A) 75 percent of the cases scored above the median.
B) a score of 75 has the highest frequency.
C) 75 is average score.
D) a score of 75 divides the frequency distribution in half.
فتح الحزمة
افتح القفل للوصول البطاقات البالغ عددها 72 في هذه المجموعة.
فتح الحزمة
k this deck
18
What is the mode in the following set of data? 1, 2, 2, 3, 5, 6, 9
A) 1
B) 2
C) 3
D) 4
E) 5
A) 1
B) 2
C) 3
D) 4
E) 5
فتح الحزمة
افتح القفل للوصول البطاقات البالغ عددها 72 في هذه المجموعة.
فتح الحزمة
k this deck
19
What is the median in the following set of data? 1, 2, 2, 3, 5, 6, 9
A) 1
B) 2
C) 3
D) 4
E) 5
A) 1
B) 2
C) 3
D) 4
E) 5
فتح الحزمة
افتح القفل للوصول البطاقات البالغ عددها 72 في هذه المجموعة.
فتح الحزمة
k this deck
20
In a distribution that is positively skewed, the
A) mean is greater than the median.
B) standard deviation is greater than the range.
C) median is greater than the mean.
D) median and mean are equal.
A) mean is greater than the median.
B) standard deviation is greater than the range.
C) median is greater than the mean.
D) median and mean are equal.
فتح الحزمة
افتح القفل للوصول البطاقات البالغ عددها 72 في هذه المجموعة.
فتح الحزمة
k this deck
21
In the 2014 GSS, the distribution of reported number of hours of television watched per day was
A) skewed.
B) normal.
C) abnormal.
D) bell-shaped.
A) skewed.
B) normal.
C) abnormal.
D) bell-shaped.
فتح الحزمة
افتح القفل للوصول البطاقات البالغ عددها 72 في هذه المجموعة.
فتح الحزمة
k this deck
22
Which of the following methods is not an option for handling missing data?
A) index construction
B) listwise deletion
C) recoding
D) imputation
A) index construction
B) listwise deletion
C) recoding
D) imputation
فتح الحزمة
افتح القفل للوصول البطاقات البالغ عددها 72 في هذه المجموعة.
فتح الحزمة
k this deck
23
One method of reducing data complexity through data modification is
A) imputation.
B) listwise deletion.
C) index or scale construction.
D) the use of dummy variables.
A) imputation.
B) listwise deletion.
C) index or scale construction.
D) the use of dummy variables.
فتح الحزمة
افتح القفل للوصول البطاقات البالغ عددها 72 في هذه المجموعة.
فتح الحزمة
k this deck
24
Contingency tables
A) are temporary tables produced to make collapsing decisions.
B) are designed to analyze responses to contingency questions.
C) contain data on two or more variables.
D) work best is summarizing relationships between interval-/ratio-scale variables.
A) are temporary tables produced to make collapsing decisions.
B) are designed to analyze responses to contingency questions.
C) contain data on two or more variables.
D) work best is summarizing relationships between interval-/ratio-scale variables.
فتح الحزمة
افتح القفل للوصول البطاقات البالغ عددها 72 في هذه المجموعة.
فتح الحزمة
k this deck
25
What are the marginals in a cross-tabulation or contingency table?
A) outliers
B) standard deviates
C) cell frequencies
D) lowest and highest frequencies
E) row and column totals
A) outliers
B) standard deviates
C) cell frequencies
D) lowest and highest frequencies
E) row and column totals
فتح الحزمة
افتح القفل للوصول البطاقات البالغ عددها 72 في هذه المجموعة.
فتح الحزمة
k this deck
26
To analyze the relationship in a contingency table, the rule for calculating percentages is to compute percentages based on the
A) total number of cases in the table.
B) number of cases in each category of the dependent variable.
C) number of cases in each category of the independent variable.
D) column variable, regardless of whether it is independent or dependent.
A) total number of cases in the table.
B) number of cases in each category of the dependent variable.
C) number of cases in each category of the independent variable.
D) column variable, regardless of whether it is independent or dependent.
فتح الحزمة
افتح القفل للوصول البطاقات البالغ عددها 72 في هذه المجموعة.
فتح الحزمة
k this deck
27
Consider the following table from the 2016 GSS, which shows the relationship between race and whether someone favors or opposes "the death penalty for persons convicted of murder."
The data in this table suggest that (the answer may require some calculation)
A) there is a near-zero association between race and support for the death penalty.
B) whites are more likely to favor the death penalty than blacks.
C) blacks are more likely to favor the death penalty than whites.
The data in this table suggest that (the answer may require some calculation)A) there is a near-zero association between race and support for the death penalty.
B) whites are more likely to favor the death penalty than blacks.
C) blacks are more likely to favor the death penalty than whites.
فتح الحزمة
افتح القفل للوصول البطاقات البالغ عددها 72 في هذه المجموعة.
فتح الحزمة
k this deck
28
Consider the following table from the 2016 GSS, which shows the relationship between age and whether someone favors or opposes "the death penalty for persons convicted of murder."
The data in this table suggest that (the answer may require some calculation)
A) there is a near-zero association between age and support for the death penalty.
B) older people are more likely to favor the death penalty than younger people.
C) younger people are more likely to favor the death penalty than older people.
The data in this table suggest that (the answer may require some calculation)A) there is a near-zero association between age and support for the death penalty.
B) older people are more likely to favor the death penalty than younger people.
C) younger people are more likely to favor the death penalty than older people.
فتح الحزمة
افتح القفل للوصول البطاقات البالغ عددها 72 في هذه المجموعة.
فتح الحزمة
k this deck
29
Suppose a researcher finds a statistically significant relationship between salary and job satisfaction among a random sample of employees. From this information, he can conclude that
A) there is likely to be a relationship between job satisfaction and salary.
B) differences in salary cause differences in job satisfaction.
C) salary is the most important factor in job satisfaction.
D) the relationship between salary and job satisfaction probably occurred at random.
E) there is no relationship between job satisfaction and salary.
فتح الحزمة
افتح القفل للوصول البطاقات البالغ عددها 72 في هذه المجموعة.
فتح الحزمة
k this deck
30
The chi-square test for independence indicates
A) how two variables are related to one another.
B) whether a relationship exists between variables.
C) the strength of the relationship between variables.
D) the direction of the relationship between variables.
A) how two variables are related to one another.
B) whether a relationship exists between variables.
C) the strength of the relationship between variables.
D) the direction of the relationship between variables.
فتح الحزمة
افتح القفل للوصول البطاقات البالغ عددها 72 في هذه المجموعة.
فتح الحزمة
k this deck
31
The chi-square test for independence in a contingency table addresses which of the following questions?
A) How independent are the contingencies?
B) What is the probability that these data came from a population in which the two variables are not related?
C) In the given sample, what is the degree of association between the variables?
D) Is the relationship positive or negative?
A) How independent are the contingencies?
B) What is the probability that these data came from a population in which the two variables are not related?
C) In the given sample, what is the degree of association between the variables?
D) Is the relationship positive or negative?
فتح الحزمة
افتح القفل للوصول البطاقات البالغ عددها 72 في هذه المجموعة.
فتح الحزمة
k this deck
32
In the general formula for a linear relationship, Y = a + bX, "a" is called the
A) least squares point.
B) Y-intercept.
C) regression coefficient.
D) slope.
A) least squares point.
B) Y-intercept.
C) regression coefficient.
D) slope.
فتح الحزمة
افتح القفل للوصول البطاقات البالغ عددها 72 في هذه المجموعة.
فتح الحزمة
k this deck
33
For the 2016 GSS, you regress number of hours of television watched on the average day (Y) on number of years of education completed (X) and obtain the following result:
Y = 5.37 - .18X. How much change in hours of television watched is associated with a change of one year in a respondent's education?
A) 1
B) 5.37 - .18
C) 5.37
D) -.18
Y = 5.37 - .18X. How much change in hours of television watched is associated with a change of one year in a respondent's education?
A) 1
B) 5.37 - .18
C) 5.37
D) -.18
فتح الحزمة
افتح القفل للوصول البطاقات البالغ عددها 72 في هذه المجموعة.
فتح الحزمة
k this deck
34
For the 2016 GSS, you regress number of hours of television watched on the average day (Y) on number of years of education completed (X) and obtain the following result:
Y = 5.37 - .18X. What would be the predicted number of hours of television watched per day if the respondent has completed 12 years of schooling?
A) 2.16
B) 3.21
C) 5.19
D) 6.57
Y = 5.37 - .18X. What would be the predicted number of hours of television watched per day if the respondent has completed 12 years of schooling?
A) 2.16
B) 3.21
C) 5.19
D) 6.57
فتح الحزمة
افتح القفل للوصول البطاقات البالغ عددها 72 في هذه المجموعة.
فتح الحزمة
k this deck
35
For the 2016 GSS, you regress respondent's years of education completed (Y) on father's years of education completed (X) and obtain the following result: Y = 10.24 + .32X. What would be the predicted years of a respondent's education if his or her father had completed 12 years of schooling?
A) 10.24
B) 10.56
C) 12.00
D) 14.08
A) 10.24
B) 10.56
C) 12.00
D) 14.08
فتح الحزمة
افتح القفل للوصول البطاقات البالغ عددها 72 في هذه المجموعة.
فتح الحزمة
k this deck
36
Consider the regression equation Y = −5.43 + 4.16X. This equation tells us that
A) one unit increase in X is associated with a 5.43 unit decrease in Y.
B) one unit increase in X is associated with a 4.16 unit increase in Y.
C) one unit increase in Y is associated with a 5.43 decrease in X.
D) one unit increase in Y is associated with a 4.16 increase in X
A) one unit increase in X is associated with a 5.43 unit decrease in Y.
B) one unit increase in X is associated with a 4.16 unit increase in Y.
C) one unit increase in Y is associated with a 5.43 decrease in X.
D) one unit increase in Y is associated with a 4.16 increase in X
فتح الحزمة
افتح القفل للوصول البطاقات البالغ عددها 72 في هذه المجموعة.
فتح الحزمة
k this deck
37
The difference between an actual score and the score predicted by the regression equation is called
A) a slope.
B) the explained variation.
C) a residual.
D) a regression coefficient.
A) a slope.
B) the explained variation.
C) a residual.
D) a regression coefficient.
فتح الحزمة
افتح القفل للوصول البطاقات البالغ عددها 72 في هذه المجموعة.
فتح الحزمة
k this deck
38
Suppose two variables are negatively related. Which of the following regression equations might describe this relationship?
A) Y = 3.21 + 2.41X
B) Y = −.45 + 4.12X
C) Y = 18.62 - 1.21X
A) Y = 3.21 + 2.41X
B) Y = −.45 + 4.12X
C) Y = 18.62 - 1.21X
فتح الحزمة
افتح القفل للوصول البطاقات البالغ عددها 72 في هذه المجموعة.
فتح الحزمة
k this deck
39
A correlation of −.85 indicates a __________ relationship, and a correlation of +.10 indicates a __________ relationship.
A) strong; weak
B) weak; strong
C) weak; moderate
D) weak; weak
A) strong; weak
B) weak; strong
C) weak; moderate
D) weak; weak
فتح الحزمة
افتح القفل للوصول البطاقات البالغ عددها 72 في هذه المجموعة.
فتح الحزمة
k this deck
40
Which of the following is an example of an inferential statistic?
A) range
B) mean
C) correlation coefficient
D) chi-square test for independence
A) range
B) mean
C) correlation coefficient
D) chi-square test for independence
فتح الحزمة
افتح القفل للوصول البطاقات البالغ عددها 72 في هذه المجموعة.
فتح الحزمة
k this deck
41
Suppose a small campus survey found that the correlation between alcohol consumption and GPA was −.20 with p < .18. This means that
A) there is no relationship between drinking and grades at this college.
B) there is a weak relationship between drinking and grades at this college.
C) there is a strong relationship between drinking and grades at this college.
D) the relationship between drinking and grades in not statistically significant.
فتح الحزمة
افتح القفل للوصول البطاقات البالغ عددها 72 في هذه المجموعة.
فتح الحزمة
k this deck
42
For the 2016 GSS, you code marital status as 0 = not married and 1 = married, then you regress the number of hours of television viewing per day (Y) on marital status (X) with the following result: Y = 3.1 − .32X. This result indicates that
A) married people watch, on average, 3.1 more hours of television than unmarried people.
B) married people watch, on average, 2.78 fewer hours of television than unmarried people.
C) married people watch, on average, .32 fewer hours of television than unmarried people.
D) there is no relationship between marital status and television viewing.
فتح الحزمة
افتح القفل للوصول البطاقات البالغ عددها 72 في هذه المجموعة.
فتح الحزمة
k this deck
43
Closed-ended questions usually are coded before data collection.
فتح الحزمة
افتح القفل للوصول البطاقات البالغ عددها 72 في هذه المجموعة.
فتح الحزمة
k this deck
44
Editing is carried out after all the data have been entered into a data file.
فتح الحزمة
افتح القفل للوصول البطاقات البالغ عددها 72 في هذه المجموعة.
فتح الحزمة
k this deck
45
The coding of open-ended questions is usually based on both theoretical and empirical considerations.
فتح الحزمة
افتح القفل للوصول البطاقات البالغ عددها 72 في هذه المجموعة.
فتح الحزمة
k this deck
46
Using computer-assisted interviewing eliminates the need for coding and data cleaning.
فتح الحزمة
افتح القفل للوصول البطاقات البالغ عددها 72 في هذه المجموعة.
فتح الحزمة
k this deck
47
Consistency checking is a cleaning process used to identify out-of-range codes.
فتح الحزمة
افتح القفل للوصول البطاقات البالغ عددها 72 في هذه المجموعة.
فتح الحزمة
k this deck
48
Verification may involve entering the data twice into separate files and then comparing the two files for noncomparable entries.
فتح الحزمة
افتح القفل للوصول البطاقات البالغ عددها 72 في هذه المجموعة.
فتح الحزمة
k this deck
49
Consistency checking compares entries in a data file with entries in the interview schedule or questionnaire.
فتح الحزمة
افتح القفل للوصول البطاقات البالغ عددها 72 في هذه المجموعة.
فتح الحزمة
k this deck
50
Descriptive and inferential statistics correspond to the scientific goals of description and explanation.
فتح الحزمة
افتح القفل للوصول البطاقات البالغ عددها 72 في هذه المجموعة.
فتح الحزمة
k this deck
51
Percentage distributions provide an explicit frame of reference for making comparisons among variable categories.
فتح الحزمة
افتح القفل للوصول البطاقات البالغ عددها 72 في هذه المجموعة.
فتح الحزمة
k this deck
52
In the absence of theoretical criteria, the best strategy for collapsing categories is to try to obtain an approximately equal proportion of cases in each category.
فتح الحزمة
افتح القفل للوصول البطاقات البالغ عددها 72 في هذه المجموعة.
فتح الحزمة
k this deck
53
Calculations in a percentage distribution usually are based on the total number of responses, including those coded "don't know" and "not applicable."
فتح الحزمة
افتح القفل للوصول البطاقات البالغ عددها 72 في هذه المجموعة.
فتح الحزمة
k this deck
54
The mean is a statistical property of the distribution of a nominal-scale variable.
فتح الحزمة
افتح القفل للوصول البطاقات البالغ عددها 72 في هذه المجموعة.
فتح الحزمة
k this deck
55
Outliers are unusual or suspicious values that are far removed from the preponderance of observations for a variable.
فتح الحزمة
افتح القفل للوصول البطاقات البالغ عددها 72 في هذه المجموعة.
فتح الحزمة
k this deck
56
Listwise deletion is the best method of handling missing values, regardless of the number of missing cases.
فتح الحزمة
افتح القفل للوصول البطاقات البالغ عددها 72 في هذه المجموعة.
فتح الحزمة
k this deck
57
Bivariate distributions may be constructed for variables with nominal and ordinal as well as interval and ratio measurement.
فتح الحزمة
افتح القفل للوصول البطاقات البالغ عددها 72 في هذه المجموعة.
فتح الحزمة
k this deck
58
In a cross-tabulation, the row totals and the column totals each describe univariate distributions.
فتح الحزمة
افتح القفل للوصول البطاقات البالغ عددها 72 في هذه المجموعة.
فتح الحزمة
k this deck
59
To interpret the relationship between variables in a contingency table, the rule is "percentage across, read across; percentage down, read down."
فتح الحزمة
افتح القفل للوصول البطاقات البالغ عددها 72 في هذه المجموعة.
فتح الحزمة
k this deck
60
Tests of statistical significance may be applied only to interval- and ratio-scale variables.
فتح الحزمة
افتح القفل للوصول البطاقات البالغ عددها 72 في هذه المجموعة.
فتح الحزمة
k this deck
61
The chi-square test is a measure of degree of association.
فتح الحزمة
افتح القفل للوصول البطاقات البالغ عددها 72 في هذه المجموعة.
فتح الحزمة
k this deck
62
The chi-square statistic indicates whether a relationship between two variables is likely to exist.
فتح الحزمة
افتح القفل للوصول البطاقات البالغ عددها 72 في هذه المجموعة.
فتح الحزمة
k this deck
63
Direction is a statistical property that describes the relationship between variables with nominal measurement.
فتح الحزمة
افتح القفل للوصول البطاقات البالغ عددها 72 في هذه المجموعة.
فتح الحزمة
k this deck
64
Linear regression analysis should be used only if a straight line provides a reasonable fit to the data.
فتح الحزمة
افتح القفل للوصول البطاقات البالغ عددها 72 في هذه المجموعة.
فتح الحزمة
k this deck
65
Regression coefficients indicate, among other things, the direction of the relationship between two variables.
فتح الحزمة
افتح القفل للوصول البطاقات البالغ عددها 72 في هذه المجموعة.
فتح الحزمة
k this deck
66
The correlation coefficient measures the direction and strength of association between variables.
فتح الحزمة
افتح القفل للوصول البطاقات البالغ عددها 72 في هذه المجموعة.
فتح الحزمة
k this deck
67
A dummy variable has only two coding categories.
فتح الحزمة
افتح القفل للوصول البطاقات البالغ عددها 72 في هذه المجموعة.
فتح الحزمة
k this deck
68
The quality of data is affected at several stages of social research, including data processing. What techniques do survey researchers apply to avoid errors and enhance data quality during data processing? Are data processing errors unavoidable, like random sampling error? Explain.
فتح الحزمة
افتح القفل للوصول البطاقات البالغ عددها 72 في هذه المجموعة.
فتح الحزمة
k this deck
69
Describe the differences in the univariate analysis of nominal/ordinal variables and interval/ratio variables. What descriptive statistics are used to describe each type of variable?
فتح الحزمة
افتح القفل للوصول البطاقات البالغ عددها 72 في هذه المجموعة.
فتح الحزمة
k this deck
70
Describe the differences in the bivariate analysis of nominal/ordinal variables and interval/ratio variables. What descriptive and inferential statistics are used to describe each type of variable?
فتح الحزمة
افتح القفل للوصول البطاقات البالغ عددها 72 في هذه المجموعة.
فتح الحزمة
k this deck
71
The 1994 GSS asked the following question: Do you sometimes drink more than you think you should? The table below breaks down responses to this question by sex.
a. What is the percentage difference for determining the association between these variables?
b. Who is more likely to say that they sometimes drink more than they think they should?
c. Chi-square for this table is 12.50, which is significant at p < .001. What does this indicate about the relationship between the variables?
d. The value of phi for this table is .19. What does this statistic tell us about the relationship?
a. What is the percentage difference for determining the association between these variables?b. Who is more likely to say that they sometimes drink more than they think they should?
c. Chi-square for this table is 12.50, which is significant at p < .001. What does this indicate about the relationship between the variables?
d. The value of phi for this table is .19. What does this statistic tell us about the relationship?
فتح الحزمة
افتح القفل للوصول البطاقات البالغ عددها 72 في هذه المجموعة.
فتح الحزمة
k this deck
72
For the 2012 GSS, the regression of respondent's income in constant dollars (Y) on years of education (X) yields the following equation: Y = -45,204.31 + 5,293.56X.
A) What is the value of the regression coefficient?
B) How much does income (Y) increase for each increase of one year of education?
C) What is the predicted income in 2012 for a person with a bachelor's degree (16 years of education)?
D) The correlation between income and years of education is .28. What does this tell you about this relationship?
فتح الحزمة
افتح القفل للوصول البطاقات البالغ عددها 72 في هذه المجموعة.
فتح الحزمة
k this deck
فتح الحزمة
افتح القفل للوصول البطاقات البالغ عددها 72 في هذه المجموعة.


