Deck 6: Correlation
ملء الشاشة (f)
سؤال
سؤال
سؤال
سؤال
سؤال
سؤال
سؤال
سؤال
سؤال
سؤال
سؤال
سؤال
سؤال
سؤال
سؤال
سؤال
سؤال
سؤال
سؤال
سؤال
سؤال
سؤال
سؤال
سؤال
A traffic safety officer conducted an experiment to determine whether there is a correlation between people's ages and driving speeds. Six individuals were randomly sampled and the following data were collected.  The proportion of variability of Y accounted for by X is _________.
A) 0.49
B) 0.67
C) 0.40
D) - 0.49
The proportion of variability of Y accounted for by X is _________.A) 0.49
B) 0.67
C) 0.40
D) - 0.49
سؤال
سؤال
سؤال
سؤال
A traffic safety officer conducted an experiment to determine whether there is a correlation between people's ages and driving speeds. Six individuals were randomly sampled and the following data were collected.  The value of Pearson r equals _________.
A) - 0.82
B) - 0.70
C) - 0.63
D) +0.70
The value of Pearson r equals _________.A) - 0.82
B) - 0.70
C) - 0.63
D) +0.70
سؤال
A researcher wanted to know if the order in which runners finish a race is correlated with their weight. She conducts an experiment and the data are given below.  What is the appropriate correlation coefficient for these data?
A) r
B) rho
C) phi
D) biserial
What is the appropriate correlation coefficient for these data?A) r
B) rho
C) phi
D) biserial
سؤال
سؤال
سؤال
سؤال
سؤال
سؤال
سؤال
سؤال
سؤال
A researcher wanted to know if the order in which runners finish a race is correlated with their weight. She conducts an experiment and the data are given below.  The correlation for these data equals _________.
A) 0.31
B) 0.32
C) 0.41
D) 0.45
The correlation for these data equals _________.A) 0.31
B) 0.32
C) 0.41
D) 0.45
سؤال
سؤال
سؤال
سؤال
For the following X and Y scores, how much of the variability of Y is accounted for by knowledge of X ? Assume a linear relationship. 
A) 68%
B) 34%
C) 58%
D) 27%
A) 68%
B) 34%
C) 58%
D) 27%
سؤال
سؤال
سؤال
سؤال
سؤال
سؤال
سؤال
سؤال
سؤال
سؤال
سؤال
سؤال
What is the value of r for the following relationship between height and weight? 
A) 0.87
B) 0.76
C) 0.93
D) 0.56
A) 0.87
B) 0.76
C) 0.93
D) 0.56
سؤال
سؤال
سؤال
سؤال
سؤال
سؤال
What is the value of the Spearman rank order correlation coefficient (rho) for the following pairs of ranks? 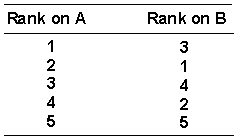
A) 0.40
B) 0.50
C) 0.60
D) 0.70
A) 0.40
B) 0.50
C) 0.60
D) 0.70
سؤال
سؤال
سؤال
سؤال
سؤال
سؤال
سؤال
سؤال
سؤال
سؤال
سؤال
سؤال
سؤال
سؤال
سؤال
سؤال
سؤال
سؤال
سؤال
سؤال

فتح الحزمة
قم بالتسجيل لفتح البطاقات في هذه المجموعة!
Unlock Deck
Unlock Deck
1/139
العب
ملء الشاشة (f)
Deck 6: Correlation
1
In a positive relationship, _________.
A) as X increases, Y increases
B) as X decreases, Y decreases
C) as X increases, Y increases and as X decreases, Y decreases
D) as X increases, Y decreases
A) as X increases, Y increases
B) as X decreases, Y decreases
C) as X increases, Y increases and as X decreases, Y decreases
D) as X increases, Y decreases
as X increases, Y increases and as X decreases, Y decreases
2
Which of the following is(are) correct interpretation(s) of correlation? Correlation _________.
A) indicates the degree of the relationship between two variables
B) indicates a causal relationship between two variables
C) is useful in deciding which variables to manipulate in an experimental study
D) a and b
E) a and c
A) indicates the degree of the relationship between two variables
B) indicates a causal relationship between two variables
C) is useful in deciding which variables to manipulate in an experimental study
D) a and b
E) a and c
a and c
3
In an imperfect relationship, _________.
A) all the points fall on the line
B) a relationship exists, but all of the points do not fall on the line
C) no relationship exists
D) a relationship exists, but none of the points can fall on the line
A) all the points fall on the line
B) a relationship exists, but all of the points do not fall on the line
C) no relationship exists
D) a relationship exists, but none of the points can fall on the line
a relationship exists, but all of the points do not fall on the line
4
If the correlation between variables X and Y is 0.95, which of the following is true?
A) X is a cause of Y
B) Y is a cause of X
C) low scores on X are accompanied by high scores on Y
D) high scores on X are accompanied by high scores on Y
E) a and d
A) X is a cause of Y
B) Y is a cause of X
C) low scores on X are accompanied by high scores on Y
D) high scores on X are accompanied by high scores on Y
E) a and d
فتح الحزمة
افتح القفل للوصول البطاقات البالغ عددها 139 في هذه المجموعة.
فتح الحزمة
k this deck
5
Correlation and regression differ in that _________.
A) correlation is primarily concerned with the size and direction of relationships
B) regression is primarily used for prediction
C) both of these are true
D) neither of these are true
A) correlation is primarily concerned with the size and direction of relationships
B) regression is primarily used for prediction
C) both of these are true
D) neither of these are true
فتح الحزمة
افتح القفل للوصول البطاقات البالغ عددها 139 في هذه المجموعة.
فتح الحزمة
k this deck
6
The lowest degree of correlation shown below is _________.
A) 0.75
B) - 0.33
C) - 0.25
D) 0.15
A) 0.75
B) - 0.33
C) - 0.25
D) 0.15
فتح الحزمة
افتح القفل للوصول البطاقات البالغ عددها 139 في هذه المجموعة.
فتح الحزمة
k this deck
7
In the equation Y = bX + a , X and Y , a is _________.
A) a constant giving the value of the Y axis intercept
B) a constant giving the value of the slope of the line
C) a variable relating X to Y
D) a variable relating Y to X
A) a constant giving the value of the Y axis intercept
B) a constant giving the value of the slope of the line
C) a variable relating X to Y
D) a variable relating Y to X
فتح الحزمة
افتح القفل للوصول البطاقات البالغ عددها 139 في هذه المجموعة.
فتح الحزمة
k this deck
8
Y can be most accurately predicted from X if the correlation between X and Y is _________.
A) 0.80
B) 0.00
C) 0.45
D) - 0.98
A) 0.80
B) 0.00
C) 0.45
D) - 0.98
فتح الحزمة
افتح القفل للوصول البطاقات البالغ عددها 139 في هذه المجموعة.
فتح الحزمة
k this deck
9
A scatter plot _________.
A) has to do with electron scatter
B) is a graph of paired X and Y values
C) must be linear
D) is a frequency graph of X values
A) has to do with electron scatter
B) is a graph of paired X and Y values
C) must be linear
D) is a frequency graph of X values
فتح الحزمة
افتح القفل للوصول البطاقات البالغ عددها 139 في هذه المجموعة.
فتح الحزمة
k this deck
10
The correlation coefficient between heights from the ground of two people on the opposite ends of a seesaw would be _________.
A) 1.0
B) 0
C) - 1.0
D) cannot tell without further information
A) 1.0
B) 0
C) - 1.0
D) cannot tell without further information
فتح الحزمة
افتح القفل للوصول البطاقات البالغ عددها 139 في هذه المجموعة.
فتح الحزمة
k this deck
11
In a perfect relationship, _________.
A) all the points fall on the line
B) none of the points fall on the line
C) some of the points fall on the line
D) the points form an ellipse around the line
A) all the points fall on the line
B) none of the points fall on the line
C) some of the points fall on the line
D) the points form an ellipse around the line
فتح الحزمة
افتح القفل للوصول البطاقات البالغ عددها 139 في هذه المجموعة.
فتح الحزمة
k this deck
12
In a negative relationship, _________.
A) b is positive
B) b can be either positive or negative
C) a must be negative
D) b is negative
A) b is positive
B) b can be either positive or negative
C) a must be negative
D) b is negative
فتح الحزمة
افتح القفل للوصول البطاقات البالغ عددها 139 في هذه المجموعة.
فتح الحزمة
k this deck
13
In the equation Y = bX + a , X and Y are _________.
A) constants
B) statistics
C) population parameters
D) variables
A) constants
B) statistics
C) population parameters
D) variables
فتح الحزمة
افتح القفل للوصول البطاقات البالغ عددها 139 في هذه المجموعة.
فتح الحزمة
k this deck
14
The closer the points on a scatter diagram fall to the regression line, the _________ between the scores.
A) higher the correlation
B) lower the correlation
C) correlation doesn't change
D) need more information
A) higher the correlation
B) lower the correlation
C) correlation doesn't change
D) need more information
فتح الحزمة
افتح القفل للوصول البطاقات البالغ عددها 139 في هذه المجموعة.
فتح الحزمة
k this deck
15
Which Pearson correlation coefficient shows the strongest relationship between two variables?
A) - 0.80
B) 0.00
C) 0.75
D) 0.20
E) 0.03
A) - 0.80
B) 0.00
C) 0.75
D) 0.20
E) 0.03
فتح الحزمة
افتح القفل للوصول البطاقات البالغ عددها 139 في هذه المجموعة.
فتح الحزمة
k this deck
16
A relationship can be _________.
A) perfect
B) imperfect
C) nonexistant
D) all of these
A) perfect
B) imperfect
C) nonexistant
D) all of these
فتح الحزمة
افتح القفل للوصول البطاقات البالغ عددها 139 في هذه المجموعة.
فتح الحزمة
k this deck
17
In the equation Y = bX + a , X and Y , b is _________.
A) a constant
B) the slope of the line
C) the Y axis intercept
D) a constant and slope of the line
E) a variable
A) a constant
B) the slope of the line
C) the Y axis intercept
D) a constant and slope of the line
E) a variable
فتح الحزمة
افتح القفل للوصول البطاقات البالغ عددها 139 في هذه المجموعة.
فتح الحزمة
k this deck
18
In a positive relationship, _________.
A) b is negative
B) b is positive
C) a must be positive
D) a must be negative
A) b is negative
B) b is positive
C) a must be positive
D) a must be negative
فتح الحزمة
افتح القفل للوصول البطاقات البالغ عددها 139 في هذه المجموعة.
فتح الحزمة
k this deck
19
In a negative relationship, _________.
A) as X increases, Y increases
B) as X decreases, Y decreases
C) as X increases, Y increases, and as X decreases, Y decreases
D) as X increases, Y decreases
A) as X increases, Y increases
B) as X decreases, Y decreases
C) as X increases, Y increases, and as X decreases, Y decreases
D) as X increases, Y decreases
فتح الحزمة
افتح القفل للوصول البطاقات البالغ عددها 139 في هذه المجموعة.
فتح الحزمة
k this deck
20
If a relationship is linear, _________.
A) the relation can be most accurately represented by a straight line
B) all the points fall on a curved line
C) the relationship is best represented by a curved line
D) all the points must fall on a straight line
A) the relation can be most accurately represented by a straight line
B) all the points fall on a curved line
C) the relationship is best represented by a curved line
D) all the points must fall on a straight line
فتح الحزمة
افتح القفل للوصول البطاقات البالغ عددها 139 في هذه المجموعة.
فتح الحزمة
k this deck
21
It is possible to compute a coefficient of correlation if one is given _________.
A) a single score
B) two sets of measurements on the same individuals
C) 50 scores of a clerical aptitude test
D) all of these
E) none of these
A) a single score
B) two sets of measurements on the same individuals
C) 50 scores of a clerical aptitude test
D) all of these
E) none of these
فتح الحزمة
افتح القفل للوصول البطاقات البالغ عددها 139 في هذه المجموعة.
فتح الحزمة
k this deck
22
When a correlation exists, lowering the range of either of the variables will _________.
A) raise the correlation
B) lower the correlation
C) not change the correlation
D) produce a causal relationship
A) raise the correlation
B) lower the correlation
C) not change the correlation
D) produce a causal relationship
فتح الحزمة
افتح القفل للوصول البطاقات البالغ عددها 139 في هذه المجموعة.
فتح الحزمة
k this deck
23
If the correlation between two variables is - 1.00 and the score of a given individual is 2.20 standard deviations above the mean on one of the variables, we would predict a score on the second variable of _________.
A) 2.20 standard deviations below the mean
B) 2.20 standard deviations above the mean
C) more than 2.20 standard deviations above the mean
D) more than 2.20 standard deviations below the mean
A) 2.20 standard deviations below the mean
B) 2.20 standard deviations above the mean
C) more than 2.20 standard deviations above the mean
D) more than 2.20 standard deviations below the mean
فتح الحزمة
افتح القفل للوصول البطاقات البالغ عددها 139 في هذه المجموعة.
فتح الحزمة
k this deck
24
A traffic safety officer conducted an experiment to determine whether there is a correlation between people's ages and driving speeds. Six individuals were randomly sampled and the following data were collected. The proportion of variability of Y accounted for by X is _________.
A) 0.49
B) 0.67
C) 0.40
D) - 0.49
The proportion of variability of Y accounted for by X is _________.A) 0.49
B) 0.67
C) 0.40
D) - 0.49
فتح الحزمة
افتح القفل للوصول البطاقات البالغ عددها 139 في هذه المجموعة.
فتح الحزمة
k this deck
25
After several studies, Professor Smith concludes that there is a zero correlation between body weight and bad tempers. This means that _________.
A) heavy people tend to have bad tempers
B) skinny people tend to have bad tempers
C) no one has a bad temper
D) everyone has a bad temper
E) a person with a bad temper may be heavy or skinny
A) heavy people tend to have bad tempers
B) skinny people tend to have bad tempers
C) no one has a bad temper
D) everyone has a bad temper
E) a person with a bad temper may be heavy or skinny
فتح الحزمة
افتح القفل للوصول البطاقات البالغ عددها 139 في هذه المجموعة.
فتح الحزمة
k this deck
26
Which of the following values of r represents the strongest degree of relationship between two variables?
A) 0.55
B) 0.00
C) 0.78
D) - 0.80
A) 0.55
B) 0.00
C) 0.78
D) - 0.80
فتح الحزمة
افتح القفل للوصول البطاقات البالغ عددها 139 في هذه المجموعة.
فتح الحزمة
k this deck
27
If N is small, an extreme score _________.
A) won't affect r obt unduly
B) should be thrown out
C) might have a large effect on r obt
D) has no effect on the value of r obt
A) won't affect r obt unduly
B) should be thrown out
C) might have a large effect on r obt
D) has no effect on the value of r obt
فتح الحزمة
افتح القفل للوصول البطاقات البالغ عددها 139 في هذه المجموعة.
فتح الحزمة
k this deck
28
A traffic safety officer conducted an experiment to determine whether there is a correlation between people's ages and driving speeds. Six individuals were randomly sampled and the following data were collected. The value of Pearson r equals _________.
A) - 0.82
B) - 0.70
C) - 0.63
D) +0.70
The value of Pearson r equals _________.A) - 0.82
B) - 0.70
C) - 0.63
D) +0.70
فتح الحزمة
افتح القفل للوصول البطاقات البالغ عددها 139 في هذه المجموعة.
فتح الحزمة
k this deck
29
A researcher wanted to know if the order in which runners finish a race is correlated with their weight. She conducts an experiment and the data are given below. What is the appropriate correlation coefficient for these data?
A) r
B) rho
C) phi
D) biserial
What is the appropriate correlation coefficient for these data?A) r
B) rho
C) phi
D) biserial
فتح الحزمة
افتح القفل للوصول البطاقات البالغ عددها 139 في هذه المجموعة.
فتح الحزمة
k this deck
30
Which of the following statements is true?
A) Correlation implies causation.
B) Causation implies correlation.
C) neither of these
D) both of these
A) Correlation implies causation.
B) Causation implies correlation.
C) neither of these
D) both of these
فتح الحزمة
افتح القفل للوصول البطاقات البالغ عددها 139 في هذه المجموعة.
فتح الحزمة
k this deck
31
Which of the following is (are) not correct interpretations of Pearson r ?
A) ratio of the variability of Y to the variability of X
B) measure of extent to which paired scores occupy the same or opposite positions within their own distributions
C) difference between the variability of Y and the variability of X
D) square root of the proportion of the total variability of Y accounted for by X
E) a and c
فتح الحزمة
افتح القفل للوصول البطاقات البالغ عددها 139 في هذه المجموعة.
فتح الحزمة
k this deck
32
Rho is used _________.
A) when both variables are dichotomous
B) when both variables are of interval or ratio scaling
C) when one or both variables are only of ordinal scaling
D) when the data is nonlinear
A) when both variables are dichotomous
B) when both variables are of interval or ratio scaling
C) when one or both variables are only of ordinal scaling
D) when the data is nonlinear
فتح الحزمة
افتح القفل للوصول البطاقات البالغ عددها 139 في هذه المجموعة.
فتح الحزمة
k this deck
33
Which of the following is (are) not correlation coefficients?
A) Pearson r
B) eta
C) rho
D) phi
E) they all are correlation coefficients
A) Pearson r
B) eta
C) rho
D) phi
E) they all are correlation coefficients
فتح الحزمة
افتح القفل للوصول البطاقات البالغ عددها 139 في هذه المجموعة.
فتح الحزمة
k this deck
34
Knowing nothing more than that IQ and memory scores are correlated 0.84, you could validly conclude that _________.
A) good memory causes high IQ
B) high IQ causes good memory
C) neither good memory nor high IQ cause each other
D) a third variable causes both good memory and high IQ
E) none of these
A) good memory causes high IQ
B) high IQ causes good memory
C) neither good memory nor high IQ cause each other
D) a third variable causes both good memory and high IQ
E) none of these
فتح الحزمة
افتح القفل للوصول البطاقات البالغ عددها 139 في هذه المجموعة.
فتح الحزمة
k this deck
35
Which of the following statements concerning Pearson r is not true?
A) r = 0.00 represents the absence of a relationship.
B) The relationship between the two variables must be nonlinear.
C) r = 0.76 has the same predictive power as r = - 0.76.
D) r = 1.00 represents a perfect relationship.
E) All of these are true statements.
A) r = 0.00 represents the absence of a relationship.
B) The relationship between the two variables must be nonlinear.
C) r = 0.76 has the same predictive power as r = - 0.76.
D) r = 1.00 represents a perfect relationship.
E) All of these are true statements.
فتح الحزمة
افتح القفل للوصول البطاقات البالغ عددها 139 في هذه المجموعة.
فتح الحزمة
k this deck
36
What is the slope for the points X 1 = 30, Y 1 = 50 and X 2 = 25 and Y 2 = 40?
A) 2.00
B) 0.50
C) - 2.00
D) - 0.50
A) 2.00
B) 0.50
C) - 2.00
D) - 0.50
فتح الحزمة
افتح القفل للوصول البطاقات البالغ عددها 139 في هذه المجموعة.
فتح الحزمة
k this deck
37
A correlation between college entrance exam grades and scholastic achievement was found to be - 1.08. On the basis of this you would tell the university that _________.
A) the entrance exam is a good predictor of success
B) they should hire a new statistician
C) the exam is a poor predictor of success
D) students who do best on this exam will make the worst students
E) students are this school are underachieving
A) the entrance exam is a good predictor of success
B) they should hire a new statistician
C) the exam is a poor predictor of success
D) students who do best on this exam will make the worst students
E) students are this school are underachieving
فتح الحزمة
افتح القفل للوصول البطاقات البالغ عددها 139 في هذه المجموعة.
فتح الحزمة
k this deck
38
A researcher wanted to know if the order in which runners finish a race is correlated with their weight. She conducts an experiment and the data are given below. The correlation for these data equals _________.
A) 0.31
B) 0.32
C) 0.41
D) 0.45
The correlation for these data equals _________.A) 0.31
B) 0.32
C) 0.41
D) 0.45
فتح الحزمة
افتح القفل للوصول البطاقات البالغ عددها 139 في هذه المجموعة.
فتح الحزمة
k this deck
39
When deciding which measure of correlation to employ with a specific set of data, you should consider _________.
A) whether the relationship is linear or nonlinear
B) type of scale of measurement for each variable
C) a and b
D) none of these
A) whether the relationship is linear or nonlinear
B) type of scale of measurement for each variable
C) a and b
D) none of these
فتح الحزمة
افتح القفل للوصول البطاقات البالغ عددها 139 في هذه المجموعة.
فتح الحزمة
k this deck
40
The proportion of variance accounted for by a correlation between two variables is determined by _________.
A) Y 2
B) r 2
C) r
D) b
A) Y 2
B) r 2
C) r
D) b
فتح الحزمة
افتح القفل للوصول البطاقات البالغ عددها 139 في هذه المجموعة.
فتح الحزمة
k this deck
41
Causation implies correlation.
فتح الحزمة
افتح القفل للوصول البطاقات البالغ عددها 139 في هذه المجموعة.
فتح الحزمة
k this deck
42
For the following X and Y scores, how much of the variability of Y is accounted for by knowledge of X ? Assume a linear relationship.
A) 68%
B) 34%
C) 58%
D) 27%
A) 68%
B) 34%
C) 58%
D) 27%
فتح الحزمة
افتح القفل للوصول البطاقات البالغ عددها 139 في هذه المجموعة.
فتح الحزمة
k this deck
43
If one calculates r for raw scores, and then calculates r on the z scores of the same data, the value of r will _______.
A) stay the same
B) decrease
C) increase
D) equal 1.00
A) stay the same
B) decrease
C) increase
D) equal 1.00
فتح الحزمة
افتح القفل للوصول البطاقات البالغ عددها 139 في هذه المجموعة.
فتح الحزمة
k this deck
44
In order for the correlation coefficient to be negative, which of the following must be true?
A) ΣXY > ( ΣX )( Σ Y )/ N
B) ΣXY (ΣX )( ΣY )/ N
C) ΣXY = ( ΣX )( ΣY )/ N
D) ΣXY must be zero
A) ΣXY > ( ΣX )( Σ Y )/ N
B) ΣXY (ΣX )( ΣY )/ N
C) ΣXY = ( ΣX )( ΣY )/ N
D) ΣXY must be zero
فتح الحزمة
افتح القفل للوصول البطاقات البالغ عددها 139 في هذه المجموعة.
فتح الحزمة
k this deck
45
If one takes a sample of pairs of points over a narrow range of X or Y scores, what effect might this have on the value of r ?
A) inflate r
B) have no effect on r
C) reduce r
D) cannot be determined
A) inflate r
B) have no effect on r
C) reduce r
D) cannot be determined
فتح الحزمة
افتح القفل للوصول البطاقات البالغ عددها 139 في هذه المجموعة.
فتح الحزمة
k this deck
46
Pearson r is _______.
A) a measure of the extent to which paired scores occupy the same or opposite positions within their own distributions.
B) the square root of the proportion of the variability of Y that is accounted for by X .
C) used when both variables are of interval or ratio scaling.
D) All of these are true.
A) a measure of the extent to which paired scores occupy the same or opposite positions within their own distributions.
B) the square root of the proportion of the variability of Y that is accounted for by X .
C) used when both variables are of interval or ratio scaling.
D) All of these are true.
فتح الحزمة
افتح القفل للوصول البطاقات البالغ عددها 139 في هذه المجموعة.
فتح الحزمة
k this deck
47
For a linear relationship to exist, all the points must fall on a straight line.
فتح الحزمة
افتح القفل للوصول البطاقات البالغ عددها 139 في هذه المجموعة.
فتح الحزمة
k this deck
48
If a correlation is perfect,
A) all the points must fall on a straight line
B) all the points must fall on a curve line
C) most the points must fall on the line, but some can miss it.
D) all the points must fall on a straight or curved line,
A) all the points must fall on a straight line
B) all the points must fall on a curve line
C) most the points must fall on the line, but some can miss it.
D) all the points must fall on a straight or curved line,
فتح الحزمة
افتح القفل للوصول البطاقات البالغ عددها 139 في هذه المجموعة.
فتح الحزمة
k this deck
49
A correlation of r = 0.60 exists between a set of X and Y scores. If a constant of 10 is added to each score of both distributions, the value of r will _______.
A) remain the same
B) will increase
C) decrease
D) be less meaningful
E) will increase and be less meaningful
A) remain the same
B) will increase
C) decrease
D) be less meaningful
E) will increase and be less meaningful
فتح الحزمة
افتح القفل للوصول البطاقات البالغ عددها 139 في هذه المجموعة.
فتح الحزمة
k this deck
50
If zX equals zY for each pair of points, r will equal _______.
A) 0.00
B) - 1.00
C) 1.00
D) 0.50
A) 0.00
B) - 1.00
C) 1.00
D) 0.50
فتح الحزمة
افتح القفل للوصول البطاقات البالغ عددها 139 في هذه المجموعة.
فتح الحزمة
k this deck
51
You have noticed that as people eat more ice cream they also have darker suntans. From this observation, you conclude _______.
A) eating ice cream causes people to tan darker
B) when one's skin tans it causes an urge to eat ice cream
C) the results were spurious
D) perhaps a third variable is responsible for the correlation
E) all of these are possible
A) eating ice cream causes people to tan darker
B) when one's skin tans it causes an urge to eat ice cream
C) the results were spurious
D) perhaps a third variable is responsible for the correlation
E) all of these are possible
فتح الحزمة
افتح القفل للوصول البطاقات البالغ عددها 139 في هذه المجموعة.
فتح الحزمة
k this deck
52
If 49% of the total variability of Y is accounted for by X , what is the value of r ?
A) 0.49
B) 0.51
C) 0.70
D) 0.30
A) 0.49
B) 0.51
C) 0.70
D) 0.30
فتح الحزمة
افتح القفل للوصول البطاقات البالغ عددها 139 في هذه المجموعة.
فتح الحزمة
k this deck
53
Pearson r can be properly used on which of the following type(s) of relationships?
A) linear
B) curvilinear
C) exponential
D) all of these
A) linear
B) curvilinear
C) exponential
D) all of these
فتح الحزمة
افتح القفل للوصول البطاقات البالغ عددها 139 في هذه المجموعة.
فتح الحزمة
k this deck
54
What is the value of r for the following relationship between height and weight?
A) 0.87
B) 0.76
C) 0.93
D) 0.56
A) 0.87
B) 0.76
C) 0.93
D) 0.56
فتح الحزمة
افتح القفل للوصول البطاقات البالغ عددها 139 في هذه المجموعة.
فتح الحزمة
k this deck
55
In a positive relationship as X increases, Y increases.
فتح الحزمة
افتح القفل للوصول البطاقات البالغ عددها 139 في هذه المجموعة.
فتح الحزمة
k this deck
56
You have conducted a brilliant study which correlates IQ score with income and find a value of r = 0.75. At the end of the study you find out all the IQ scores were scored 10 points too high. What will the value of r be with the corrected data?
A) r will be increased
B) r will be decreased
C) r will remain the same
D) cannot be determined
A) r will be increased
B) r will be decreased
C) r will remain the same
D) cannot be determined
فتح الحزمة
افتح القفل للوصول البطاقات البالغ عددها 139 في هذه المجموعة.
فتح الحزمة
k this deck
57
Correlation implies causation.
فتح الحزمة
افتح القفل للوصول البطاقات البالغ عددها 139 في هذه المجموعة.
فتح الحزمة
k this deck
58
If two variables are ratio scaled and the relationship is linear, what type of correlation coefficient is most appropriate?
A) Pearson r
B) Spearman rho
C) eta
D) phi
A) Pearson r
B) Spearman rho
C) eta
D) phi
فتح الحزمة
افتح القفل للوصول البطاقات البالغ عددها 139 في هذه المجموعة.
فتح الحزمة
k this deck
59
In order to properly use rho, the variables must be of at least _______ scaling.
A) nominal
B) ordinal
C) interval
D) ratio
A) nominal
B) ordinal
C) interval
D) ratio
فتح الحزمة
افتح القفل للوصول البطاقات البالغ عددها 139 في هذه المجموعة.
فتح الحزمة
k this deck
60
What is the value of the Spearman rank order correlation coefficient (rho) for the following pairs of ranks?
A) 0.40
B) 0.50
C) 0.60
D) 0.70
A) 0.40
B) 0.50
C) 0.60
D) 0.70
فتح الحزمة
افتح القفل للوصول البطاقات البالغ عددها 139 في هذه المجموعة.
فتح الحزمة
k this deck
61
If the relationship is imperfect, the value of the correlation coefficient must be negative.
فتح الحزمة
افتح القفل للوصول البطاقات البالغ عددها 139 في هذه المجموعة.
فتح الحزمة
k this deck
62
The use of z scores allows comparisons between variables measured on different scales and units.
فتح الحزمة
افتح القفل للوصول البطاقات البالغ عددها 139 في هذه المجموعة.
فتح الحزمة
k this deck
63
Assuming a correlation exists, as the range of one of the variables decreases, r increases.
فتح الحزمة
افتح القفل للوصول البطاقات البالغ عددها 139 في هذه المجموعة.
فتح الحزمة
k this deck
64
In order to compute r , we must first convert each score to its z score and then do our calculations with the z scores.
فتح الحزمة
افتح القفل للوصول البطاقات البالغ عددها 139 في هذه المجموعة.
فتح الحزمة
k this deck
65
The slope of the line reveals whether the relationship is positive or negative.
فتح الحزمة
افتح القفل للوصول البطاقات البالغ عددها 139 في هذه المجموعة.
فتح الحزمة
k this deck
66
A scatter plot is used to help determine if the relationship is linear or curvilinear.
فتح الحزمة
افتح القفل للوصول البطاقات البالغ عددها 139 في هذه المجموعة.
فتح الحزمة
k this deck
67
The range of a correlation coefficient is 0 to +1.
فتح الحزمة
افتح القفل للوصول البطاقات البالغ عددها 139 في هذه المجموعة.
فتح الحزمة
k this deck
68
r decreases as N decreases.
فتح الحزمة
افتح القفل للوصول البطاقات البالغ عددها 139 في هذه المجموعة.
فتح الحزمة
k this deck
69
As the value of r increases, the proportion of variability of Y that is accounted for by X decreases.
فتح الحزمة
افتح القفل للوصول البطاقات البالغ عددها 139 في هذه المجموعة.
فتح الحزمة
k this deck
70
r 2 is called the coefficient of determination.
فتح الحزمة
افتح القفل للوصول البطاقات البالغ عددها 139 في هذه المجموعة.
فتح الحزمة
k this deck
71
Pearson r requires that the data be of interval or ratio scaling.
فتح الحزمة
افتح القفل للوصول البطاقات البالغ عددها 139 في هذه المجموعة.
فتح الحزمة
k this deck
72
The farther away the points on a scatter diagram fall from the regression line, the lower the correlation.
فتح الحزمة
افتح القفل للوصول البطاقات البالغ عددها 139 في هذه المجموعة.
فتح الحزمة
k this deck
73
Given a - 1.00 correlation coefficient, a raw score of 32 on one measure must be accompanied by a score of - 32 on the corresponding second measure.
فتح الحزمة
افتح القفل للوصول البطاقات البالغ عددها 139 في هذه المجموعة.
فتح الحزمة
k this deck
74
Correlation deals with the relationship between two variables.
فتح الحزمة
افتح القفل للوصول البطاقات البالغ عددها 139 في هذه المجموعة.
فتح الحزمة
k this deck
75
Spearman rho really derives from Pearson r .
فتح الحزمة
افتح القفل للوصول البطاقات البالغ عددها 139 في هذه المجموعة.
فتح الحزمة
k this deck
76
Causation implies correlation.
فتح الحزمة
افتح القفل للوصول البطاقات البالغ عددها 139 في هذه المجموعة.
فتح الحزمة
k this deck
77
Correlation implies causation.
فتح الحزمة
افتح القفل للوصول البطاقات البالغ عددها 139 في هذه المجموعة.
فتح الحزمة
k this deck
78
In a perfect positive correlation, each individual obtains the same z score on each variable.
فتح الحزمة
افتح القفل للوصول البطاقات البالغ عددها 139 في هذه المجموعة.
فتح الحزمة
k this deck
79
A correlation coefficient expresses quantitatively the degree of relationship between two variables.
فتح الحزمة
افتح القفل للوصول البطاقات البالغ عددها 139 في هذه المجموعة.
فتح الحزمة
k this deck
80
Rho is used where one or both variables are at least of interval scaling.
فتح الحزمة
افتح القفل للوصول البطاقات البالغ عددها 139 في هذه المجموعة.
فتح الحزمة
k this deck
فتح الحزمة
افتح القفل للوصول البطاقات البالغ عددها 139 في هذه المجموعة.


