Deck 10: Forecasting Techniques
ملء الشاشة (f)
سؤال
Use the data given below to answer the following question(s).
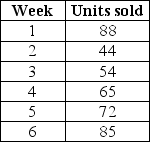
The details of the clock sales at a supermarket for the past 6 weeks are shown in the table below.The time series appears to be relatively stable, without trend, seasonal, or cyclical effects.The simple moving average value of k is set at 2.

If the smoothing constant is assumed to be 0.7, and setting F₁ and F₂ = A₁, the exponential smoothing sales forecast for week 7 is approximately ________.
A)50 clocks
B)80 clocks
C)60 clocks
D)70 clocks
The details of the clock sales at a supermarket for the past 6 weeks are shown in the table below.The time series appears to be relatively stable, without trend, seasonal, or cyclical effects.The simple moving average value of k is set at 2.
If the smoothing constant is assumed to be 0.7, and setting F₁ and F₂ = A₁, the exponential smoothing sales forecast for week 7 is approximately ________.
A)50 clocks
B)80 clocks
C)60 clocks
D)70 clocks
سؤال
سؤال
Use the data given below to answer the following question(s).
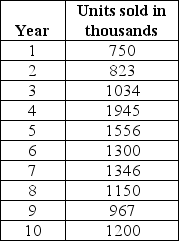
The table provided below gives the sales details of the number of android smart phones at an electronic retail store for the past 6 weeks.The time series appears to be relatively stable, without trend, seasonal, or cyclical effects.The value of k is set at 3.(Hint: Optimize α value.)
Which of the following is the value of the root mean square error for the given data?
A)11.56
B)21.72
C)13.87
D)20.13
سؤال
Use the data given below to answer the following question(s).
The details of the clock sales at a supermarket for the past 6 weeks are shown in the table below.The time series appears to be relatively stable, without trend, seasonal, or cyclical effects.The simple moving average value of k is set at 2.
For the given data, the simple moving average mean absolute deviation is ________.
A)0)21
B)20.12
C)14.25
D)207.13
سؤال
Use the data given below to answer the following question(s).
The details of the clock sales at a supermarket for the past 6 weeks are shown in the table below.The time series appears to be relatively stable, without trend, seasonal, or cyclical effects.The simple moving average value of k is set at 2.
Using the data, determine the value of the simple moving average root mean square error.
A)0)21
B)14.39
C)20.12
D)207.13
سؤال
Use the data given below to answer the following question(s).
The table provided below gives the sales details of the number of android smart phones at an electronic retail store for the past 6 weeks.The time series appears to be relatively stable, without trend, seasonal, or cyclical effects.The value of k is set at 3.(Hint: Optimize α value.)
In the linear trend equation, Ft₊k = at + btk, at is known as the ________.
A)level
B)trend
C)slope
D)forecast
سؤال
سؤال
Use the data given below to answer the following question(s).
The table provided below gives the sales details of the number of android smart phones at an electronic retail store for the past 6 weeks.The time series appears to be relatively stable, without trend, seasonal, or cyclical effects.The value of k is set at 3.(Hint: Optimize α value.)
What is the forecasted value for the 3ʳᵈ week?
A)53 phones
B)64 phones
C)71 phones
D)49 phones
سؤال
Use the data given below to answer the following question(s).
The table provided below gives the sales details of the number of android smart phones at an electronic retail store for the past 6 weeks.The time series appears to be relatively stable, without trend, seasonal, or cyclical effects.The value of k is set at 3.(Hint: Optimize α value.)
What is the difference between the forecasted and the actual value for the 3ʳᵈ week?
A)5 phones
B)6 phones
C)4 phones
D)3 phones
سؤال
سؤال
Use the data given below to answer the following question(s).
The details of the clock sales at a supermarket for the past 6 weeks are shown in the table below.The time series appears to be relatively stable, without trend, seasonal, or cyclical effects.The simple moving average value of k is set at 2.
For the given data, calculate the value of the simple moving average mean absolute percentage error.
A)20.90
B)23.45
C)14.39
D)25.56
سؤال
Use the data given below to answer the following question(s).
The table provided below gives the sales details of the number of android smart phones at an electronic retail store for the past 6 weeks.The time series appears to be relatively stable, without trend, seasonal, or cyclical effects.The value of k is set at 3.(Hint: Optimize α value.)
Calculate the value of the mean absolute percentage error for the given data.
A)20.90
B)16.60
C)21.72
D)31.08
سؤال
Use the data given below to answer the following question(s).
The details of the clock sales at a supermarket for the past 6 weeks are shown in the table below.The time series appears to be relatively stable, without trend, seasonal, or cyclical effects.The simple moving average value of k is set at 2.
For the given data, what is the value of the simple moving average mean square error?
A)0)21
B)20.12
C)14.25
D)207.13
سؤال
If the actual value of a time series at time t and the forecast value for time t is denoted by At and Ft respectively, then the formula for the mean absolute deviation over a range of forecasted values is ________.
A)MAD =
B)MAD =
C)MAD =
D)MAD =
A)MAD =
B)MAD =
C)MAD =
D)MAD =
سؤال
سؤال
سؤال
سؤال
Identify the formula used to calculate the root mean square error over a range of forecasted values, if the actual value of the time series at time t and the forecast value for time t are denoted by At and Ft respectively.
A)RMSE =
B)RMSE =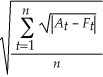
C)RMSE =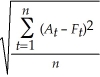
D)RMSE =
A)RMSE =
B)RMSE =
C)RMSE =
D)RMSE =
سؤال
Use the data given below to answer the following question(s).
The table provided below gives the sales details of the number of android smart phones at an electronic retail store for the past 6 weeks.The time series appears to be relatively stable, without trend, seasonal, or cyclical effects.The value of k is set at 3.(Hint: Optimize α value.)
What is the forecasted value for the 7th week?
A)53 phones
B)84 phones
C)71 phones
D)49 phones
سؤال
The actual value of the time series at time t and the forecast value for time t is denoted by At and Ft respectively.What is the formula used for calculating the mean absolute percentage error over a range of forecasted values?
A)MAPE =
B)MAPE =
C)MAPE =
D)MAPE = × 100
× 100
A)MAPE =
B)MAPE =
C)MAPE =
D)MAPE =
× 100 سؤال
Use the data given below to answer the following question(s).
The table provided below gives the sales details of the number of android smart phones at an electronic retail store for the past 6 weeks.The time series appears to be relatively stable, without trend, seasonal, or cyclical effects.The value of k is set at 3.(Hint: Optimize α value.)
In the linear trend equation Ft₊k = at + btk, identify the term that signifies the trend.
A)bt
B)k
C)at
D)Ft ₊ k
سؤال
Use the data given below to answer the following question(s).
The table below provides the sales data for JD Inc.for the year 1998.Given: α = 0.2, β = 0.15, and γ = 0.05 (Hint: Classify the data into quarters for the following question(s).)
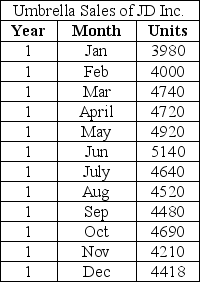
What will be the predicted sales for umbrellas for the month of February of the next quarter?
A)4530.19
B)4645.06
C)4883.76
D)4818.07
The table below provides the sales data for JD Inc.for the year 1998.Given: α = 0.2, β = 0.15, and γ = 0.05 (Hint: Classify the data into quarters for the following question(s).)
What will be the predicted sales for umbrellas for the month of February of the next quarter?
A)4530.19
B)4645.06
C)4883.76
D)4818.07
سؤال
Use the data given below to answer the following question(s).
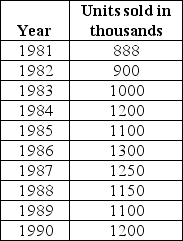
The worldwide sales of cars from 1981-1990 are shown in the table below.Given: α = 0.2 and β = 0.15 (Hint: Use XLMiner)
Identify the value of the mean square error using double exponential smoothing for the given set of data.
A)8)10
B)1)80
C)91.27
D)11976.17
The worldwide sales of cars from 1981-1990 are shown in the table below.Given: α = 0.2 and β = 0.15 (Hint: Use XLMiner)
Identify the value of the mean square error using double exponential smoothing for the given set of data.
A)8)10
B)1)80
C)91.27
D)11976.17
سؤال
Use the data given below to answer the following question(s).
The worldwide sales of cars from 1981-1990 are shown in the table below.Given: α = 0.2 and γ = 0.05.(Hint: Use XLMiner).
If the given time series has a trend and no seasonality, the most appropriate forecasting model to determine the forecast of the time series is the ________ model.
A)single exponential smoothing
B)Holt-Winters no trend smoothing
C)double exponential smoothing
D)Holt-Winters additive
سؤال
Use the data given below to answer the following question(s).
The table below provides the sales data for JD Inc.for the year 1998.Given: α = 0.2, β = 0.15, and γ = 0.05 (Hint: Classify the data into quarters for the following question(s).)
Using an appropriate Holt-Winters trend model, calculate the value of the mean absolute percentage error for the given data.
A)8)10
B)330.01
C)384.83
D)7)21
سؤال
Use the data given below to answer the following question(s).
The worldwide sales of cars from 1981-1990 are shown in the table below.Given: α = 0.2 and γ = 0.05.(Hint: Use XLMiner).
Which of the following is the forecast value for the 6ᵗʰ year?
A)1256.06
B)1328.04
C)1321.31
D)1327.24
The worldwide sales of cars from 1981-1990 are shown in the table below.Given: α = 0.2 and γ = 0.05.(Hint: Use XLMiner).
Which of the following is the forecast value for the 6ᵗʰ year?
A)1256.06
B)1328.04
C)1321.31
D)1327.24
سؤال
Use the data given below to answer the following question(s).
The worldwide sales of cars from 1981-1990 are shown in the table below.Given: α = 0.2 and γ = 0.05.(Hint: Use XLMiner).
Determine the value of the mean absolute deviation using the Holt-Winters no-trend model for the given data.
A)367.35
B)18.39
C)21.70
D)252.55
The worldwide sales of cars from 1981-1990 are shown in the table below.Given: α = 0.2 and γ = 0.05.(Hint: Use XLMiner).
Determine the value of the mean absolute deviation using the Holt-Winters no-trend model for the given data.
A)367.35
B)18.39
C)21.70
D)252.55
سؤال
Use the data given below to answer the following question(s).
The worldwide sales of cars from 1981-1990 are shown in the table below.Given: α = 0.2 and β = 0.15 (Hint: Use XLMiner)
Which of the following equations is the trend line equation for the given data?
A)60.123x + 481.56
B)48.16x + 481.86
C)32.17x + 931.87
D)57.15x + 503.81
The worldwide sales of cars from 1981-1990 are shown in the table below.Given: α = 0.2 and β = 0.15 (Hint: Use XLMiner)
Which of the following equations is the trend line equation for the given data?
A)60.123x + 481.56
B)48.16x + 481.86
C)32.17x + 931.87
D)57.15x + 503.81
سؤال
Use the data given below to answer the following question(s).
The worldwide sales of cars from 1981-1990 are shown in the table below.Given: α = 0.2 and γ = 0.05.(Hint: Use XLMiner).
Which of the following is the value of the root mean square error for the given data?
A)252.55
B)367.35
C)21.70
D)109.76
The worldwide sales of cars from 1981-1990 are shown in the table below.Given: α = 0.2 and γ = 0.05.(Hint: Use XLMiner).
Which of the following is the value of the root mean square error for the given data?
A)252.55
B)367.35
C)21.70
D)109.76
سؤال
Use the data given below to answer the following question(s).
The table below provides the sales data for JD Inc.for the year 1998.Given: α = 0.2, β = 0.15, and γ = 0.05 (Hint: Classify the data into quarters for the following question(s).)
Calculate the value of the mean square error using an appropriate Holt-Winters trend model for the given data.
A)8)10
B)346.26
C)148092.89
D)7)62
سؤال
Use the data given below to answer the following question(s).
The worldwide sales of cars from 1981-1990 are shown in the table below.Given: α = 0.2 and γ = 0.05.(Hint: Use XLMiner).
If the given time series has a trend and seasonality, the most appropriate forecasting model to determine the forecast of the time series is the ________ model.
A)multiple regression
B)Holt-Winters no trend smoothing
C)double exponential smoothing
D)Holt-Winters multiplicative
سؤال
Use the data given below to answer the following question(s).
The worldwide sales of cars from 1981-1990 are shown in the table below.Given: α = 0.2 and β = 0.15 (Hint: Use XLMiner)
Using the double exponential smoothing, find the value of the root mean square error for the given data.
A)8)10
B)91.27
C)11976.17
D)109.44
The worldwide sales of cars from 1981-1990 are shown in the table below.Given: α = 0.2 and β = 0.15 (Hint: Use XLMiner)
Using the double exponential smoothing, find the value of the root mean square error for the given data.
A)8)10
B)91.27
C)11976.17
D)109.44
سؤال
Use the data given below to answer the following question(s).
The table provided below gives the sales details of the number of android smart phones at an electronic retail store for the past 6 weeks.The time series appears to be relatively stable, without trend, seasonal, or cyclical effects.The value of k is set at 3.(Hint: Optimize α value.)
What is the formula used to calculate the value of at in the linear trend equation Ft₊k = at + btk while using double exponential smoothing?
A)at = β(bt - bt₋₁)+ (1 -β)bt₋₁
B)at = αFt₋₁ + (1 - α) (at ₊₁ + bt₊₁)
C)at = αFt + (1 - α) (at ₋₁ + bt₋₁)
D)at = β(bt + bt₋₁)+ (1 + γ)bt₋₁
سؤال
Use the data given below to answer the following question(s).
The worldwide sales of cars from 1981-1990 are shown in the table below.Given: α = 0.2 and β = 0.15 (Hint: Use XLMiner)
Using the double exponential smoothing, calculate the value of the mean absolute deviation for the given data.
A)8)10
B)1)80
C)91.27
D)11976.17
The worldwide sales of cars from 1981-1990 are shown in the table below.Given: α = 0.2 and β = 0.15 (Hint: Use XLMiner)
Using the double exponential smoothing, calculate the value of the mean absolute deviation for the given data.
A)8)10
B)1)80
C)91.27
D)11976.17
سؤال
Use the data given below to answer the following question(s).
The worldwide sales of cars from 1981-1990 are shown in the table below.Given: α = 0.2 and γ = 0.05.(Hint: Use XLMiner).
If the given time series has no trend and no seasonality, the most appropriate forecasting model to determine the forecast of the time series is the ________ model.
A)single moving average
B)Holt-Winters no-trend smoothing
C)double exponential smoothing
D)Holt-Winters additive
سؤال
Use the data given below to answer the following question(s).
The worldwide sales of cars from 1981-1990 are shown in the table below.Given: α = 0.2 and γ = 0.05.(Hint: Use XLMiner).
Calculate the value of the mean absolute percentage error using the Holt-Winters no-trend model for the given data.
A)8)10
B)18.39
C)21.70
D)10.97
The worldwide sales of cars from 1981-1990 are shown in the table below.Given: α = 0.2 and γ = 0.05.(Hint: Use XLMiner).
Calculate the value of the mean absolute percentage error using the Holt-Winters no-trend model for the given data.
A)8)10
B)18.39
C)21.70
D)10.97
سؤال
Use the data given below to answer the following question(s).
The table provided below gives the sales details of the number of android smart phones at an electronic retail store for the past 6 weeks.The time series appears to be relatively stable, without trend, seasonal, or cyclical effects.The value of k is set at 3.(Hint: Optimize α value.)
What is the formula used to calculate the value of bt in the linear trend equation Ft₊k = at + btk while using double exponential smoothing?
A)bt = β(bt - bt₋₁)+ (1 -β)bt₋₁
B)bt = αFt₋₁ + (1 - α) (at ₊₁ + bt₊₁)
C)bt = αFt + (1 - α) (at ₋₁ + bt₋₁)
D)bt = β(at - at₋₁)+ (1 -β)bt₋₁
سؤال
Use the data given below to answer the following question(s).
The table below provides the sales data for JD Inc.for the year 1998.Given: α = 0.2, β = 0.15, and γ = 0.05 (Hint: Classify the data into quarters for the following question(s).)
What is the value of the mean absolute deviation for the given data?
A)8)10
B)346.26
C)14.82
D)7)62
The table below provides the sales data for JD Inc.for the year 1998.Given: α = 0.2, β = 0.15, and γ = 0.05 (Hint: Classify the data into quarters for the following question(s).)
What is the value of the mean absolute deviation for the given data?
A)8)10
B)346.26
C)14.82
D)7)62
سؤال
Use the data given below to answer the following question(s).
The worldwide sales of cars from 1981-1990 are shown in the table below.Given: α = 0.2 and β = 0.15 (Hint: Use XLMiner)
Calculate the value of the mean absolute percentage error using double exponential smoothing for the given data.
A)1)80
B)8)10
C)91.27
D)11976.17
The worldwide sales of cars from 1981-1990 are shown in the table below.Given: α = 0.2 and β = 0.15 (Hint: Use XLMiner)
Calculate the value of the mean absolute percentage error using double exponential smoothing for the given data.
A)1)80
B)8)10
C)91.27
D)11976.17
سؤال
Use the data given below to answer the following question(s).
The worldwide sales of cars from 1981-1990 are shown in the table below.Given: α = 0.2 and β = 0.15 (Hint: Use XLMiner)
For the given data, what is the sales forecast for the year 1992 (in thousands)?
A)1256.87
B)1317.91
C)1285.74
D)1350.08
The worldwide sales of cars from 1981-1990 are shown in the table below.Given: α = 0.2 and β = 0.15 (Hint: Use XLMiner)
For the given data, what is the sales forecast for the year 1992 (in thousands)?
A)1256.87
B)1317.91
C)1285.74
D)1350.08
سؤال
سؤال
سؤال
سؤال
Use the data shown below to answer the following question(s).
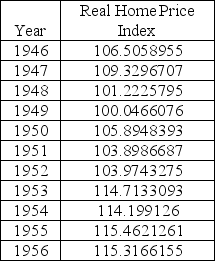
The table below is the data set of the Shiller Real Home Price Index for the years 1946-1956.
Setting k = 3, determine the value of root mean square of errors.
The table below is the data set of the Shiller Real Home Price Index for the years 1946-1956.
Setting k = 3, determine the value of root mean square of errors.
سؤال
سؤال
سؤال
سؤال
سؤال
سؤال
Use the data shown below to answer the following question(s).
The table below is the data set of the Shiller Real Home Price Index for the years 1946-1956.
Setting k = 3, determine the value of mean absolute deviation.
The table below is the data set of the Shiller Real Home Price Index for the years 1946-1956.
Setting k = 3, determine the value of mean absolute deviation.
سؤال
سؤال
Use the data shown below to answer the following question(s).
The table below is the data set of the Shiller Real Home Price Index for the years 1946-1956.
Setting k = 3, determine the value of mean absolute percentage of error.
The table below is the data set of the Shiller Real Home Price Index for the years 1946-1956.
Setting k = 3, determine the value of mean absolute percentage of error.
سؤال
سؤال
Use the data shown below to answer the following question(s).
The table below is the data set of the Shiller Real Home Price Index for the years 1946-1956.
Setting k = 5, calculate the simple moving average forecast for the year 1951.
The table below is the data set of the Shiller Real Home Price Index for the years 1946-1956.
Setting k = 5, calculate the simple moving average forecast for the year 1951.
سؤال
Use the data shown below to answer the following question(s).
The table below is the data set of the Shiller Real Home Price Index for the years 1946-1956.
Setting k = 3, determine the simple moving average forecast for the year 1950.
The table below is the data set of the Shiller Real Home Price Index for the years 1946-1956.
Setting k = 3, determine the simple moving average forecast for the year 1950.

فتح الحزمة
قم بالتسجيل لفتح البطاقات في هذه المجموعة!
Unlock Deck
Unlock Deck
1/55
العب
ملء الشاشة (f)
Deck 10: Forecasting Techniques
1
Use the data given below to answer the following question(s).
The details of the clock sales at a supermarket for the past 6 weeks are shown in the table below.The time series appears to be relatively stable, without trend, seasonal, or cyclical effects.The simple moving average value of k is set at 2.
If the smoothing constant is assumed to be 0.7, and setting F₁ and F₂ = A₁, the exponential smoothing sales forecast for week 7 is approximately ________.
A)50 clocks
B)80 clocks
C)60 clocks
D)70 clocks
B
2
Time-series models may exhibit seasonal effects or cyclical effects.A seasonal effect differs from a cyclical effect in that a seasonal effect:
A)has no trend, is relatively constant, and only exhibits random behavior.
B)describes ups and downs over a time frame such as several years.
C)is one that repeats at fixed intervals of time, typically a year, month, week, or day.
D)is based on analysis of historical time-series data and are predicated on the assumption that the future is an extrapolation of the past.
C
3
Use the data given below to answer the following question(s).
The table provided below gives the sales details of the number of android smart phones at an electronic retail store for the past 6 weeks.The time series appears to be relatively stable, without trend, seasonal, or cyclical effects.The value of k is set at 3.(Hint: Optimize α value.)
Which of the following is the value of the root mean square error for the given data?
A)11.56
B)21.72
C)13.87
D)20.13
B
4
Use the data given below to answer the following question(s).
The details of the clock sales at a supermarket for the past 6 weeks are shown in the table below.The time series appears to be relatively stable, without trend, seasonal, or cyclical effects.The simple moving average value of k is set at 2.
For the given data, the simple moving average mean absolute deviation is ________.
A)0)21
B)20.12
C)14.25
D)207.13
فتح الحزمة
افتح القفل للوصول البطاقات البالغ عددها 55 في هذه المجموعة.
فتح الحزمة
k this deck
5
Use the data given below to answer the following question(s).
The details of the clock sales at a supermarket for the past 6 weeks are shown in the table below.The time series appears to be relatively stable, without trend, seasonal, or cyclical effects.The simple moving average value of k is set at 2.
Using the data, determine the value of the simple moving average root mean square error.
A)0)21
B)14.39
C)20.12
D)207.13
فتح الحزمة
افتح القفل للوصول البطاقات البالغ عددها 55 في هذه المجموعة.
فتح الحزمة
k this deck
6
Use the data given below to answer the following question(s).
The table provided below gives the sales details of the number of android smart phones at an electronic retail store for the past 6 weeks.The time series appears to be relatively stable, without trend, seasonal, or cyclical effects.The value of k is set at 3.(Hint: Optimize α value.)
In the linear trend equation, Ft₊k = at + btk, at is known as the ________.
A)level
B)trend
C)slope
D)forecast
فتح الحزمة
افتح القفل للوصول البطاقات البالغ عددها 55 في هذه المجموعة.
فتح الحزمة
k this deck
7
The data for the number of hand-held gaming devices sold for the past 5 weeks are 15 units, 20 units, 25 units, 30 units, and 17 units respectively.The time series appears to be relatively stable, without trend, seasonal, or cyclical effects; thus, a moving average model would be appropriate.Setting k = 3 the three-period moving average forecast for week 6 is ________.
A)20 units
B)24 units
C)30 units
D)17 units
A)20 units
B)24 units
C)30 units
D)17 units
فتح الحزمة
افتح القفل للوصول البطاقات البالغ عددها 55 في هذه المجموعة.
فتح الحزمة
k this deck
8
Use the data given below to answer the following question(s).
The table provided below gives the sales details of the number of android smart phones at an electronic retail store for the past 6 weeks.The time series appears to be relatively stable, without trend, seasonal, or cyclical effects.The value of k is set at 3.(Hint: Optimize α value.)
What is the forecasted value for the 3ʳᵈ week?
A)53 phones
B)64 phones
C)71 phones
D)49 phones
فتح الحزمة
افتح القفل للوصول البطاقات البالغ عددها 55 في هذه المجموعة.
فتح الحزمة
k this deck
9
Use the data given below to answer the following question(s).
The table provided below gives the sales details of the number of android smart phones at an electronic retail store for the past 6 weeks.The time series appears to be relatively stable, without trend, seasonal, or cyclical effects.The value of k is set at 3.(Hint: Optimize α value.)
What is the difference between the forecasted and the actual value for the 3ʳᵈ week?
A)5 phones
B)6 phones
C)4 phones
D)3 phones
فتح الحزمة
افتح القفل للوصول البطاقات البالغ عددها 55 في هذه المجموعة.
فتح الحزمة
k this deck
10
In forecasting, what is an index?
A)It is a single measure that weights multiple indicators and provides a measure of overall expectation.
B)It is a stream of historical data, such as weekly sales.
C)It is a time series that does not have trend, seasonal, or cyclical effects but is relatively constant and only exhibits random behavior.
D)It is a measure that provides a complete forecast.
فتح الحزمة
افتح القفل للوصول البطاقات البالغ عددها 55 في هذه المجموعة.
فتح الحزمة
k this deck
11
Use the data given below to answer the following question(s).
The details of the clock sales at a supermarket for the past 6 weeks are shown in the table below.The time series appears to be relatively stable, without trend, seasonal, or cyclical effects.The simple moving average value of k is set at 2.
For the given data, calculate the value of the simple moving average mean absolute percentage error.
A)20.90
B)23.45
C)14.39
D)25.56
فتح الحزمة
افتح القفل للوصول البطاقات البالغ عددها 55 في هذه المجموعة.
فتح الحزمة
k this deck
12
Use the data given below to answer the following question(s).
The table provided below gives the sales details of the number of android smart phones at an electronic retail store for the past 6 weeks.The time series appears to be relatively stable, without trend, seasonal, or cyclical effects.The value of k is set at 3.(Hint: Optimize α value.)
Calculate the value of the mean absolute percentage error for the given data.
A)20.90
B)16.60
C)21.72
D)31.08
فتح الحزمة
افتح القفل للوصول البطاقات البالغ عددها 55 في هذه المجموعة.
فتح الحزمة
k this deck
13
Use the data given below to answer the following question(s).
The details of the clock sales at a supermarket for the past 6 weeks are shown in the table below.The time series appears to be relatively stable, without trend, seasonal, or cyclical effects.The simple moving average value of k is set at 2.
For the given data, what is the value of the simple moving average mean square error?
A)0)21
B)20.12
C)14.25
D)207.13
فتح الحزمة
افتح القفل للوصول البطاقات البالغ عددها 55 في هذه المجموعة.
فتح الحزمة
k this deck
14
If the actual value of a time series at time t and the forecast value for time t is denoted by At and Ft respectively, then the formula for the mean absolute deviation over a range of forecasted values is ________.
A)MAD =
B)MAD =
C)MAD =
D)MAD =
A)MAD =
B)MAD =
C)MAD =
D)MAD =
فتح الحزمة
افتح القفل للوصول البطاقات البالغ عددها 55 في هذه المجموعة.
فتح الحزمة
k this deck
15
What is a stream of historical data known as?
A)a time series
B)an index
C)a complex number
D)an orthopole
A)a time series
B)an index
C)a complex number
D)an orthopole
فتح الحزمة
افتح القفل للوصول البطاقات البالغ عددها 55 في هذه المجموعة.
فتح الحزمة
k this deck
16
Before launching a new line of toys, Toys Inc.used the method of historical analogy to obtain a forecast.In this scenario, Toys Inc.:
A)noted the behavior of its current customers while they use their products.
B)used a panel of experts, whose identities were kept confidential from one another, to respond to a sequence of questionnaires.
C)noted the consumer response to similar previous products to marketing campaigns and used the responses as a basis to predict how the new marketing campaign might fare.
D)used a brainstorming session among a group of experts to draw new ideas.
فتح الحزمة
افتح القفل للوصول البطاقات البالغ عددها 55 في هذه المجموعة.
فتح الحزمة
k this deck
17
The Delphi method used for forecasting:
A)obtains forecasts through a comparative analysis with a previous situation.
B)uses measures that are believed to influence the behavior of a variable that the researcher wishes to forecast.
C)uses a single measure that weights multiple indicators and provides a measure of overall expectation.
D)uses a panel of experts, whose identities are typically kept confidential from one another, to respond to a sequence of questionnaires.
فتح الحزمة
افتح القفل للوصول البطاقات البالغ عددها 55 في هذه المجموعة.
فتح الحزمة
k this deck
18
Identify the formula used to calculate the root mean square error over a range of forecasted values, if the actual value of the time series at time t and the forecast value for time t are denoted by At and Ft respectively.
A)RMSE =
B)RMSE =
C)RMSE =
D)RMSE =
A)RMSE =
B)RMSE =
C)RMSE =
D)RMSE =
فتح الحزمة
افتح القفل للوصول البطاقات البالغ عددها 55 في هذه المجموعة.
فتح الحزمة
k this deck
19
Use the data given below to answer the following question(s).
The table provided below gives the sales details of the number of android smart phones at an electronic retail store for the past 6 weeks.The time series appears to be relatively stable, without trend, seasonal, or cyclical effects.The value of k is set at 3.(Hint: Optimize α value.)
What is the forecasted value for the 7th week?
A)53 phones
B)84 phones
C)71 phones
D)49 phones
فتح الحزمة
افتح القفل للوصول البطاقات البالغ عددها 55 في هذه المجموعة.
فتح الحزمة
k this deck
20
The actual value of the time series at time t and the forecast value for time t is denoted by At and Ft respectively.What is the formula used for calculating the mean absolute percentage error over a range of forecasted values?
A)MAPE =
B)MAPE =
C)MAPE =
D)MAPE = × 100
A)MAPE =
B)MAPE =
C)MAPE =
D)MAPE =
× 100 فتح الحزمة
افتح القفل للوصول البطاقات البالغ عددها 55 في هذه المجموعة.
فتح الحزمة
k this deck
21
Use the data given below to answer the following question(s).
The table provided below gives the sales details of the number of android smart phones at an electronic retail store for the past 6 weeks.The time series appears to be relatively stable, without trend, seasonal, or cyclical effects.The value of k is set at 3.(Hint: Optimize α value.)
In the linear trend equation Ft₊k = at + btk, identify the term that signifies the trend.
A)bt
B)k
C)at
D)Ft ₊ k
فتح الحزمة
افتح القفل للوصول البطاقات البالغ عددها 55 في هذه المجموعة.
فتح الحزمة
k this deck
22
Use the data given below to answer the following question(s).
The table below provides the sales data for JD Inc.for the year 1998.Given: α = 0.2, β = 0.15, and γ = 0.05 (Hint: Classify the data into quarters for the following question(s).)
What will be the predicted sales for umbrellas for the month of February of the next quarter?
A)4530.19
B)4645.06
C)4883.76
D)4818.07
فتح الحزمة
افتح القفل للوصول البطاقات البالغ عددها 55 في هذه المجموعة.
فتح الحزمة
k this deck
23
Use the data given below to answer the following question(s).
The worldwide sales of cars from 1981-1990 are shown in the table below.Given: α = 0.2 and β = 0.15 (Hint: Use XLMiner)
Identify the value of the mean square error using double exponential smoothing for the given set of data.
A)8)10
B)1)80
C)91.27
D)11976.17
The worldwide sales of cars from 1981-1990 are shown in the table below.Given: α = 0.2 and β = 0.15 (Hint: Use XLMiner)
Identify the value of the mean square error using double exponential smoothing for the given set of data.
A)8)10
B)1)80
C)91.27
D)11976.17
فتح الحزمة
افتح القفل للوصول البطاقات البالغ عددها 55 في هذه المجموعة.
فتح الحزمة
k this deck
24
Use the data given below to answer the following question(s).
The worldwide sales of cars from 1981-1990 are shown in the table below.Given: α = 0.2 and γ = 0.05.(Hint: Use XLMiner).
If the given time series has a trend and no seasonality, the most appropriate forecasting model to determine the forecast of the time series is the ________ model.
A)single exponential smoothing
B)Holt-Winters no trend smoothing
C)double exponential smoothing
D)Holt-Winters additive
فتح الحزمة
افتح القفل للوصول البطاقات البالغ عددها 55 في هذه المجموعة.
فتح الحزمة
k this deck
25
Use the data given below to answer the following question(s).
The table below provides the sales data for JD Inc.for the year 1998.Given: α = 0.2, β = 0.15, and γ = 0.05 (Hint: Classify the data into quarters for the following question(s).)
Using an appropriate Holt-Winters trend model, calculate the value of the mean absolute percentage error for the given data.
A)8)10
B)330.01
C)384.83
D)7)21
فتح الحزمة
افتح القفل للوصول البطاقات البالغ عددها 55 في هذه المجموعة.
فتح الحزمة
k this deck
26
Use the data given below to answer the following question(s).
The worldwide sales of cars from 1981-1990 are shown in the table below.Given: α = 0.2 and γ = 0.05.(Hint: Use XLMiner).
Which of the following is the forecast value for the 6ᵗʰ year?
A)1256.06
B)1328.04
C)1321.31
D)1327.24
The worldwide sales of cars from 1981-1990 are shown in the table below.Given: α = 0.2 and γ = 0.05.(Hint: Use XLMiner).
Which of the following is the forecast value for the 6ᵗʰ year?
A)1256.06
B)1328.04
C)1321.31
D)1327.24
فتح الحزمة
افتح القفل للوصول البطاقات البالغ عددها 55 في هذه المجموعة.
فتح الحزمة
k this deck
27
Use the data given below to answer the following question(s).
The worldwide sales of cars from 1981-1990 are shown in the table below.Given: α = 0.2 and γ = 0.05.(Hint: Use XLMiner).
Determine the value of the mean absolute deviation using the Holt-Winters no-trend model for the given data.
A)367.35
B)18.39
C)21.70
D)252.55
The worldwide sales of cars from 1981-1990 are shown in the table below.Given: α = 0.2 and γ = 0.05.(Hint: Use XLMiner).
Determine the value of the mean absolute deviation using the Holt-Winters no-trend model for the given data.
A)367.35
B)18.39
C)21.70
D)252.55
فتح الحزمة
افتح القفل للوصول البطاقات البالغ عددها 55 في هذه المجموعة.
فتح الحزمة
k this deck
28
Use the data given below to answer the following question(s).
The worldwide sales of cars from 1981-1990 are shown in the table below.Given: α = 0.2 and β = 0.15 (Hint: Use XLMiner)
Which of the following equations is the trend line equation for the given data?
A)60.123x + 481.56
B)48.16x + 481.86
C)32.17x + 931.87
D)57.15x + 503.81
The worldwide sales of cars from 1981-1990 are shown in the table below.Given: α = 0.2 and β = 0.15 (Hint: Use XLMiner)
Which of the following equations is the trend line equation for the given data?
A)60.123x + 481.56
B)48.16x + 481.86
C)32.17x + 931.87
D)57.15x + 503.81
فتح الحزمة
افتح القفل للوصول البطاقات البالغ عددها 55 في هذه المجموعة.
فتح الحزمة
k this deck
29
Use the data given below to answer the following question(s).
The worldwide sales of cars from 1981-1990 are shown in the table below.Given: α = 0.2 and γ = 0.05.(Hint: Use XLMiner).
Which of the following is the value of the root mean square error for the given data?
A)252.55
B)367.35
C)21.70
D)109.76
The worldwide sales of cars from 1981-1990 are shown in the table below.Given: α = 0.2 and γ = 0.05.(Hint: Use XLMiner).
Which of the following is the value of the root mean square error for the given data?
A)252.55
B)367.35
C)21.70
D)109.76
فتح الحزمة
افتح القفل للوصول البطاقات البالغ عددها 55 في هذه المجموعة.
فتح الحزمة
k this deck
30
Use the data given below to answer the following question(s).
The table below provides the sales data for JD Inc.for the year 1998.Given: α = 0.2, β = 0.15, and γ = 0.05 (Hint: Classify the data into quarters for the following question(s).)
Calculate the value of the mean square error using an appropriate Holt-Winters trend model for the given data.
A)8)10
B)346.26
C)148092.89
D)7)62
فتح الحزمة
افتح القفل للوصول البطاقات البالغ عددها 55 في هذه المجموعة.
فتح الحزمة
k this deck
31
Use the data given below to answer the following question(s).
The worldwide sales of cars from 1981-1990 are shown in the table below.Given: α = 0.2 and γ = 0.05.(Hint: Use XLMiner).
If the given time series has a trend and seasonality, the most appropriate forecasting model to determine the forecast of the time series is the ________ model.
A)multiple regression
B)Holt-Winters no trend smoothing
C)double exponential smoothing
D)Holt-Winters multiplicative
فتح الحزمة
افتح القفل للوصول البطاقات البالغ عددها 55 في هذه المجموعة.
فتح الحزمة
k this deck
32
Use the data given below to answer the following question(s).
The worldwide sales of cars from 1981-1990 are shown in the table below.Given: α = 0.2 and β = 0.15 (Hint: Use XLMiner)
Using the double exponential smoothing, find the value of the root mean square error for the given data.
A)8)10
B)91.27
C)11976.17
D)109.44
The worldwide sales of cars from 1981-1990 are shown in the table below.Given: α = 0.2 and β = 0.15 (Hint: Use XLMiner)
Using the double exponential smoothing, find the value of the root mean square error for the given data.
A)8)10
B)91.27
C)11976.17
D)109.44
فتح الحزمة
افتح القفل للوصول البطاقات البالغ عددها 55 في هذه المجموعة.
فتح الحزمة
k this deck
33
Use the data given below to answer the following question(s).
The table provided below gives the sales details of the number of android smart phones at an electronic retail store for the past 6 weeks.The time series appears to be relatively stable, without trend, seasonal, or cyclical effects.The value of k is set at 3.(Hint: Optimize α value.)
What is the formula used to calculate the value of at in the linear trend equation Ft₊k = at + btk while using double exponential smoothing?
A)at = β(bt - bt₋₁)+ (1 -β)bt₋₁
B)at = αFt₋₁ + (1 - α) (at ₊₁ + bt₊₁)
C)at = αFt + (1 - α) (at ₋₁ + bt₋₁)
D)at = β(bt + bt₋₁)+ (1 + γ)bt₋₁
فتح الحزمة
افتح القفل للوصول البطاقات البالغ عددها 55 في هذه المجموعة.
فتح الحزمة
k this deck
34
Use the data given below to answer the following question(s).
The worldwide sales of cars from 1981-1990 are shown in the table below.Given: α = 0.2 and β = 0.15 (Hint: Use XLMiner)
Using the double exponential smoothing, calculate the value of the mean absolute deviation for the given data.
A)8)10
B)1)80
C)91.27
D)11976.17
The worldwide sales of cars from 1981-1990 are shown in the table below.Given: α = 0.2 and β = 0.15 (Hint: Use XLMiner)
Using the double exponential smoothing, calculate the value of the mean absolute deviation for the given data.
A)8)10
B)1)80
C)91.27
D)11976.17
فتح الحزمة
افتح القفل للوصول البطاقات البالغ عددها 55 في هذه المجموعة.
فتح الحزمة
k this deck
35
Use the data given below to answer the following question(s).
The worldwide sales of cars from 1981-1990 are shown in the table below.Given: α = 0.2 and γ = 0.05.(Hint: Use XLMiner).
If the given time series has no trend and no seasonality, the most appropriate forecasting model to determine the forecast of the time series is the ________ model.
A)single moving average
B)Holt-Winters no-trend smoothing
C)double exponential smoothing
D)Holt-Winters additive
فتح الحزمة
افتح القفل للوصول البطاقات البالغ عددها 55 في هذه المجموعة.
فتح الحزمة
k this deck
36
Use the data given below to answer the following question(s).
The worldwide sales of cars from 1981-1990 are shown in the table below.Given: α = 0.2 and γ = 0.05.(Hint: Use XLMiner).
Calculate the value of the mean absolute percentage error using the Holt-Winters no-trend model for the given data.
A)8)10
B)18.39
C)21.70
D)10.97
The worldwide sales of cars from 1981-1990 are shown in the table below.Given: α = 0.2 and γ = 0.05.(Hint: Use XLMiner).
Calculate the value of the mean absolute percentage error using the Holt-Winters no-trend model for the given data.
A)8)10
B)18.39
C)21.70
D)10.97
فتح الحزمة
افتح القفل للوصول البطاقات البالغ عددها 55 في هذه المجموعة.
فتح الحزمة
k this deck
37
Use the data given below to answer the following question(s).
The table provided below gives the sales details of the number of android smart phones at an electronic retail store for the past 6 weeks.The time series appears to be relatively stable, without trend, seasonal, or cyclical effects.The value of k is set at 3.(Hint: Optimize α value.)
What is the formula used to calculate the value of bt in the linear trend equation Ft₊k = at + btk while using double exponential smoothing?
A)bt = β(bt - bt₋₁)+ (1 -β)bt₋₁
B)bt = αFt₋₁ + (1 - α) (at ₊₁ + bt₊₁)
C)bt = αFt + (1 - α) (at ₋₁ + bt₋₁)
D)bt = β(at - at₋₁)+ (1 -β)bt₋₁
فتح الحزمة
افتح القفل للوصول البطاقات البالغ عددها 55 في هذه المجموعة.
فتح الحزمة
k this deck
38
Use the data given below to answer the following question(s).
The table below provides the sales data for JD Inc.for the year 1998.Given: α = 0.2, β = 0.15, and γ = 0.05 (Hint: Classify the data into quarters for the following question(s).)
What is the value of the mean absolute deviation for the given data?
A)8)10
B)346.26
C)14.82
D)7)62
The table below provides the sales data for JD Inc.for the year 1998.Given: α = 0.2, β = 0.15, and γ = 0.05 (Hint: Classify the data into quarters for the following question(s).)
What is the value of the mean absolute deviation for the given data?
A)8)10
B)346.26
C)14.82
D)7)62
فتح الحزمة
افتح القفل للوصول البطاقات البالغ عددها 55 في هذه المجموعة.
فتح الحزمة
k this deck
39
Use the data given below to answer the following question(s).
The worldwide sales of cars from 1981-1990 are shown in the table below.Given: α = 0.2 and β = 0.15 (Hint: Use XLMiner)
Calculate the value of the mean absolute percentage error using double exponential smoothing for the given data.
A)1)80
B)8)10
C)91.27
D)11976.17
The worldwide sales of cars from 1981-1990 are shown in the table below.Given: α = 0.2 and β = 0.15 (Hint: Use XLMiner)
Calculate the value of the mean absolute percentage error using double exponential smoothing for the given data.
A)1)80
B)8)10
C)91.27
D)11976.17
فتح الحزمة
افتح القفل للوصول البطاقات البالغ عددها 55 في هذه المجموعة.
فتح الحزمة
k this deck
40
Use the data given below to answer the following question(s).
The worldwide sales of cars from 1981-1990 are shown in the table below.Given: α = 0.2 and β = 0.15 (Hint: Use XLMiner)
For the given data, what is the sales forecast for the year 1992 (in thousands)?
A)1256.87
B)1317.91
C)1285.74
D)1350.08
The worldwide sales of cars from 1981-1990 are shown in the table below.Given: α = 0.2 and β = 0.15 (Hint: Use XLMiner)
For the given data, what is the sales forecast for the year 1992 (in thousands)?
A)1256.87
B)1317.91
C)1285.74
D)1350.08
فتح الحزمة
افتح القفل للوصول البطاقات البالغ عددها 55 في هذه المجموعة.
فتح الحزمة
k this deck
41
What is simple exponential smoothing?
فتح الحزمة
افتح القفل للوصول البطاقات البالغ عددها 55 في هذه المجموعة.
فتح الحزمة
k this deck
42
Explain econometric models used in forecasting with examples.
فتح الحزمة
افتح القفل للوصول البطاقات البالغ عددها 55 في هذه المجموعة.
فتح الحزمة
k this deck
43
The Holt-Winters additive model applies to time series whose amplitude increases or decreases over time.
فتح الحزمة
افتح القفل للوصول البطاقات البالغ عددها 55 في هذه المجموعة.
فتح الحزمة
k this deck
44
Use the data shown below to answer the following question(s).
The table below is the data set of the Shiller Real Home Price Index for the years 1946-1956.
Setting k = 3, determine the value of root mean square of errors.
The table below is the data set of the Shiller Real Home Price Index for the years 1946-1956.
Setting k = 3, determine the value of root mean square of errors.
فتح الحزمة
افتح القفل للوصول البطاقات البالغ عددها 55 في هذه المجموعة.
فتح الحزمة
k this deck
45
Explain the significance of using double moving average and double exponential smoothing models.
فتح الحزمة
افتح القفل للوصول البطاقات البالغ عددها 55 في هذه المجموعة.
فتح الحزمة
k this deck
46
Indicators are measures that are believed to influence the behavior of a variable an individual wishes to forecast.
فتح الحزمة
افتح القفل للوصول البطاقات البالغ عددها 55 في هذه المجموعة.
فتح الحزمة
k this deck
47
The indexes in the forecasting indicators provide a complete forecast.
فتح الحزمة
افتح القفل للوصول البطاقات البالغ عددها 55 في هذه المجموعة.
فتح الحزمة
k this deck
48
A cyclical effect is one that repeats at fixed intervals of time, typically a year, month, week, or day.
فتح الحزمة
افتح القفل للوصول البطاقات البالغ عددها 55 في هذه المجموعة.
فتح الحزمة
k this deck
49
Explain the different types of Holt-Winters models used in forecasting.
فتح الحزمة
افتح القفل للوصول البطاقات البالغ عددها 55 في هذه المجموعة.
فتح الحزمة
k this deck
50
Use the data shown below to answer the following question(s).
The table below is the data set of the Shiller Real Home Price Index for the years 1946-1956.
Setting k = 3, determine the value of mean absolute deviation.
The table below is the data set of the Shiller Real Home Price Index for the years 1946-1956.
Setting k = 3, determine the value of mean absolute deviation.
فتح الحزمة
افتح القفل للوصول البطاقات البالغ عددها 55 في هذه المجموعة.
فتح الحزمة
k this deck
51
If a time series has seasonality but no trend, the most appropriate model used for forecasting is the Holt-Winters multiplicative model.
فتح الحزمة
افتح القفل للوصول البطاقات البالغ عددها 55 في هذه المجموعة.
فتح الحزمة
k this deck
52
Use the data shown below to answer the following question(s).
The table below is the data set of the Shiller Real Home Price Index for the years 1946-1956.
Setting k = 3, determine the value of mean absolute percentage of error.
The table below is the data set of the Shiller Real Home Price Index for the years 1946-1956.
Setting k = 3, determine the value of mean absolute percentage of error.
فتح الحزمة
افتح القفل للوصول البطاقات البالغ عددها 55 في هذه المجموعة.
فتح الحزمة
k this deck
53
Write a short note on indicators and indexes used in forecasting.
فتح الحزمة
افتح القفل للوصول البطاقات البالغ عددها 55 في هذه المجموعة.
فتح الحزمة
k this deck
54
Use the data shown below to answer the following question(s).
The table below is the data set of the Shiller Real Home Price Index for the years 1946-1956.
Setting k = 5, calculate the simple moving average forecast for the year 1951.
The table below is the data set of the Shiller Real Home Price Index for the years 1946-1956.
Setting k = 5, calculate the simple moving average forecast for the year 1951.
فتح الحزمة
افتح القفل للوصول البطاقات البالغ عددها 55 في هذه المجموعة.
فتح الحزمة
k this deck
55
Use the data shown below to answer the following question(s).
The table below is the data set of the Shiller Real Home Price Index for the years 1946-1956.
Setting k = 3, determine the simple moving average forecast for the year 1950.
The table below is the data set of the Shiller Real Home Price Index for the years 1946-1956.
Setting k = 3, determine the simple moving average forecast for the year 1950.
فتح الحزمة
افتح القفل للوصول البطاقات البالغ عددها 55 في هذه المجموعة.
فتح الحزمة
k this deck
فتح الحزمة
افتح القفل للوصول البطاقات البالغ عددها 55 في هذه المجموعة.


