Deck 9: Regression Analysis
ملء الشاشة (f)
سؤال
Use the data given below to answer the following question(s).
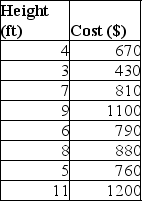
Following is an extract from the database of a construction company.The table shows the height of walls in feet and the cost of raising them.The estimated simple linear regression equation is given as Ŷ = b0 + b1X.(Hint: Use Excel functions).
The R² value:
A)is the variability of the observed Y-values from the predicted values.
B)indicates that as the independent variable increases, the intercept term does too.
C)gives the proportion of variation in the dependent variable that is explained by the independent variable.
D)transforms the cumulative probability scale (vertical axis)so that the graph of the cumulative normal distribution is a straight line.
سؤال
سؤال
Use the data given below to answer the following question(s).
Following is an extract from the database of a construction company.The table shows the height of walls in feet and the cost of raising them.The estimated simple linear regression equation is given as Ŷ = b0 + b1X.(Hint: Use Excel functions).
Which of the following Excel functions is applied to test for significance of regression?
A)COVAR
B)ANOVA
C)SINH
D)TREND
سؤال
سؤال
Use the data given below to answer the following question(s).
Following is an extract from the database of a construction company.The table shows the height of walls in feet and the cost of raising them.The estimated simple linear regression equation is given as Ŷ = b0 + b1X.(Hint: Use Excel functions).
What is the value of the coefficient b₁?
A)86.81704
B)254.8371
C)0)010697
D)-2.14625
سؤال
سؤال
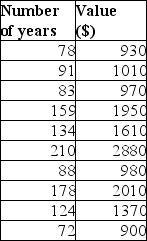
The following table exhibits the age of antique furniture and the corresponding prices.Use the table to answer the following question(s).(Hint: Use scatter diagram and the Excel Trendline tool where necessary).
Which of the following equations correctly expresses the relationship between the two variables?
A)Value = (-181.16)+ 13.493 × Number of years
B)Number of years = Value / 12.537
C)Value = (459.34 / Number of years)× 4.536
D)Number of years = (17.538 × Value)/ (-157.49)
Which of the following equations correctly expresses the relationship between the two variables?
A)Value = (-181.16)+ 13.493 × Number of years
B)Number of years = Value / 12.537
C)Value = (459.34 / Number of years)× 4.536
D)Number of years = (17.538 × Value)/ (-157.49)
سؤال
The following table exhibits the age of antique furniture and the corresponding prices.Use the table to answer the following question(s).(Hint: Use scatter diagram and the Excel Trendline tool where necessary).
In a linear relationship, which of the following accounts for the many possible values of the dependent variable that vary around the mean?
A)the coefficient of the dependent variable X
B)the value of the intercept ß₀
C)the random error term ε
D)the standard error SYX
In a linear relationship, which of the following accounts for the many possible values of the dependent variable that vary around the mean?
A)the coefficient of the dependent variable X
B)the value of the intercept ß₀
C)the random error term ε
D)the standard error SYX
سؤال
Use the data given below to answer the following question(s).
Following is an extract from the database of a construction company.The table shows the height of walls in feet and the cost of raising them.The estimated simple linear regression equation is given as Ŷ = b0 + b1X.(Hint: Use Excel functions).
For a simple linear regression model, significance of regression is:
A)a measure of how well the regression line fits the data.
B)a hypothesis test of whether the regression coefficient ß1 is zero.
C)a statistic that modifies the value of R² by incorporating the sample size and the number of explanatory variables in the model.
D)the variability of the observed Y-values from the predicted values.
سؤال
The following table exhibits the age of antique furniture and the corresponding prices.Use the table to answer the following question(s).(Hint: Use scatter diagram and the Excel Trendline tool where necessary).
Which of the following is true about the observed errors associated with estimating the value of the dependent variable using the regression line?
A)They are the horizontal distances between slopes and y-intercepts.
B)The errors are also referred to as critical values.
C)They are always maximized by the regression lines.
D)The errors can be negative or positive.
سؤال
The following table exhibits the age of antique furniture and the corresponding prices.Use the table to answer the following question(s).(Hint: Use scatter diagram and the Excel Trendline tool where necessary).
What is the expected value for a 90 year-old piece of furniture?
A)$1002.45
B)$997.98
C)$934.56
D)$1033.21
What is the expected value for a 90 year-old piece of furniture?
A)$1002.45
B)$997.98
C)$934.56
D)$1033.21
سؤال
Use the data given below to answer the following question(s).
Following is an extract from the database of a construction company.The table shows the height of walls in feet and the cost of raising them.The estimated simple linear regression equation is given as Ŷ = b0 + b1X.(Hint: Use Excel functions).
What is the value of the coefficient b₀?
A)-2.25321
B)0)010697
C)254.8371
D)86.81704
سؤال
Use the data given below to answer the following question(s).
Following is an extract from the database of a construction company.The table shows the height of walls in feet and the cost of raising them.The estimated simple linear regression equation is given as Ŷ = b0 + b1X.(Hint: Use Excel functions).
What is the estimated cost of raising a 10-inch wall?
A)1505.786
B)1103.578
C)968.6109
D)1123.008
سؤال
The following table exhibits the age of antique furniture and the corresponding prices.Use the table to answer the following question(s).(Hint: Use scatter diagram and the Excel Trendline tool where necessary).
What is the relationship between the age of the furniture and their values?
A)Nonlinear
B)Linear
C)Curvilinear
D)No relationship
What is the relationship between the age of the furniture and their values?
A)Nonlinear
B)Linear
C)Curvilinear
D)No relationship
سؤال
سؤال
Use the data given below to answer the following question(s).
Following is an extract from the database of a construction company.The table shows the height of walls in feet and the cost of raising them.The estimated simple linear regression equation is given as Ŷ = b0 + b1X.(Hint: Use Excel functions).
Which of the following is true about Excel outputs Multiple R?
A)It is often referred to as the coefficient of determination.
B)A value of 0 indicates positive correlation.
C)A negative slope of the regression line denotes a positive Multiple R.
D)It is another name for the sample correlation coefficient, r.
سؤال
Use the data given below to answer the following question(s).
Following is an extract from the database of a construction company.The table shows the height of walls in feet and the cost of raising them.The estimated simple linear regression equation is given as Ŷ = b0 + b1X.(Hint: Use Excel functions).
While testing hypotheses for regression coefficients, the t-test for the slope is expressed as:
A)t =
B)t =
C)t =
D)t =
سؤال
The following table exhibits the age of antique furniture and the corresponding prices.Use the table to answer the following question(s).(Hint: Use scatter diagram and the Excel Trendline tool where necessary).
For an independent variable Y, the error associated with the iᵗʰ observation is:
A)eᵢ = Yᵢ - Ŷᵢ
B)Yᵢ = (eᵢ)² - Ŷᵢ
C) (Ŷᵢ)² ᵉᵢ = Yᵢ
D)eᵢ = (Yᵢ + Ŷᵢ)²
For an independent variable Y, the error associated with the iᵗʰ observation is:
A)eᵢ = Yᵢ - Ŷᵢ
B)Yᵢ = (eᵢ)² - Ŷᵢ
C) (Ŷᵢ)² ᵉᵢ = Yᵢ
D)eᵢ = (Yᵢ + Ŷᵢ)²
سؤال
Use the data given below to answer the following question(s).
Following is an extract from the database of a construction company.The table shows the height of walls in feet and the cost of raising them.The estimated simple linear regression equation is given as Ŷ = b0 + b1X.(Hint: Use Excel functions).
Which of the following statements is true when using the Excel Regression tool?
A)The range for the independent variable values must be specified in the box for the Input Y Range.
B)Checking the option Constant is Zero forces the intercept to zero.
C)The Regression tool can be found in the Tools tab under Insert group.
D)Adding an intercept term reduces the analysis' fit to the data.
سؤال
Use the data given below to answer the following question(s).
Following is an extract from the database of a construction company.The table shows the height of walls in feet and the cost of raising them.The estimated simple linear regression equation is given as Ŷ = b0 + b1X.(Hint: Use Excel functions).
Which of the following generates a scatter chart in Excel with the values predicted by the regression model included?
A)Trendline
B)Residual Plots
C)R Square
D)Line Fit Plots
سؤال
سؤال
سؤال
سؤال
سؤال
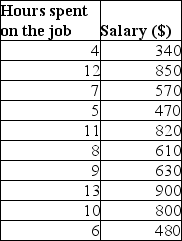
Use the data given below to answer the following question(s).
Following is an extract from a firm's database detailing the number of hours spent on the job by employees and their corresponding pay.(Note: Assume a level of significance of 0.05 wherever necessary.)
Draw conclusions for test of hypothesis for regression coefficients.
Following is an extract from a firm's database detailing the number of hours spent on the job by employees and their corresponding pay.(Note: Assume a level of significance of 0.05 wherever necessary.)
Draw conclusions for test of hypothesis for regression coefficients.
سؤال
Use the data given below to answer the following question(s).
Following is an extract from a firm's database detailing the number of hours spent on the job by employees and their corresponding pay.(Note: Assume a level of significance of 0.05 wherever necessary.)
Is the hours spent on the job a statistically significant variable in explaining the variation in pay of employees? (Hint: Use Regression tool).
سؤال
Use the data given below to answer the following question(s).
Following is an extract from a firm's database detailing the number of hours spent on the job by employees and their corresponding pay.(Note: Assume a level of significance of 0.05 wherever necessary.)
Interpret residual output.
Following is an extract from a firm's database detailing the number of hours spent on the job by employees and their corresponding pay.(Note: Assume a level of significance of 0.05 wherever necessary.)
Interpret residual output.
سؤال
سؤال
سؤال
سؤال
سؤال
Use the data given below to answer the following question(s).
Following is an extract from a firm's database detailing the number of hours spent on the job by employees and their corresponding pay.(Note: Assume a level of significance of 0.05 wherever necessary.)
Interpret the confidence intervals.
Following is an extract from a firm's database detailing the number of hours spent on the job by employees and their corresponding pay.(Note: Assume a level of significance of 0.05 wherever necessary.)
Interpret the confidence intervals.
سؤال
سؤال
سؤال
سؤال
سؤال
سؤال
Use the data given below to answer the following question(s).
Following is an extract from a firm's database detailing the number of hours spent on the job by employees and their corresponding pay.(Note: Assume a level of significance of 0.05 wherever necessary.)
Construct a scatter diagram and use the Excel Trendline tool to find the best-fitting simple linear regression model.
سؤال
سؤال
سؤال
Use the data given below to answer the following question(s).
Following is an extract from a firm's database detailing the number of hours spent on the job by employees and their corresponding pay.(Note: Assume a level of significance of 0.05 wherever necessary.)
The best-fitting line maximizes the residuals.
Following is an extract from a firm's database detailing the number of hours spent on the job by employees and their corresponding pay.(Note: Assume a level of significance of 0.05 wherever necessary.)
The best-fitting line maximizes the residuals.
سؤال
Use the data given below to answer the following question(s).
Following is an extract from a firm's database detailing the number of hours spent on the job by employees and their corresponding pay.(Note: Assume a level of significance of 0.05 wherever necessary.)
A good regression model has the fewest number of explanatory variables providing an adequate interpretation of the dependent variable.
سؤال
Use the data given below to answer the following question(s).
Following is an extract from a firm's database detailing the number of hours spent on the job by employees and their corresponding pay.(Note: Assume a level of significance of 0.05 wherever necessary.)
Briefly explain the assumptions on which the statistical hypothesis tests associated with regression analysis are predicated.
سؤال
Use the data given below to answer the following question(s).
Following is an extract from a firm's database detailing the number of hours spent on the job by employees and their corresponding pay.(Note: Assume a level of significance of 0.05 wherever necessary.)
The standard error may be assumed to be large if the data are clustered close to the regression line.
سؤال
Use the data given below to answer the following question(s).
Following is an extract from a firm's database detailing the number of hours spent on the job by employees and their corresponding pay.(Note: Assume a level of significance of 0.05 wherever necessary.)
Creating a scatter chart with an added trendline is visually superior to the scatter chart generated by line fit plots.
سؤال
Use the data given below to answer the following question(s).
Following is an extract from a firm's database detailing the number of hours spent on the job by employees and their corresponding pay.(Note: Assume a level of significance of 0.05 wherever necessary.)
Why is regression analysis necessary in business? What categories of regression models are used?
Following is an extract from a firm's database detailing the number of hours spent on the job by employees and their corresponding pay.(Note: Assume a level of significance of 0.05 wherever necessary.)
Why is regression analysis necessary in business? What categories of regression models are used?
سؤال
Use the data given below to answer the following question(s).
Following is an extract from a firm's database detailing the number of hours spent on the job by employees and their corresponding pay.(Note: Assume a level of significance of 0.05 wherever necessary.)
List the systematic approach to building good multiple regression models.
Following is an extract from a firm's database detailing the number of hours spent on the job by employees and their corresponding pay.(Note: Assume a level of significance of 0.05 wherever necessary.)
List the systematic approach to building good multiple regression models.
سؤال
Use the data given below to answer the following question(s).
Following is an extract from a firm's database detailing the number of hours spent on the job by employees and their corresponding pay.(Note: Assume a level of significance of 0.05 wherever necessary.)
Explain the concept of curvilinear regression model.
Following is an extract from a firm's database detailing the number of hours spent on the job by employees and their corresponding pay.(Note: Assume a level of significance of 0.05 wherever necessary.)
Explain the concept of curvilinear regression model.
سؤال
Use the data given below to answer the following question(s).
Following is an extract from a firm's database detailing the number of hours spent on the job by employees and their corresponding pay.(Note: Assume a level of significance of 0.05 wherever necessary.)
An increase in adjusted R² indicates that the regression model has improved.
Following is an extract from a firm's database detailing the number of hours spent on the job by employees and their corresponding pay.(Note: Assume a level of significance of 0.05 wherever necessary.)
An increase in adjusted R² indicates that the regression model has improved.
سؤال
Use the data given below to answer the following question(s).
Following is an extract from a firm's database detailing the number of hours spent on the job by employees and their corresponding pay.(Note: Assume a level of significance of 0.05 wherever necessary.)
While conducting regression analysis, how is constructing a normal probability plot useful?
Following is an extract from a firm's database detailing the number of hours spent on the job by employees and their corresponding pay.(Note: Assume a level of significance of 0.05 wherever necessary.)
While conducting regression analysis, how is constructing a normal probability plot useful?

فتح الحزمة
قم بالتسجيل لفتح البطاقات في هذه المجموعة!
Unlock Deck
Unlock Deck
1/50
العب
ملء الشاشة (f)
Deck 9: Regression Analysis
1
Use the data given below to answer the following question(s).
Following is an extract from the database of a construction company.The table shows the height of walls in feet and the cost of raising them.The estimated simple linear regression equation is given as Ŷ = b0 + b1X.(Hint: Use Excel functions).
The R² value:
A)is the variability of the observed Y-values from the predicted values.
B)indicates that as the independent variable increases, the intercept term does too.
C)gives the proportion of variation in the dependent variable that is explained by the independent variable.
D)transforms the cumulative probability scale (vertical axis)so that the graph of the cumulative normal distribution is a straight line.
C
2
Regression models of ________ data focus on predicting the future.
A)missing
B)time-series
C)panel
D)cross-sectional
A)missing
B)time-series
C)panel
D)cross-sectional
B
3
Use the data given below to answer the following question(s).
Following is an extract from the database of a construction company.The table shows the height of walls in feet and the cost of raising them.The estimated simple linear regression equation is given as Ŷ = b0 + b1X.(Hint: Use Excel functions).
Which of the following Excel functions is applied to test for significance of regression?
A)COVAR
B)ANOVA
C)SINH
D)TREND
B
4
A regression model that involves a single independent variable is called ________.
A)single regression
B)unit regression
C)simple regression
D)individual regression
A)single regression
B)unit regression
C)simple regression
D)individual regression
فتح الحزمة
افتح القفل للوصول البطاقات البالغ عددها 50 في هذه المجموعة.
فتح الحزمة
k this deck
5
Use the data given below to answer the following question(s).
Following is an extract from the database of a construction company.The table shows the height of walls in feet and the cost of raising them.The estimated simple linear regression equation is given as Ŷ = b0 + b1X.(Hint: Use Excel functions).
What is the value of the coefficient b₁?
A)86.81704
B)254.8371
C)0)010697
D)-2.14625
فتح الحزمة
افتح القفل للوصول البطاقات البالغ عددها 50 في هذه المجموعة.
فتح الحزمة
k this deck
6
________ provide information about the unknown values of the true regression coefficients, accounting for sampling error.
A)Standard errors
B)Confidence intervals
C)Adjusted R Squares
D)P-values
A)Standard errors
B)Confidence intervals
C)Adjusted R Squares
D)P-values
فتح الحزمة
افتح القفل للوصول البطاقات البالغ عددها 50 في هذه المجموعة.
فتح الحزمة
k this deck
7
The following table exhibits the age of antique furniture and the corresponding prices.Use the table to answer the following question(s).(Hint: Use scatter diagram and the Excel Trendline tool where necessary).
Which of the following equations correctly expresses the relationship between the two variables?
A)Value = (-181.16)+ 13.493 × Number of years
B)Number of years = Value / 12.537
C)Value = (459.34 / Number of years)× 4.536
D)Number of years = (17.538 × Value)/ (-157.49)
Which of the following equations correctly expresses the relationship between the two variables?
A)Value = (-181.16)+ 13.493 × Number of years
B)Number of years = Value / 12.537
C)Value = (459.34 / Number of years)× 4.536
D)Number of years = (17.538 × Value)/ (-157.49)
فتح الحزمة
افتح القفل للوصول البطاقات البالغ عددها 50 في هذه المجموعة.
فتح الحزمة
k this deck
8
The following table exhibits the age of antique furniture and the corresponding prices.Use the table to answer the following question(s).(Hint: Use scatter diagram and the Excel Trendline tool where necessary).
In a linear relationship, which of the following accounts for the many possible values of the dependent variable that vary around the mean?
A)the coefficient of the dependent variable X
B)the value of the intercept ß₀
C)the random error term ε
D)the standard error SYX
In a linear relationship, which of the following accounts for the many possible values of the dependent variable that vary around the mean?
A)the coefficient of the dependent variable X
B)the value of the intercept ß₀
C)the random error term ε
D)the standard error SYX
فتح الحزمة
افتح القفل للوصول البطاقات البالغ عددها 50 في هذه المجموعة.
فتح الحزمة
k this deck
9
Use the data given below to answer the following question(s).
Following is an extract from the database of a construction company.The table shows the height of walls in feet and the cost of raising them.The estimated simple linear regression equation is given as Ŷ = b0 + b1X.(Hint: Use Excel functions).
For a simple linear regression model, significance of regression is:
A)a measure of how well the regression line fits the data.
B)a hypothesis test of whether the regression coefficient ß1 is zero.
C)a statistic that modifies the value of R² by incorporating the sample size and the number of explanatory variables in the model.
D)the variability of the observed Y-values from the predicted values.
فتح الحزمة
افتح القفل للوصول البطاقات البالغ عددها 50 في هذه المجموعة.
فتح الحزمة
k this deck
10
The following table exhibits the age of antique furniture and the corresponding prices.Use the table to answer the following question(s).(Hint: Use scatter diagram and the Excel Trendline tool where necessary).
Which of the following is true about the observed errors associated with estimating the value of the dependent variable using the regression line?
A)They are the horizontal distances between slopes and y-intercepts.
B)The errors are also referred to as critical values.
C)They are always maximized by the regression lines.
D)The errors can be negative or positive.
فتح الحزمة
افتح القفل للوصول البطاقات البالغ عددها 50 في هذه المجموعة.
فتح الحزمة
k this deck
11
The following table exhibits the age of antique furniture and the corresponding prices.Use the table to answer the following question(s).(Hint: Use scatter diagram and the Excel Trendline tool where necessary).
What is the expected value for a 90 year-old piece of furniture?
A)$1002.45
B)$997.98
C)$934.56
D)$1033.21
What is the expected value for a 90 year-old piece of furniture?
A)$1002.45
B)$997.98
C)$934.56
D)$1033.21
فتح الحزمة
افتح القفل للوصول البطاقات البالغ عددها 50 في هذه المجموعة.
فتح الحزمة
k this deck
12
Use the data given below to answer the following question(s).
Following is an extract from the database of a construction company.The table shows the height of walls in feet and the cost of raising them.The estimated simple linear regression equation is given as Ŷ = b0 + b1X.(Hint: Use Excel functions).
What is the value of the coefficient b₀?
A)-2.25321
B)0)010697
C)254.8371
D)86.81704
فتح الحزمة
افتح القفل للوصول البطاقات البالغ عددها 50 في هذه المجموعة.
فتح الحزمة
k this deck
13
Use the data given below to answer the following question(s).
Following is an extract from the database of a construction company.The table shows the height of walls in feet and the cost of raising them.The estimated simple linear regression equation is given as Ŷ = b0 + b1X.(Hint: Use Excel functions).
What is the estimated cost of raising a 10-inch wall?
A)1505.786
B)1103.578
C)968.6109
D)1123.008
فتح الحزمة
افتح القفل للوصول البطاقات البالغ عددها 50 في هذه المجموعة.
فتح الحزمة
k this deck
14
The following table exhibits the age of antique furniture and the corresponding prices.Use the table to answer the following question(s).(Hint: Use scatter diagram and the Excel Trendline tool where necessary).
What is the relationship between the age of the furniture and their values?
A)Nonlinear
B)Linear
C)Curvilinear
D)No relationship
What is the relationship between the age of the furniture and their values?
A)Nonlinear
B)Linear
C)Curvilinear
D)No relationship
فتح الحزمة
افتح القفل للوصول البطاقات البالغ عددها 50 في هذه المجموعة.
فتح الحزمة
k this deck
15
Standard residuals:
A)help detect outliers that may bias the results of a regression analysis.
B)cause differences in the regression equation by changing the slope and intercept.
C)point out the ranges for the population intercept and slope at a 95% confidence level.
D)provide information for testing hypothesis associated with the intercept and slope.
فتح الحزمة
افتح القفل للوصول البطاقات البالغ عددها 50 في هذه المجموعة.
فتح الحزمة
k this deck
16
Use the data given below to answer the following question(s).
Following is an extract from the database of a construction company.The table shows the height of walls in feet and the cost of raising them.The estimated simple linear regression equation is given as Ŷ = b0 + b1X.(Hint: Use Excel functions).
Which of the following is true about Excel outputs Multiple R?
A)It is often referred to as the coefficient of determination.
B)A value of 0 indicates positive correlation.
C)A negative slope of the regression line denotes a positive Multiple R.
D)It is another name for the sample correlation coefficient, r.
فتح الحزمة
افتح القفل للوصول البطاقات البالغ عددها 50 في هذه المجموعة.
فتح الحزمة
k this deck
17
Use the data given below to answer the following question(s).
Following is an extract from the database of a construction company.The table shows the height of walls in feet and the cost of raising them.The estimated simple linear regression equation is given as Ŷ = b0 + b1X.(Hint: Use Excel functions).
While testing hypotheses for regression coefficients, the t-test for the slope is expressed as:
A)t =
B)t =
C)t =
D)t =
فتح الحزمة
افتح القفل للوصول البطاقات البالغ عددها 50 في هذه المجموعة.
فتح الحزمة
k this deck
18
The following table exhibits the age of antique furniture and the corresponding prices.Use the table to answer the following question(s).(Hint: Use scatter diagram and the Excel Trendline tool where necessary).
For an independent variable Y, the error associated with the iᵗʰ observation is:
A)eᵢ = Yᵢ - Ŷᵢ
B)Yᵢ = (eᵢ)² - Ŷᵢ
C) (Ŷᵢ)² ᵉᵢ = Yᵢ
D)eᵢ = (Yᵢ + Ŷᵢ)²
For an independent variable Y, the error associated with the iᵗʰ observation is:
A)eᵢ = Yᵢ - Ŷᵢ
B)Yᵢ = (eᵢ)² - Ŷᵢ
C) (Ŷᵢ)² ᵉᵢ = Yᵢ
D)eᵢ = (Yᵢ + Ŷᵢ)²
فتح الحزمة
افتح القفل للوصول البطاقات البالغ عددها 50 في هذه المجموعة.
فتح الحزمة
k this deck
19
Use the data given below to answer the following question(s).
Following is an extract from the database of a construction company.The table shows the height of walls in feet and the cost of raising them.The estimated simple linear regression equation is given as Ŷ = b0 + b1X.(Hint: Use Excel functions).
Which of the following statements is true when using the Excel Regression tool?
A)The range for the independent variable values must be specified in the box for the Input Y Range.
B)Checking the option Constant is Zero forces the intercept to zero.
C)The Regression tool can be found in the Tools tab under Insert group.
D)Adding an intercept term reduces the analysis' fit to the data.
فتح الحزمة
افتح القفل للوصول البطاقات البالغ عددها 50 في هذه المجموعة.
فتح الحزمة
k this deck
20
Use the data given below to answer the following question(s).
Following is an extract from the database of a construction company.The table shows the height of walls in feet and the cost of raising them.The estimated simple linear regression equation is given as Ŷ = b0 + b1X.(Hint: Use Excel functions).
Which of the following generates a scatter chart in Excel with the values predicted by the regression model included?
A)Trendline
B)Residual Plots
C)R Square
D)Line Fit Plots
فتح الحزمة
افتح القفل للوصول البطاقات البالغ عددها 50 في هذه المجموعة.
فتح الحزمة
k this deck
21
How many additional dummy variables are required if a categorical variable has 4 levels?
A)2
B)3
C)1
D)4
A)2
B)3
C)1
D)4
فتح الحزمة
افتح القفل للوصول البطاقات البالغ عددها 50 في هذه المجموعة.
فتح الحزمة
k this deck
22
Which of the following helps in evaluation of autocorrelation?
A)Breusch-Pagan test
B)Durbin-Watson statistic
C)Hosmer-Lemeshow test
D)Cochran-Mantel-Haenszel statistics
A)Breusch-Pagan test
B)Durbin-Watson statistic
C)Hosmer-Lemeshow test
D)Cochran-Mantel-Haenszel statistics
فتح الحزمة
افتح القفل للوصول البطاقات البالغ عددها 50 في هذه المجموعة.
فتح الحزمة
k this deck
23
A(n)________ is an extreme value that is different from the rest of the data.
A)critical value
B)standard error
C)expected value
D)outlier
A)critical value
B)standard error
C)expected value
D)outlier
فتح الحزمة
افتح القفل للوصول البطاقات البالغ عددها 50 في هذه المجموعة.
فتح الحزمة
k this deck
24
Categorical variables that have been coded are called ________.
A)limited dependent variables
B)dummy variables
C)instrumental variables
D)observable variables
A)limited dependent variables
B)dummy variables
C)instrumental variables
D)observable variables
فتح الحزمة
افتح القفل للوصول البطاقات البالغ عددها 50 في هذه المجموعة.
فتح الحزمة
k this deck
25
Use the data given below to answer the following question(s).
Following is an extract from a firm's database detailing the number of hours spent on the job by employees and their corresponding pay.(Note: Assume a level of significance of 0.05 wherever necessary.)
Draw conclusions for test of hypothesis for regression coefficients.
Following is an extract from a firm's database detailing the number of hours spent on the job by employees and their corresponding pay.(Note: Assume a level of significance of 0.05 wherever necessary.)
Draw conclusions for test of hypothesis for regression coefficients.
فتح الحزمة
افتح القفل للوصول البطاقات البالغ عددها 50 في هذه المجموعة.
فتح الحزمة
k this deck
26
Use the data given below to answer the following question(s).
Following is an extract from a firm's database detailing the number of hours spent on the job by employees and their corresponding pay.(Note: Assume a level of significance of 0.05 wherever necessary.)
Is the hours spent on the job a statistically significant variable in explaining the variation in pay of employees? (Hint: Use Regression tool).
فتح الحزمة
افتح القفل للوصول البطاقات البالغ عددها 50 في هذه المجموعة.
فتح الحزمة
k this deck
27
Use the data given below to answer the following question(s).
Following is an extract from a firm's database detailing the number of hours spent on the job by employees and their corresponding pay.(Note: Assume a level of significance of 0.05 wherever necessary.)
Interpret residual output.
Following is an extract from a firm's database detailing the number of hours spent on the job by employees and their corresponding pay.(Note: Assume a level of significance of 0.05 wherever necessary.)
Interpret residual output.
فتح الحزمة
افتح القفل للوصول البطاقات البالغ عددها 50 في هذه المجموعة.
فتح الحزمة
k this deck
28
________ means that the variation about the regression line is constant for all values of the independent variable.
A)Autocorrelation
B)Normality of errors
C)Homoscedasticity
D)Linearity
A)Autocorrelation
B)Normality of errors
C)Homoscedasticity
D)Linearity
فتح الحزمة
افتح القفل للوصول البطاقات البالغ عددها 50 في هذه المجموعة.
فتح الحزمة
k this deck
29
Which of the following is true when testing for normality of errors?
A)Normality is verified by inspecting for a bell-shaped distribution.
B)It is easier to evaluate normality with small sample sizes.
C)A scatter diagram of the whole data is always used to verify normality.
D)Errors are normally distributed when the scatter diagram shows a straight-line distribution.
فتح الحزمة
افتح القفل للوصول البطاقات البالغ عددها 50 في هذه المجموعة.
فتح الحزمة
k this deck
30
In a curvilinear regression model, the ________ represents the curvilinear effect.
A)intercept
B)error term
C)slope
D)R Square
A)intercept
B)error term
C)slope
D)R Square
فتح الحزمة
افتح القفل للوصول البطاقات البالغ عددها 50 في هذه المجموعة.
فتح الحزمة
k this deck
31
Which of the following is true about multiple linear regression?
A)It is a linear regression model with more than one dependent variable.
B)The regression coefficients are called fractional regression coefficients.
C)It uses least squares to estimate the intercept and slope coefficients.
D)The ANOVA tests for the significance of each variable separately.
A)It is a linear regression model with more than one dependent variable.
B)The regression coefficients are called fractional regression coefficients.
C)It uses least squares to estimate the intercept and slope coefficients.
D)The ANOVA tests for the significance of each variable separately.
فتح الحزمة
افتح القفل للوصول البطاقات البالغ عددها 50 في هذه المجموعة.
فتح الحزمة
k this deck
32
Use the data given below to answer the following question(s).
Following is an extract from a firm's database detailing the number of hours spent on the job by employees and their corresponding pay.(Note: Assume a level of significance of 0.05 wherever necessary.)
Interpret the confidence intervals.
Following is an extract from a firm's database detailing the number of hours spent on the job by employees and their corresponding pay.(Note: Assume a level of significance of 0.05 wherever necessary.)
Interpret the confidence intervals.
فتح الحزمة
افتح القفل للوصول البطاقات البالغ عددها 50 في هذه المجموعة.
فتح الحزمة
k this deck
33
Which of the following is true about multicollinearity?
A)The effect of a dependent variable on another becomes difficult to isolate.
B)Regression coefficients become clearer and are easier to interpret.
C)P-values reduce significantly leading to rejection of null hypothesis.
D)It is best measured using the statistic variance inflation factor (VIF).
A)The effect of a dependent variable on another becomes difficult to isolate.
B)Regression coefficients become clearer and are easier to interpret.
C)P-values reduce significantly leading to rejection of null hypothesis.
D)It is best measured using the statistic variance inflation factor (VIF).
فتح الحزمة
افتح القفل للوصول البطاقات البالغ عددها 50 في هذه المجموعة.
فتح الحزمة
k this deck
34
When using the t-statistic in multiple regression to determine if a variable should be removed:
A)R² will increase if the variable is removed.
B)if |t| > 1, the standard error will decrease.
C)a large number of independent variables is convenient.
D)if |t| < 1, the standard error will increase.
A)R² will increase if the variable is removed.
B)if |t| > 1, the standard error will decrease.
C)a large number of independent variables is convenient.
D)if |t| < 1, the standard error will increase.
فتح الحزمة
افتح القفل للوصول البطاقات البالغ عددها 50 في هذه المجموعة.
فتح الحزمة
k this deck
35
While checking for linearity by examining the residual plot, the residuals must:
A)exhibit a linear trend.
B)form a parabolic shape.
C)be randomly scattered.
D)be below the x-axis.
A)exhibit a linear trend.
B)form a parabolic shape.
C)be randomly scattered.
D)be below the x-axis.
فتح الحزمة
افتح القفل للوصول البطاقات البالغ عددها 50 في هذه المجموعة.
فتح الحزمة
k this deck
36
When a scatter chart of data shows a nonlinear relationship, the nonlinear model can be expressed as:
A)Y = β₀ ⁺ β₁X + β₂X² + ε
B)Y = β₀ ⁺ β₁X + (β₂X)² + ε
C)Y = β₀ ⁺ β₁X + β₂X
D)Y = β₀ ⁺ β₁X² + β₂X² + ε
A)Y = β₀ ⁺ β₁X + β₂X² + ε
B)Y = β₀ ⁺ β₁X + (β₂X)² + ε
C)Y = β₀ ⁺ β₁X + β₂X
D)Y = β₀ ⁺ β₁X² + β₂X² + ε
فتح الحزمة
افتح القفل للوصول البطاقات البالغ عددها 50 في هذه المجموعة.
فتح الحزمة
k this deck
37
Interaction is:
A)the principle of having a model with maximum explanatory variables.
B)the process of coding categorical variables.
C)a measure to determine the correlation between dependent variables.
D)the dependence between two independent variables.
A)the principle of having a model with maximum explanatory variables.
B)the process of coding categorical variables.
C)a measure to determine the correlation between dependent variables.
D)the dependence between two independent variables.
فتح الحزمة
افتح القفل للوصول البطاقات البالغ عددها 50 في هذه المجموعة.
فتح الحزمة
k this deck
38
Use the data given below to answer the following question(s).
Following is an extract from a firm's database detailing the number of hours spent on the job by employees and their corresponding pay.(Note: Assume a level of significance of 0.05 wherever necessary.)
Construct a scatter diagram and use the Excel Trendline tool to find the best-fitting simple linear regression model.
فتح الحزمة
افتح القفل للوصول البطاقات البالغ عددها 50 في هذه المجموعة.
فتح الحزمة
k this deck
39
In multiple regression, R Square is referred to as the:
A)multiple correlation coefficient.
B)coefficient of autocorrelation.
C)coefficient of multiple determination.
D)multiple significance coefficient.
A)multiple correlation coefficient.
B)coefficient of autocorrelation.
C)coefficient of multiple determination.
D)multiple significance coefficient.
فتح الحزمة
افتح القفل للوصول البطاقات البالغ عددها 50 في هذه المجموعة.
فتح الحزمة
k this deck
40
When two or more independent variables in the same regression model can predict each other better than the dependent variable, the condition is referred to as ________.
A)autocorrelation
B)heteroscedasticity
C)multicollinearity
D)homoscedasticity
A)autocorrelation
B)heteroscedasticity
C)multicollinearity
D)homoscedasticity
فتح الحزمة
افتح القفل للوصول البطاقات البالغ عددها 50 في هذه المجموعة.
فتح الحزمة
k this deck
41
Use the data given below to answer the following question(s).
Following is an extract from a firm's database detailing the number of hours spent on the job by employees and their corresponding pay.(Note: Assume a level of significance of 0.05 wherever necessary.)
The best-fitting line maximizes the residuals.
Following is an extract from a firm's database detailing the number of hours spent on the job by employees and their corresponding pay.(Note: Assume a level of significance of 0.05 wherever necessary.)
The best-fitting line maximizes the residuals.
فتح الحزمة
افتح القفل للوصول البطاقات البالغ عددها 50 في هذه المجموعة.
فتح الحزمة
k this deck
42
Use the data given below to answer the following question(s).
Following is an extract from a firm's database detailing the number of hours spent on the job by employees and their corresponding pay.(Note: Assume a level of significance of 0.05 wherever necessary.)
A good regression model has the fewest number of explanatory variables providing an adequate interpretation of the dependent variable.
فتح الحزمة
افتح القفل للوصول البطاقات البالغ عددها 50 في هذه المجموعة.
فتح الحزمة
k this deck
43
Use the data given below to answer the following question(s).
Following is an extract from a firm's database detailing the number of hours spent on the job by employees and their corresponding pay.(Note: Assume a level of significance of 0.05 wherever necessary.)
Briefly explain the assumptions on which the statistical hypothesis tests associated with regression analysis are predicated.
فتح الحزمة
افتح القفل للوصول البطاقات البالغ عددها 50 في هذه المجموعة.
فتح الحزمة
k this deck
44
Use the data given below to answer the following question(s).
Following is an extract from a firm's database detailing the number of hours spent on the job by employees and their corresponding pay.(Note: Assume a level of significance of 0.05 wherever necessary.)
The standard error may be assumed to be large if the data are clustered close to the regression line.
فتح الحزمة
افتح القفل للوصول البطاقات البالغ عددها 50 في هذه المجموعة.
فتح الحزمة
k this deck
45
Use the data given below to answer the following question(s).
Following is an extract from a firm's database detailing the number of hours spent on the job by employees and their corresponding pay.(Note: Assume a level of significance of 0.05 wherever necessary.)
Creating a scatter chart with an added trendline is visually superior to the scatter chart generated by line fit plots.
فتح الحزمة
افتح القفل للوصول البطاقات البالغ عددها 50 في هذه المجموعة.
فتح الحزمة
k this deck
46
Use the data given below to answer the following question(s).
Following is an extract from a firm's database detailing the number of hours spent on the job by employees and their corresponding pay.(Note: Assume a level of significance of 0.05 wherever necessary.)
Why is regression analysis necessary in business? What categories of regression models are used?
Following is an extract from a firm's database detailing the number of hours spent on the job by employees and their corresponding pay.(Note: Assume a level of significance of 0.05 wherever necessary.)
Why is regression analysis necessary in business? What categories of regression models are used?
فتح الحزمة
افتح القفل للوصول البطاقات البالغ عددها 50 في هذه المجموعة.
فتح الحزمة
k this deck
47
Use the data given below to answer the following question(s).
Following is an extract from a firm's database detailing the number of hours spent on the job by employees and their corresponding pay.(Note: Assume a level of significance of 0.05 wherever necessary.)
List the systematic approach to building good multiple regression models.
Following is an extract from a firm's database detailing the number of hours spent on the job by employees and their corresponding pay.(Note: Assume a level of significance of 0.05 wherever necessary.)
List the systematic approach to building good multiple regression models.
فتح الحزمة
افتح القفل للوصول البطاقات البالغ عددها 50 في هذه المجموعة.
فتح الحزمة
k this deck
48
Use the data given below to answer the following question(s).
Following is an extract from a firm's database detailing the number of hours spent on the job by employees and their corresponding pay.(Note: Assume a level of significance of 0.05 wherever necessary.)
Explain the concept of curvilinear regression model.
Following is an extract from a firm's database detailing the number of hours spent on the job by employees and their corresponding pay.(Note: Assume a level of significance of 0.05 wherever necessary.)
Explain the concept of curvilinear regression model.
فتح الحزمة
افتح القفل للوصول البطاقات البالغ عددها 50 في هذه المجموعة.
فتح الحزمة
k this deck
49
Use the data given below to answer the following question(s).
Following is an extract from a firm's database detailing the number of hours spent on the job by employees and their corresponding pay.(Note: Assume a level of significance of 0.05 wherever necessary.)
An increase in adjusted R² indicates that the regression model has improved.
Following is an extract from a firm's database detailing the number of hours spent on the job by employees and their corresponding pay.(Note: Assume a level of significance of 0.05 wherever necessary.)
An increase in adjusted R² indicates that the regression model has improved.
فتح الحزمة
افتح القفل للوصول البطاقات البالغ عددها 50 في هذه المجموعة.
فتح الحزمة
k this deck
50
Use the data given below to answer the following question(s).
Following is an extract from a firm's database detailing the number of hours spent on the job by employees and their corresponding pay.(Note: Assume a level of significance of 0.05 wherever necessary.)
While conducting regression analysis, how is constructing a normal probability plot useful?
Following is an extract from a firm's database detailing the number of hours spent on the job by employees and their corresponding pay.(Note: Assume a level of significance of 0.05 wherever necessary.)
While conducting regression analysis, how is constructing a normal probability plot useful?
فتح الحزمة
افتح القفل للوصول البطاقات البالغ عددها 50 في هذه المجموعة.
فتح الحزمة
k this deck
فتح الحزمة
افتح القفل للوصول البطاقات البالغ عددها 50 في هذه المجموعة.


