Deck 39: Working With Tables and Charts
ملء الشاشة (f)
سؤال
سؤال
سؤال
سؤال
سؤال
سؤال
سؤال
سؤال
سؤال
سؤال
سؤال
سؤال
سؤال
سؤال
سؤال
سؤال
سؤال
سؤال
سؤال
سؤال
سؤال
سؤال
سؤال
سؤال
FIGURE PPT 6-7 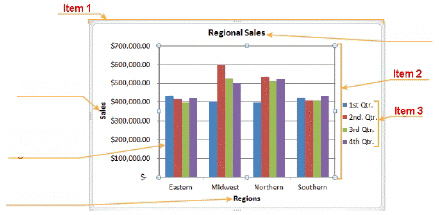 In the accompanying figure, item 2 points to the ____.
A) chart area
B) legend
C) chart title
D) plot area
In the accompanying figure, item 2 points to the ____.A) chart area
B) legend
C) chart title
D) plot area
سؤال
FIGURE PPT 6-7  In the accompanying figure, item 1 points to the ____.
A) chart area
B) legend
C) chart title
D) plot area
In the accompanying figure, item 1 points to the ____.A) chart area
B) legend
C) chart title
D) plot area
سؤال
سؤال
سؤال
سؤال
سؤال
سؤال
سؤال
سؤال
سؤال
سؤال
سؤال
سؤال
سؤال
سؤال
FIGURE PPT 6-7  In the accompanying figure, item 3 points to the ____.
A) chart area
B) legend
C) chart title
D) plot area
In the accompanying figure, item 3 points to the ____.A) chart area
B) legend
C) chart title
D) plot area
سؤال
سؤال
سؤال
Match between columns
سؤال
سؤال
سؤال
سؤال

فتح الحزمة
قم بالتسجيل لفتح البطاقات في هذه المجموعة!
Unlock Deck
Unlock Deck
1/46
العب
ملء الشاشة (f)
Deck 39: Working With Tables and Charts
1
To combine the content of two or more cells into a single cell, you can merge the cells by using the Table Merge tool.
False
2
The first step in creating a chart is to choose a chart type that presents the data in the clearest way possible.
True
3
When table text is rotated, the spacing between characters changes.
True
4
To use pie charts to compare data, you can insert more than one pie chart on a slide.
فتح الحزمة
افتح القفل للوصول البطاقات البالغ عددها 46 في هذه المجموعة.
فتح الحزمة
k this deck
5
To apply a custom table style, you must first remove any existing style.
فتح الحزمة
افتح القفل للوصول البطاقات البالغ عددها 46 في هذه المجموعة.
فتح الحزمة
k this deck
6
Case PPT 6-1 Jennifer is a satellite engineer working on a PowerPoint presentation to inform research colleagues of satellite scatter potential over the next three years. Some presentation data resides in a large table and Jennifer is having trouble getting it to fit on one slide. The table has five columns and 22 rows. All data cells are formatted in scientific notation. Since you are the Senior Information Technology analyst, Jennifer asks you for assistance. As you review the issue, you first suggest that Jennifer ____.
A) delete some data
B) reduce the data font size
C) hand out a hard copy containing all of the data
D) introduce parts of the table in segments
A) delete some data
B) reduce the data font size
C) hand out a hard copy containing all of the data
D) introduce parts of the table in segments
فتح الحزمة
افتح القفل للوصول البطاقات البالغ عددها 46 في هذه المجموعة.
فتح الحزمة
k this deck
7
You can apply a(n) theme from the gallery to create an exploded slice on a pie chart to make it more obvious.
فتح الحزمة
افتح القفل للوصول البطاقات البالغ عددها 46 في هذه المجموعة.
فتح الحزمة
k this deck
8
You can introduce parts of a table in segments .
فتح الحزمة
افتح القفل للوصول البطاقات البالغ عددها 46 في هذه المجموعة.
فتح الحزمة
k this deck
9
To create a new border within a cell, you can split the cell.
فتح الحزمة
افتح القفل للوصول البطاقات البالغ عددها 46 في هذه المجموعة.
فتح الحزمة
k this deck
10
Choosing the line styles and weights before drawing a table can save formatting time later.
فتح الحزمة
افتح القفل للوصول البطاقات البالغ عددها 46 في هذه المجموعة.
فتح الحزمة
k this deck
11
You can use the Table Eraser tool to remove the ____.
A) table
B) cell boundaries
C) slide
D) table theme
A) table
B) cell boundaries
C) slide
D) table theme
فتح الحزمة
افتح القفل للوصول البطاقات البالغ عددها 46 في هذه المجموعة.
فتح الحزمة
k this deck
12
The ____ command enables you to quickly copy and paste one or more selected slides.
A) Redo
B) Insert
C) Replicate
D) Duplicate Slides
A) Redo
B) Insert
C) Replicate
D) Duplicate Slides
فتح الحزمة
افتح القفل للوصول البطاقات البالغ عددها 46 في هذه المجموعة.
فتح الحزمة
k this deck
13
You can manually set column spacing.
فتح الحزمة
افتح القفل للوصول البطاقات البالغ عددها 46 في هذه المجموعة.
فتح الحزمة
k this deck
14
Text and numbers you enter in a table should appear in a small font size.
فتح الحزمة
افتح القفل للوصول البطاقات البالغ عددها 46 في هذه المجموعة.
فتح الحزمة
k this deck
15
A(n) chart provides a graphic representation of data.
فتح الحزمة
افتح القفل للوصول البطاقات البالغ عددها 46 في هذه المجموعة.
فتح الحزمة
k this deck
16
You can apply quick styles and borders to charts.
فتح الحزمة
افتح القفل للوصول البطاقات البالغ عددها 46 في هذه المجموعة.
فتح الحزمة
k this deck
17
You can change the direction in which PowerPoint plots data.
فتح الحزمة
افتح القفل للوصول البطاقات البالغ عددها 46 في هذه المجموعة.
فتح الحزمة
k this deck
18
When you create a new table in PowerPoint, a ____ is applied to the table.
A) style
B) theme
C) format
D) link
A) style
B) theme
C) format
D) link
فتح الحزمة
افتح القفل للوصول البطاقات البالغ عددها 46 في هذه المجموعة.
فتح الحزمة
k this deck
19
A(n) ____ border enables you to insert two different kinds of information into one table cell.
A) diagonal
B) mixed
C) invisible
D) open
A) diagonal
B) mixed
C) invisible
D) open
فتح الحزمة
افتح القفل للوصول البطاقات البالغ عددها 46 في هذه المجموعة.
فتح الحزمة
k this deck
20
A 100% Stacked Cylinder column chart combines the comparison features of a column chart with the proportional features of a(n) pie chart because each cylinder shows the relationship of items to the whole.
فتح الحزمة
افتح القفل للوصول البطاقات البالغ عددها 46 في هذه المجموعة.
فتح الحزمة
k this deck
21
A table ____________________ provides formats for shading, borders, and effects.
فتح الحزمة
افتح القفل للوصول البطاقات البالغ عددها 46 في هذه المجموعة.
فتح الحزمة
k this deck
22
Case PPT 6-1 Jennifer is a satellite engineer working on a PowerPoint presentation to inform research colleagues of satellite scatter potential over the next three years. Some presentation data resides in a large table and Jennifer is having trouble getting it to fit on one slide. The table has five columns and 22 rows. All data cells are formatted in scientific notation. Since you are the Senior Information Technology analyst, Jennifer asks you for assistance. Upon reviewing the table data structure, you help Jennifer ____.
A) introduce one column at a time on five separate slides
B) introduce one row at a time on five separate slides
C) introduce one column at a time on 22 separate slides
D) introduce one row at a time on 22 separate slides
A) introduce one column at a time on five separate slides
B) introduce one row at a time on five separate slides
C) introduce one column at a time on 22 separate slides
D) introduce one row at a time on 22 separate slides
فتح الحزمة
افتح القفل للوصول البطاقات البالغ عددها 46 في هذه المجموعة.
فتح الحزمة
k this deck
23
A(n) ____ object becomes part of the destination file and can be edited in the destination file.
A) attached
B) static
C) linked
D) embedded
A) attached
B) static
C) linked
D) embedded
فتح الحزمة
افتح القفل للوصول البطاقات البالغ عددها 46 في هذه المجموعة.
فتح الحزمة
k this deck
24
FIGURE PPT 6-7 In the accompanying figure, item 2 points to the ____.
A) chart area
B) legend
C) chart title
D) plot area
In the accompanying figure, item 2 points to the ____.A) chart area
B) legend
C) chart title
D) plot area
فتح الحزمة
افتح القفل للوصول البطاقات البالغ عددها 46 في هذه المجموعة.
فتح الحزمة
k this deck
25
FIGURE PPT 6-7 In the accompanying figure, item 1 points to the ____.
A) chart area
B) legend
C) chart title
D) plot area
In the accompanying figure, item 1 points to the ____.A) chart area
B) legend
C) chart title
D) plot area
فتح الحزمة
افتح القفل للوصول البطاقات البالغ عددها 46 في هذه المجموعة.
فتح الحزمة
k this deck
26
A ____ chart type is useful when you want to make comparisons among individual items.
A) bar
B) line
C) stock
D) surface
A) bar
B) line
C) stock
D) surface
فتح الحزمة
افتح القفل للوصول البطاقات البالغ عددها 46 في هذه المجموعة.
فتح الحزمة
k this deck
27
Chart elements consist of graphics and text ____.
A) boxes
B) menus
C) buttons
D) tabs
A) boxes
B) menus
C) buttons
D) tabs
فتح الحزمة
افتح القفل للوصول البطاقات البالغ عددها 46 في هذه المجموعة.
فتح الحزمة
k this deck
28
Case PPT 6-2 Simon is a financial analyst working on a PowerPoint presentation to aid his discussion on new home sales data in the Eastern regions of the United States. His data is accumulated from three economic reports provided to him daily. Simon then imports this economic data into an Excel worksheet each morning where predefined calculations manipulate the data for his informational needs. Simon needs to get portions of this data into his slide show. Because Simon's data is regularly updated in Excel, he should ____.
A) import the Excel chart data into his presentation file as a linked object
B) import the Excel chart data into his presentation file as an embedded object
C) drag and drop the data into the slide show
D) consider using another program to display the data separately
A) import the Excel chart data into his presentation file as a linked object
B) import the Excel chart data into his presentation file as an embedded object
C) drag and drop the data into the slide show
D) consider using another program to display the data separately
فتح الحزمة
افتح القفل للوصول البطاقات البالغ عددها 46 في هذه المجموعة.
فتح الحزمة
k this deck
29
You can use the ____ to resize elements.
A) Grid Draw tool
B) sizing handles
C) Kerning tool
D) resize button
A) Grid Draw tool
B) sizing handles
C) Kerning tool
D) resize button
فتح الحزمة
افتح القفل للوصول البطاقات البالغ عددها 46 في هذه المجموعة.
فتح الحزمة
k this deck
30
To promote and demote objects in the organization chart hierarchy, you can use the Promote and Demote buttons on the ____ tab.
A) Developers
B) SmartArt Tools Design
C) Charts
D) Modify
A) Developers
B) SmartArt Tools Design
C) Charts
D) Modify
فتح الحزمة
افتح القفل للوصول البطاقات البالغ عددها 46 في هذه المجموعة.
فتح الحزمة
k this deck
31
A ____ chart type is effective in finding combinations between two sets of data.
A) bar
B) line
C) stock
D) surface
A) bar
B) line
C) stock
D) surface
فتح الحزمة
افتح القفل للوصول البطاقات البالغ عددها 46 في هذه المجموعة.
فتح الحزمة
k this deck
32
Case PPT 6-2 Simon is a financial analyst working on a PowerPoint presentation to aid his discussion on new home sales data in the Eastern regions of the United States. His data is accumulated from three economic reports provided to him daily. Simon then imports this economic data into an Excel worksheet each morning where predefined calculations manipulate the data for his informational needs. Simon needs to get portions of this data into his slide show. As the data can vary from day to day, Simon is concerned about keeping his formatting consistent. He should use the ____ options, which enable Simon to use source formatting.
A) Insert
B) Update
C) Paste
D) Imbed
A) Insert
B) Update
C) Paste
D) Imbed
فتح الحزمة
افتح القفل للوصول البطاقات البالغ عددها 46 في هذه المجموعة.
فتح الحزمة
k this deck
33
You edit ____ data by editing the data in the Excel worksheet.
A) attached
B) protected
C) linked
D) embedded
A) attached
B) protected
C) linked
D) embedded
فتح الحزمة
افتح القفل للوصول البطاقات البالغ عددها 46 في هذه المجموعة.
فتح الحزمة
k this deck
34
You can create ____ for an object in a chart.
A) hyperlinks
B) security codes
C) mirror images
D) shields
A) hyperlinks
B) security codes
C) mirror images
D) shields
فتح الحزمة
افتح القفل للوصول البطاقات البالغ عددها 46 في هذه المجموعة.
فتح الحزمة
k this deck
35
You can customize a chart by modifying the ____ elements.
A) slide
B) source
C) chart
D) window
A) slide
B) source
C) chart
D) window
فتح الحزمة
افتح القفل للوصول البطاقات البالغ عددها 46 في هذه المجموعة.
فتح الحزمة
k this deck
36
You can ____ an element within the chart area to select it.
A) click
B) right-click
C) double-click
D) hover over
A) click
B) right-click
C) double-click
D) hover over
فتح الحزمة
افتح القفل للوصول البطاقات البالغ عددها 46 في هذه المجموعة.
فتح الحزمة
k this deck
37
A ____ chart type is effective in making comparisons among individual items or showing changes over a period of time.
A) pie
B) column
C) stock
D) bubble
A) pie
B) column
C) stock
D) bubble
فتح الحزمة
افتح القفل للوصول البطاقات البالغ عددها 46 في هذه المجموعة.
فتح الحزمة
k this deck
38
Organization charts are most commonly used to show the structure of ____ in a company.
A) room layouts
B) an information technology network
C) personnel
D) blueprints
A) room layouts
B) an information technology network
C) personnel
D) blueprints
فتح الحزمة
افتح القفل للوصول البطاقات البالغ عددها 46 في هذه المجموعة.
فتح الحزمة
k this deck
39
FIGURE PPT 6-7 In the accompanying figure, item 3 points to the ____.
A) chart area
B) legend
C) chart title
D) plot area
In the accompanying figure, item 3 points to the ____.A) chart area
B) legend
C) chart title
D) plot area
فتح الحزمة
افتح القفل للوصول البطاقات البالغ عددها 46 في هذه المجموعة.
فتح الحزمة
k this deck
40
You cannot update linked data in a(n) ____ file.
A) destination
B) source
C) locked
D) embedded
A) destination
B) source
C) locked
D) embedded
فتح الحزمة
افتح القفل للوصول البطاقات البالغ عددها 46 في هذه المجموعة.
فتح الحزمة
k this deck
41
A(n) ____________________ chart type illustrates parts as they relate to a whole, like a pie chart, but can be used for more than one data series.
فتح الحزمة
افتح القفل للوصول البطاقات البالغ عددها 46 في هذه المجموعة.
فتح الحزمة
k this deck
42
Match between columns
فتح الحزمة
افتح القفل للوصول البطاقات البالغ عددها 46 في هذه المجموعة.
فتح الحزمة
k this deck
43
Describe a pie chart and a doughnut chart and explain the difference between the two chart types.
فتح الحزمة
افتح القفل للوصول البطاقات البالغ عددها 46 في هذه المجموعة.
فتح الحزمة
k this deck
44
The ____________________ chart element represents text or numbers that provide additional information about a value in the data series.
فتح الحزمة
افتح القفل للوصول البطاقات البالغ عددها 46 في هذه المجموعة.
فتح الحزمة
k this deck
45
The ____________________ chart element represents a line bordering the chart plot area used as a frame of reference for measurement.
فتح الحزمة
افتح القفل للوصول البطاقات البالغ عددها 46 في هذه المجموعة.
فتح الحزمة
k this deck
46
A(n) ____________________ chart type might be used to compare the progress of sales reps achieving sales goals.
فتح الحزمة
افتح القفل للوصول البطاقات البالغ عددها 46 في هذه المجموعة.
فتح الحزمة
k this deck
فتح الحزمة
افتح القفل للوصول البطاقات البالغ عددها 46 في هذه المجموعة.


