Deck 6: Excel Lesson 4: Working With Charts and Graphics
ملء الشاشة (f)
سؤال
سؤال
سؤال
سؤال
سؤال
سؤال
سؤال
سؤال
سؤال
سؤال
سؤال
سؤال
سؤال
سؤال
سؤال
سؤال
سؤال
سؤال
سؤال
سؤال
سؤال
سؤال
سؤال
سؤال
سؤال
سؤال
سؤال
سؤال
سؤال
سؤال
سؤال
سؤال
سؤال
سؤال
سؤال
سؤال
سؤال
سؤال
FIGURE EX 4-1 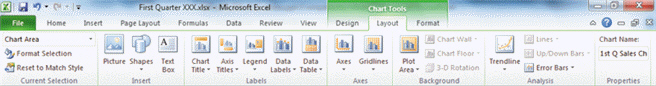 In Figure EX 4-1 above, which group contains options for displaying, hiding, and specifying the location of chart elements?
A) Current Selection
B) Insert
C) Labels
D) Background
In Figure EX 4-1 above, which group contains options for displaying, hiding, and specifying the location of chart elements?A) Current Selection
B) Insert
C) Labels
D) Background
سؤال
سؤال
FIGURE EX 4-1  As shown in Figure EX 4-1 above, which chart element is currently selected?
A) Chart Area
B) Plot Area
C) Data Series
D) Axis Titles
As shown in Figure EX 4-1 above, which chart element is currently selected?A) Chart Area
B) Plot Area
C) Data Series
D) Axis Titles
سؤال
Match between columns
سؤال
سؤال
سؤال
سؤال
سؤال

فتح الحزمة
قم بالتسجيل لفتح البطاقات في هذه المجموعة!
Unlock Deck
Unlock Deck
1/46
العب
ملء الشاشة (f)
Deck 6: Excel Lesson 4: Working With Charts and Graphics
1
When you select one data point on a chart, the entire data series is selected.
True
2
Sparklines refer to shapes, curves, and lines that you create in the worksheet by selecting a shape and then clicking and dragging.
False
3
Which of the following is not a contextual tab that is displayed after you create a chart?
A) Chart Tools Design
B) Chart Tools Style
C) Chart Tools Layout
D) Chart Tools Format
A) Chart Tools Design
B) Chart Tools Style
C) Chart Tools Layout
D) Chart Tools Format
B
4
You can resize a chart by selecting it and then dragging one of the dotted sizing handles.
فتح الحزمة
افتح القفل للوصول البطاقات البالغ عددها 46 في هذه المجموعة.
فتح الحزمة
k this deck
5
All the elements of a chart are contained in every chart, regardless of the type.
فتح الحزمة
افتح القفل للوصول البطاقات البالغ عددها 46 في هذه المجموعة.
فتح الحزمة
k this deck
6
If the worksheet data is changed, Excel automatically updates the chart.
فتح الحزمة
افتح القفل للوصول البطاقات البالغ عددها 46 في هذه المجموعة.
فتح الحزمة
k this deck
7
Which of the following extends from the vertical or horizontal axes across the plot area of a chart?
A) data marker
B) legend
C) title
D) gridlines
A) data marker
B) legend
C) title
D) gridlines
فتح الحزمة
افتح القفل للوصول البطاقات البالغ عددها 46 في هذه المجموعة.
فتح الحزمة
k this deck
8
Charts and graphics add visual impact to worksheets and help convey the meaning of worksheet data.
فتح الحزمة
افتح القفل للوصول البطاقات البالغ عددها 46 في هذه المجموعة.
فتح الحزمة
k this deck
9
The legend on a chart is in a fixed position and cannot be moved.
فتح الحزمة
افتح القفل للوصول البطاقات البالغ عددها 46 في هذه المجموعة.
فتح الحزمة
k this deck
10
A ____ is a dot, bar, or a symbol used to represent one number from the worksheet.
A) data marker
B) data series
C) vertical axis
D) horizontal axis
A) data marker
B) data series
C) vertical axis
D) horizontal axis
فتح الحزمة
افتح القفل للوصول البطاقات البالغ عددها 46 في هذه المجموعة.
فتح الحزمة
k this deck
11
An embedded chart allows you to view or print the chart along with its source data.
فتح الحزمة
افتح القفل للوصول البطاقات البالغ عددها 46 في هذه المجموعة.
فتح الحزمة
k this deck
12
To modify a specific element of a chart, you must first select it.
فتح الحزمة
افتح القفل للوصول البطاقات البالغ عددها 46 في هذه المجموعة.
فتح الحزمة
k this deck
13
The options available in the Format dialog box depend on which chart element you have selected.
فتح الحزمة
افتح القفل للوصول البطاقات البالغ عددها 46 في هذه المجموعة.
فتح الحزمة
k this deck
14
The first step in creating a chart is to select the ____.
A) data marker
B) data series
C) data source
D) data area
A) data marker
B) data series
C) data source
D) data area
فتح الحزمة
افتح القفل للوصول البطاقات البالغ عددها 46 في هذه المجموعة.
فتح الحزمة
k this deck
15
When you click a button on the Charts group of the ____ tab, the subtypes available for that type of chart are displayed.
A) Home
B) Insert
C) Page Layout
D) Review
A) Home
B) Insert
C) Page Layout
D) Review
فتح الحزمة
افتح القفل للوصول البطاقات البالغ عددها 46 في هذه المجموعة.
فتح الحزمة
k this deck
16
SmartArt is a predesigned diagram made up of shapes containing text that illustrates a concept or idea.
فتح الحزمة
افتح القفل للوصول البطاقات البالغ عددها 46 في هذه المجموعة.
فتح الحزمة
k this deck
17
When you click the Charts group dialog box launcher, the New Chart dialog box opens.
فتح الحزمة
افتح القفل للوصول البطاقات البالغ عددها 46 في هذه المجموعة.
فتح الحزمة
k this deck
18
The data marker in a chart is a list that identifies the patterns or colors of the data series or categories in a chart.
فتح الحزمة
افتح القفل للوصول البطاقات البالغ عددها 46 في هذه المجموعة.
فتح الحزمة
k this deck
19
The Change Chart Type button is located in the Type group on the Chart Tools Layout tab.
فتح الحزمة
افتح القفل للوصول البطاقات البالغ عددها 46 في هذه المجموعة.
فتح الحزمة
k this deck
20
To make any chart with axes easier to read, you can choose to display gridlines .
فتح الحزمة
افتح القفل للوصول البطاقات البالغ عددها 46 في هذه المجموعة.
فتح الحزمة
k this deck
21
Case EX 4-2 The small company that Trey works for has just hired several new employees. His supervisor asks Trey to create an organization chart for the company using Excel. When creating an organization chart, Trey would begin by using the ____ tab on the Ribbon.
A) Home
B) Insert
C) Page Layout
D) Review
A) Home
B) Insert
C) Page Layout
D) Review
فتح الحزمة
افتح القفل للوصول البطاقات البالغ عددها 46 في هذه المجموعة.
فتح الحزمة
k this deck
22
Case EX 4-1 Billie Ruth created a bar chart using sales data from last quarter. Now she wants to modify the chart using the Chart Tools Design tab. Which of the following tasks can Billie Ruth not perform using the Chart Tools Design tab?
A) Move the chart to another worksheet
B) Sesize the chart
C) Change the type of chart
D) Apply a quick layout
A) Move the chart to another worksheet
B) Sesize the chart
C) Change the type of chart
D) Apply a quick layout
فتح الحزمة
افتح القفل للوصول البطاقات البالغ عددها 46 في هذه المجموعة.
فتح الحزمة
k this deck
23
To remove a sparkline from a cell, click the ____ button in the Group group on the Sparkline Tools Design tab.
A) Remove
B) Delete
C) Undo
D) Clear
A) Remove
B) Delete
C) Undo
D) Clear
فتح الحزمة
افتح القفل للوصول البطاقات البالغ عددها 46 في هذه المجموعة.
فتح الحزمة
k this deck
24
To move a selected chart within a worksheet, you can click its ____ and drag it to a new location.
A) title
B) data source
C) border
D) legend
A) title
B) data source
C) border
D) legend
فتح الحزمة
افتح القفل للوصول البطاقات البالغ عددها 46 في هذه المجموعة.
فتح الحزمة
k this deck
25
Case EX 4-1 Billie Ruth created a bar chart using sales data from last quarter. Now she wants to modify the chart using the Chart Tools Design tab. When changing the chart style using the Chart Tools Design tab, the color options Billie Ruth has available depend on ____.
A) which chart type is selected
B) the overall layout of the chart
C) which theme is applied to the workbook
D) whether WordArt has been added
A) which chart type is selected
B) the overall layout of the chart
C) which theme is applied to the workbook
D) whether WordArt has been added
فتح الحزمة
افتح القفل للوصول البطاقات البالغ عددها 46 في هذه المجموعة.
فتح الحزمة
k this deck
26
When you select a chart, the corresponding data on the worksheet is ____.
A) color-coded
B) hidden
C) surrounded by a rotating border
D) saved
A) color-coded
B) hidden
C) surrounded by a rotating border
D) saved
فتح الحزمة
افتح القفل للوصول البطاقات البالغ عددها 46 في هذه المجموعة.
فتح الحزمة
k this deck
27
Which of the following would you use if you wanted to create a basic block arrow?
A) Pictures
B) Clip art
C) Drawing objects
D) SmartArt graphics
A) Pictures
B) Clip art
C) Drawing objects
D) SmartArt graphics
فتح الحزمة
افتح القفل للوصول البطاقات البالغ عددها 46 في هذه المجموعة.
فتح الحزمة
k this deck
28
How many types of sparklines are there?
A) One
B) Two
C) Three
D) Four
A) One
B) Two
C) Three
D) Four
فتح الحزمة
افتح القفل للوصول البطاقات البالغ عددها 46 في هذه المجموعة.
فتح الحزمة
k this deck
29
When you insert a SmartArt graphic, a ____ is also displayed to help simplify the process of entering text.
A) ScreenTip
B) Text Pane
C) drawing object
D) blank line
A) ScreenTip
B) Text Pane
C) drawing object
D) blank line
فتح الحزمة
افتح القفل للوصول البطاقات البالغ عددها 46 في هذه المجموعة.
فتح الحزمة
k this deck
30
You can use ____ to easily create interesting text effects in a variety of shapes and unusual alignments.
A) WordArt
B) drawing objects
C) clip art
D) SmartArt
A) WordArt
B) drawing objects
C) clip art
D) SmartArt
فتح الحزمة
افتح القفل للوصول البطاقات البالغ عددها 46 في هذه المجموعة.
فتح الحزمة
k this deck
31
By default, a newly created chart is placed in the worksheet as a(n) ____.
A) chart sheet
B) drawing object
C) SmartArt graphic
D) embedded chart
A) chart sheet
B) drawing object
C) SmartArt graphic
D) embedded chart
فتح الحزمة
افتح القفل للوصول البطاقات البالغ عددها 46 في هذه المجموعة.
فتح الحزمة
k this deck
32
To change the location of a chart, you can click the ____ button in the Location group of the Chart Tools Design tab.
A) Change Location
B) Move Chart
C) Chart Sheet
D) Move Location
A) Change Location
B) Move Chart
C) Chart Sheet
D) Move Location
فتح الحزمة
افتح القفل للوصول البطاقات البالغ عددها 46 في هذه المجموعة.
فتح الحزمة
k this deck
33
To resize a chart proportionally, press and hold ____ while dragging a corner handle.
A) Ctrl
B) Alt
C) Shift
D) Tab
A) Ctrl
B) Alt
C) Shift
D) Tab
فتح الحزمة
افتح القفل للوصول البطاقات البالغ عددها 46 في هذه المجموعة.
فتح الحزمة
k this deck
34
A(n) ____________________ is a graphical representation of worksheet data.
فتح الحزمة
افتح القفل للوصول البطاقات البالغ عددها 46 في هذه المجموعة.
فتح الحزمة
k this deck
35
Case EX 4-2 The small company that Trey works for has just hired several new employees. His supervisor asks Trey to create an organization chart for the company using Excel. The easiest way for Trey to create an organization chart would be to use ____.
A) clip art
B) WordArt
C) SmartArt graphics
D) sparklines
A) clip art
B) WordArt
C) SmartArt graphics
D) sparklines
فتح الحزمة
افتح القفل للوصول البطاقات البالغ عددها 46 في هذه المجموعة.
فتح الحزمة
k this deck
36
The commands used to insert graphics such as pictures and clip art are located on the Insert tab in the ____ group.
A) Pictures
B) Graphics
C) Illustrations
D) Visual
A) Pictures
B) Graphics
C) Illustrations
D) Visual
فتح الحزمة
افتح القفل للوصول البطاقات البالغ عددها 46 في هذه المجموعة.
فتح الحزمة
k this deck
37
When you select the chart title, the text is also displayed in the ____.
A) formula bar
B) legend
C) plot area
D) data source
A) formula bar
B) legend
C) plot area
D) data source
فتح الحزمة
افتح القفل للوصول البطاقات البالغ عددها 46 في هذه المجموعة.
فتح الحزمة
k this deck
38
FIGURE EX 4-1 In Figure EX 4-1 above, which group contains options for displaying, hiding, and specifying the location of chart elements?
A) Current Selection
B) Insert
C) Labels
D) Background
In Figure EX 4-1 above, which group contains options for displaying, hiding, and specifying the location of chart elements?A) Current Selection
B) Insert
C) Labels
D) Background
فتح الحزمة
افتح القفل للوصول البطاقات البالغ عددها 46 في هذه المجموعة.
فتح الحزمة
k this deck
39
When you position the pointer on a chart element, a ____ appears.
A) shortcut menu
B) ScreenTip
C) data series
D) color-coded rectangle
A) shortcut menu
B) ScreenTip
C) data series
D) color-coded rectangle
فتح الحزمة
افتح القفل للوصول البطاقات البالغ عددها 46 في هذه المجموعة.
فتح الحزمة
k this deck
40
FIGURE EX 4-1 As shown in Figure EX 4-1 above, which chart element is currently selected?
A) Chart Area
B) Plot Area
C) Data Series
D) Axis Titles
As shown in Figure EX 4-1 above, which chart element is currently selected?A) Chart Area
B) Plot Area
C) Data Series
D) Axis Titles
فتح الحزمة
افتح القفل للوصول البطاقات البالغ عددها 46 في هذه المجموعة.
فتح الحزمة
k this deck
41
Match between columns
فتح الحزمة
افتح القفل للوصول البطاقات البالغ عددها 46 في هذه المجموعة.
فتح الحزمة
k this deck
42
You can move a chart to a(n) ____________________, which is a separate sheet in the workbook.
فتح الحزمة
افتح القفل للوصول البطاقات البالغ عددها 46 في هذه المجموعة.
فتح الحزمة
k this deck
43
What is the purpose of a chart title? Name as many ways as you can think of to format or modify a chart title, including the location of the options or the process.
فتح الحزمة
افتح القفل للوصول البطاقات البالغ عددها 46 في هذه المجموعة.
فتح الحزمة
k this deck
44
____________________ are miniature charts that are embedded in the background of a single cell.
فتح الحزمة
افتح القفل للوصول البطاقات البالغ عددها 46 في هذه المجموعة.
فتح الحزمة
k this deck
45
You can choose to display horizontal or vertical gridlines across the plot area of a chart by clicking the Gridlines button in the Axes group on the Chart Tools ____________________ tab.
فتح الحزمة
افتح القفل للوصول البطاقات البالغ عددها 46 في هذه المجموعة.
فتح الحزمة
k this deck
46
____________________ is a drawing tool that turns words into a graphics image.
فتح الحزمة
افتح القفل للوصول البطاقات البالغ عددها 46 في هذه المجموعة.
فتح الحزمة
k this deck
فتح الحزمة
افتح القفل للوصول البطاقات البالغ عددها 46 في هذه المجموعة.


