Deck 13: Association Between Variables Measured at the Interval Ratio Level
ملء الشاشة (f)
سؤال
سؤال
سؤال
سؤال
سؤال
سؤال
سؤال
سؤال
سؤال
سؤال
سؤال
سؤال
سؤال
سؤال
سؤال
سؤال
سؤال
سؤال
سؤال
سؤال
سؤال
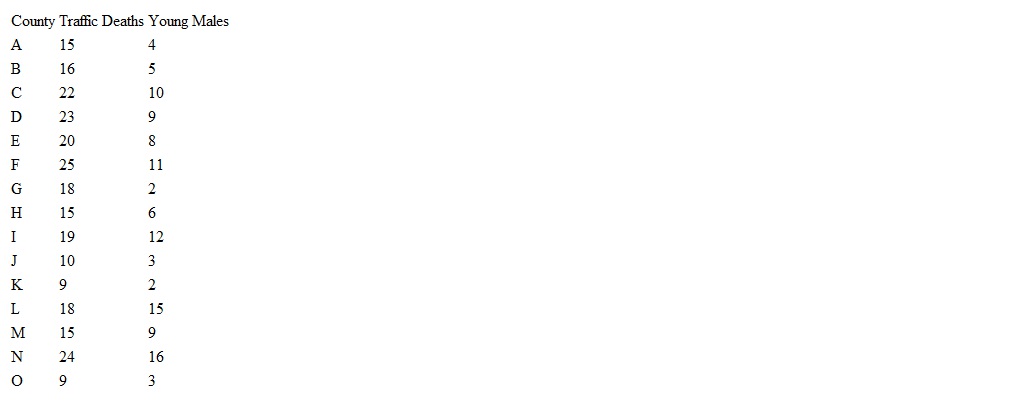
For a sample of 15 rural counties in one state, a researcher has collected information about the rate of deaths due to traffic accidents per 1,000,000 population and the percentage of the population which consists of males, age 16 to 25. For these variables, find the least squares regression line and compute r and r squared. Write a sentence or two summarizing and explaining your results.
سؤال
سؤال
سؤال
سؤال
سؤال
سؤال
سؤال
سؤال
سؤال
سؤال
سؤال
سؤال
سؤال
سؤال
سؤال
سؤال

فتح الحزمة
قم بالتسجيل لفتح البطاقات في هذه المجموعة!
Unlock Deck
Unlock Deck
1/37
العب
ملء الشاشة (f)
Deck 13: Association Between Variables Measured at the Interval Ratio Level
1
After scores of all cases have been located on a scatterplot, a straight line drawn so that it comes as close as possible to touching every score is called the________.
A) regression line.
B) line of approximation.
C) cluster line.
D) scatterplot summary.
A) regression line.
B) line of approximation.
C) cluster line.
D) scatterplot summary.
A
2
One important function of the least-squares regression equation is that________.
A) we can use it to tell if a relationship is linear.
B) it summarizes all possible scores on the two variables.
C) it makes the scattergram symmetrical.
D) it allows us to predict Y scores for any value of X.
A) we can use it to tell if a relationship is linear.
B) it summarizes all possible scores on the two variables.
C) it makes the scattergram symmetrical.
D) it allows us to predict Y scores for any value of X.
D
3
If a = 2 and b = 4, what would the value of Y be when X = 1?
A) 4
B) 6
C) 2
D) 1
A) 4
B) 6
C) 2
D) 1
B
4
If the slope (b) is zero, the value of r________.
A) would also be zero.
B) would be 1.00.
C) would be - 1.00.
D) cannot be determined from the information given.
A) would also be zero.
B) would be 1.00.
C) would be - 1.00.
D) cannot be determined from the information given.
فتح الحزمة
افتح القفل للوصول البطاقات البالغ عددها 37 في هذه المجموعة.
فتح الحزمة
k this deck
5
If you wanted to measure the association between the age of people (in years) and the number of arrests for driving while intoxicated, the most appropriate measure of association would be________.
A) gamma.
B) lambda.
C) phi.
D) Pearson's r.
A) gamma.
B) lambda.
C) phi.
D) Pearson's r.
فتح الحزمة
افتح القفل للوصول البطاقات البالغ عددها 37 في هذه المجموعة.
فتح الحزمة
k this deck
6
The explained variation represents________.
A) the conditional distributions of Y.
B) the amount that Y varies.
C) the improvement in our ability to predict Y when taking X into account.
D) the sum of the squares of all scores of Y.
A) the conditional distributions of Y.
B) the amount that Y varies.
C) the improvement in our ability to predict Y when taking X into account.
D) the sum of the squares of all scores of Y.
فتح الحزمة
افتح القفل للوصول البطاقات البالغ عددها 37 في هذه المجموعة.
فتح الحزمة
k this deck
7
In a study of the relationship between geographical mobility (number of times a person has changed residences) and number of friends, Pearson's r is reported as .40. Which of the following would be a correct interpretation?
A) Mobility explains 16% of the variation in number of friends.
B) There is a strong positive relationship between number of friends and mobility.
C) As mobility increases, number of friends decreases.
D) Mobility explains 40% of the variation in number of friends.
A) Mobility explains 16% of the variation in number of friends.
B) There is a strong positive relationship between number of friends and mobility.
C) As mobility increases, number of friends decreases.
D) Mobility explains 40% of the variation in number of friends.
فتح الحزمة
افتح القفل للوصول البطاقات البالغ عددها 37 في هذه المجموعة.
فتح الحزمة
k this deck
8
When working with interval-ratio data, the optimal strategy for predicting Y while taking X into account would be to________.
A) use the regression line.
B) guess randomly.
C) ignore the slope (b).
D) always predict the Y intercept (a).
A) use the regression line.
B) guess randomly.
C) ignore the slope (b).
D) always predict the Y intercept (a).
فتح الحزمة
افتح القفل للوصول البطاقات البالغ عددها 37 في هذه المجموعة.
فتح الحزمة
k this deck
9
A researcher wants to measure the strength of the association between income (measured in dollars per year) and education (measured in number of years of formal schooling). Which of the following would be the most appropriate measure of association?
A) The slope (b)
B) Gamma
C) Chi square
D) Pearson's r
A) The slope (b)
B) Gamma
C) Chi square
D) Pearson's r
فتح الحزمة
افتح القفل للوصول البطاقات البالغ عددها 37 في هذه المجموعة.
فتح الحزمة
k this deck
10
The amount of error in predicting Y that remains after X has been taken into account is________.
A) the unexplained variation of Y.
B) r - 1.00.
C) always zero.
D) r.
A) the unexplained variation of Y.
B) r - 1.00.
C) always zero.
D) r.
فتح الحزمة
افتح القفل للوصول البطاقات البالغ عددها 37 في هذه المجموعة.
فتح الحزمة
k this deck
11
If a regression line is parallel to the horizontal axis of the scattergram, the slope (b) will be________.
A) 1.00.
B) -1.00.
C) 0.00.
D) 0.45.
A) 1.00.
B) -1.00.
C) 0.00.
D) 0.45.
فتح الحزمة
افتح القفل للوصول البطاقات البالغ عددها 37 في هذه المجموعة.
فتح الحزمة
k this deck
12
A study found that parenting classes were closely related to a child's performance in school. Each week of parenting classes taken by a child's parents raised their high school GPA by 0.23 points. With an intercept of 1.68, what could parents who attended 8 weeks of classes expect to see in their child's subsequent GPA?
A) 2.52
B) 3.21
C) 3.52
D) 3.79
A) 2.52
B) 3.21
C) 3.52
D) 3.79
فتح الحزمة
افتح القفل للوصول البطاقات البالغ عددها 37 في هذه المجموعة.
فتح الحزمة
k this deck
13
If a = 5 and b = 10, what would the value of Y be when X = 100?________.
A) Unknown, more information is needed
B) 1000
C) 1005
D) 5001
A) Unknown, more information is needed
B) 1000
C) 1005
D) 5001
فتح الحزمة
افتح القفل للوصول البطاقات البالغ عددها 37 في هذه المجموعة.
فتح الحزمة
k this deck
14
In most correlation matrices, the diagonal line has a value of________.
A) 0.
B) 1.
C) 5.
D) it cannot be predicted.
A) 0.
B) 1.
C) 5.
D) it cannot be predicted.
فتح الحزمة
افتح القفل للوصول البطاقات البالغ عددها 37 في هذه المجموعة.
فتح الحزمة
k this deck
15
The appropriate measure of association for situations in which both variables are interval-ratio in level of measurement is________.
A) Pearson's r.
B) gamma.
C) chi square.
D) the slope (b).
A) Pearson's r.
B) gamma.
C) chi square.
D) the slope (b).
فتح الحزمة
افتح القفل للوصول البطاقات البالغ عددها 37 في هذه المجموعة.
فتح الحزمة
k this deck
16
A study of traffic safety shows a correlation of 0.57 between average speed of traffic and number of fatal accidents for a particular stretch of highway. This means that________.
A) drivers should speed up to get through this area as quickly as possible.
B) as speed increases, fatalities decrease.
C) fatalities tend to increase as average speed increases.
D) every 1 mile per hour increase in average speed increases the number of traffic fatalities by .57.
A) drivers should speed up to get through this area as quickly as possible.
B) as speed increases, fatalities decrease.
C) fatalities tend to increase as average speed increases.
D) every 1 mile per hour increase in average speed increases the number of traffic fatalities by .57.
فتح الحزمة
افتح القفل للوصول البطاقات البالغ عددها 37 في هذه المجموعة.
فتح الحزمة
k this deck
17
If the slope of a regression line is 1.5, then________.
A) for every unit of change in X, there is a change of 1.5 units in Y.
B) for every unit of change in Y, there is a change of 1.5 in X.
C) the score of each case is 1.5 times higher on Y than on X.
D) Y causes X
A) for every unit of change in X, there is a change of 1.5 units in Y.
B) for every unit of change in Y, there is a change of 1.5 in X.
C) the score of each case is 1.5 times higher on Y than on X.
D) Y causes X
فتح الحزمة
افتح القفل للوصول البطاقات البالغ عددها 37 في هذه المجموعة.
فتح الحزمة
k this deck
18
If we calculate an r of .60, the proportion of the variation of Y that is explained by X is________.
A) )36
B) )40
C) )60
D) )64
A) )36
B) )40
C) )60
D) )64
فتح الحزمة
افتح القفل للوصول البطاقات البالغ عددها 37 في هذه المجموعة.
فتح الحزمة
k this deck
19
When working with interval-ratio data, the optimal strategy for predicting Y while ignoring X will be to use the________.
A) mode of the Y scores for every case.
B) median Y score for every case.
C) mean Y score for every case.
D) lowest Y score for every case.
A) mode of the Y scores for every case.
B) median Y score for every case.
C) mean Y score for every case.
D) lowest Y score for every case.
فتح الحزمة
افتح القفل للوصول البطاقات البالغ عددها 37 في هذه المجموعة.
فتح الحزمة
k this deck
20
By convention, the independent variable is arrayed along the ______________ in a scatterplot.
A) vertical axis (the ordinate)
B) regression line
C) horizontal axis (the abscissa)
D) calibration line
A) vertical axis (the ordinate)
B) regression line
C) horizontal axis (the abscissa)
D) calibration line
فتح الحزمة
افتح القفل للوصول البطاقات البالغ عددها 37 في هذه المجموعة.
فتح الحزمة
k this deck
21
For a sample of 15 rural counties in one state, a researcher has collected information about the rate of deaths due to traffic accidents per 1,000,000 population and the percentage of the population which consists of males, age 16 to 25. For these variables, find the least squares regression line and compute r and r squared. Write a sentence or two summarizing and explaining your results.
فتح الحزمة
افتح القفل للوصول البطاقات البالغ عددها 37 في هذه المجموعة.
فتح الحزمة
k this deck
22
When testing Pearson's r for significance, the null hypothesis is that________.
A) there is no difference between the variables in the population from which the sample was drawn.
B) there is no linear association between the variables in the population from which the sample was drawn.
C) there is no difference between the sample and the population from which the sample was drawn.
D) r = 1.00.
فتح الحزمة
افتح القفل للوصول البطاقات البالغ عددها 37 في هذه المجموعة.
فتح الحزمة
k this deck
23
The conditional mean of Y for any value of X is found by________.
A) adding the Y scores for the specific value of X and dividing by N.
B) adding all the Y scores and dividing by X.
C) subtracting the mean of Y from the overall mean of X.
D) Any of the answer choices
A) adding the Y scores for the specific value of X and dividing by N.
B) adding all the Y scores and dividing by X.
C) subtracting the mean of Y from the overall mean of X.
D) Any of the answer choices
فتح الحزمة
افتح القفل للوصول البطاقات البالغ عددها 37 في هذه المجموعة.
فتح الحزمة
k this deck
24
In a scatterplot, the point of minimized variation for scores of Y for a given value of X (the independent variable) is________.
A) the sum of the conditional Y scores.
B) the standard deviation of the conditional Y scores.
C) the mean of the conditional Y scores.
D) the predicted Y score.
A) the sum of the conditional Y scores.
B) the standard deviation of the conditional Y scores.
C) the mean of the conditional Y scores.
D) the predicted Y score.
فتح الحزمة
افتح القفل للوصول البطاقات البالغ عددها 37 في هذه المجموعة.
فتح الحزمة
k this deck
25
One important limitation of the study of poverty and crime reported in the text is that________.
A) the variables were nominal.
B) the sample was non-random.
C) prediction is not the same thing as association.
D) correlation is not the same thing as causation.
A) the variables were nominal.
B) the sample was non-random.
C) prediction is not the same thing as association.
D) correlation is not the same thing as causation.
فتح الحزمة
افتح القفل للوصول البطاقات البالغ عددها 37 في هذه المجموعة.
فتح الحزمة
k this deck
26
A researcher reports a Pearson r of .57 between gender (female = 0, males = 1) and involvement in juvenile delinquency. Which of the following is an appropriate interpretation?
A) Females are more delinquent.
B) There is no relationship between the variables.
C) Delinquency increases as gender "increases."
D) Only males were delinquent.
A) Females are more delinquent.
B) There is no relationship between the variables.
C) Delinquency increases as gender "increases."
D) Only males were delinquent.
فتح الحزمة
افتح القفل للوصول البطاقات البالغ عددها 37 في هذه المجموعة.
فتح الحزمة
k this deck
27
Scatterplots give information about the _____________ of a relationship.
A) strength
B) direction
C) linearity
D) All of the answer choices
A) strength
B) direction
C) linearity
D) All of the answer choices
فتح الحزمة
افتح القفل للوصول البطاقات البالغ عددها 37 في هذه المجموعة.
فتح الحزمة
k this deck
28
Dummy variables make it possible to include ________ in regression analysis.
A) nominal variables
B) variables measuring intelligence
C) interval-ratio variables
D) variables with more than two scores
A) nominal variables
B) variables measuring intelligence
C) interval-ratio variables
D) variables with more than two scores
فتح الحزمة
افتح القفل للوصول البطاقات البالغ عددها 37 في هذه المجموعة.
فتح الحزمة
k this deck
29
In addition to random sampling, interval-ratio level of measurement, and a normal sampling distribution, model assumptions for testing Pearson's r for significance include________.
A) bivariate normal distributions.
B) a linear relationship.
C) uniformity in the variance of the Y scores around the regression line for all values of X.
D) All of the answer choices
A) bivariate normal distributions.
B) a linear relationship.
C) uniformity in the variance of the Y scores around the regression line for all values of X.
D) All of the answer choices
فتح الحزمة
افتح القفل للوصول البطاقات البالغ عددها 37 في هذه المجموعة.
فتح الحزمة
k this deck
30
If we fail to reject the null hypothesis in a test of significance for a Pearson's r, we conclude that________.
A) there is a negative association between the variables.
B) no inference can be made about the relationship of the two variables in the population.
C) the relationship exists but its direction and strength are unknown.
D) the variables are related in the population.
A) there is a negative association between the variables.
B) no inference can be made about the relationship of the two variables in the population.
C) the relationship exists but its direction and strength are unknown.
D) the variables are related in the population.
فتح الحزمة
افتح القفل للوصول البطاقات البالغ عددها 37 في هذه المجموعة.
فتح الحزمة
k this deck
31
If a line is drawn through the conditional means of Y, the line will________.
A) always be perfectly linear.
B) rarely be a perfectly straight line.
C) always be parallel to the horizontal axis.
D) always be parallel to the vertical axis.
A) always be perfectly linear.
B) rarely be a perfectly straight line.
C) always be parallel to the horizontal axis.
D) always be parallel to the vertical axis.
فتح الحزمة
افتح القفل للوصول البطاقات البالغ عددها 37 في هذه المجموعة.
فتح الحزمة
k this deck
32
The text reported information about the relationship between homicide and poverty. The sample used was________.
A) 1000 randomly selected Americans.
B) a group of inmates from a federal penitentiary.
C) a large group of high school students.
D) the fifty states.
A) 1000 randomly selected Americans.
B) a group of inmates from a federal penitentiary.
C) a large group of high school students.
D) the fifty states.
فتح الحزمة
افتح القفل للوصول البطاقات البالغ عددها 37 في هذه المجموعة.
فتح الحزمة
k this deck
33
In the study reported in the text, the Pearson's r between the measures of poverty and homicide was 0.57. Which of the following is a reasonable interpretation of this result?
A) Poverty causes homicide.
B) Homicide causes poverty.
C) As poverty increases, homicide decreases.
D) There is a moderate, positive correlation between homicide and poverty.
A) Poverty causes homicide.
B) Homicide causes poverty.
C) As poverty increases, homicide decreases.
D) There is a moderate, positive correlation between homicide and poverty.
فتح الحزمة
افتح القفل للوصول البطاقات البالغ عددها 37 في هذه المجموعة.
فتح الحزمة
k this deck
34
A perfect association between variables can be seen on a scatterplot when________.
A) all dots lie an equal distance from the regression line.
B) all dots lie on the regression line.
C) the regression line forms a right angle at its intersection with the X axis.
D) the regression line is parallel to the X axis.
A) all dots lie an equal distance from the regression line.
B) all dots lie on the regression line.
C) the regression line forms a right angle at its intersection with the X axis.
D) the regression line is parallel to the X axis.
فتح الحزمة
افتح القفل للوصول البطاقات البالغ عددها 37 في هذه المجموعة.
فتح الحزمة
k this deck
35
The direction of a relationship between variables can be detected on a scatterplot by considering the angle of the regression line. The relationship is________.
A) positive when the line slopes upward from left to right.
B) positive when the line slopes downward from left to right.
C) negative when the line slopes upward from left to right.
D) negative when the line slopes downward from right to left.
A) positive when the line slopes upward from left to right.
B) positive when the line slopes downward from left to right.
C) negative when the line slopes upward from left to right.
D) negative when the line slopes downward from right to left.
فتح الحزمة
افتح القفل للوصول البطاقات البالغ عددها 37 في هذه المجموعة.
فتح الحزمة
k this deck
36
In regression analysis, the symbol "a" stands for________.
A) the scores on the Y variable.
B) the slope.
C) the Y intercept.
D) the X intercept.
A) the scores on the Y variable.
B) the slope.
C) the Y intercept.
D) the X intercept.
فتح الحزمة
افتح القفل للوصول البطاقات البالغ عددها 37 في هذه المجموعة.
فتح الحزمة
k this deck
37
The Y intercept is the point where________.
A) the horizontal axis connects to the vertical axis.
B) the regression line crosses the horizontal axis of the scattergram.
C) the regression line meets the conditional mean of Y.
D) the regression line crosses the vertical axis of the scattergram.
A) the horizontal axis connects to the vertical axis.
B) the regression line crosses the horizontal axis of the scattergram.
C) the regression line meets the conditional mean of Y.
D) the regression line crosses the vertical axis of the scattergram.
فتح الحزمة
افتح القفل للوصول البطاقات البالغ عددها 37 في هذه المجموعة.
فتح الحزمة
k this deck
فتح الحزمة
افتح القفل للوصول البطاقات البالغ عددها 37 في هذه المجموعة.


