Deck 3: Displaying Data
ملء الشاشة (f)
سؤال
سؤال
سؤال
سؤال
سؤال
سؤال
سؤال
سؤال
Assume that we had the following set of data:

T hese data would most likely be characterized as
A) positively skewed.
B) normal.
C) negatively skewed.
D) uniformly distributed.
T hese data would most likely be characterized as
A) positively skewed.
B) normal.
C) negatively skewed.
D) uniformly distributed.
سؤال
سؤال
The following graphic is adapted from one in Wainer (1984), plotting the number of private and public elementary schools (in thousands) in the U.S. between 1930 and 1970. Wainer was presenting it as a bad example, and I have made it worse. What is bad about this example?
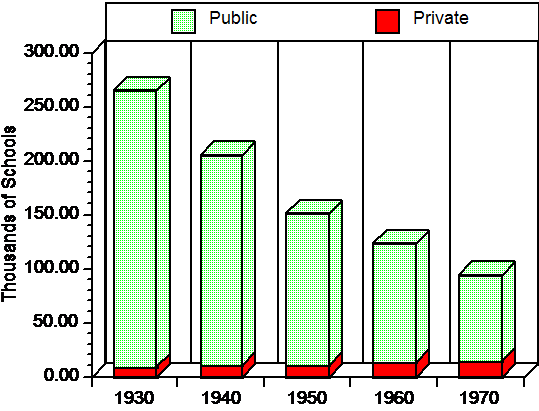
A) The three dimensional effect only makes the graph harder to read.
B) Any change in the number of private schools is difficult to see.
C) The time intervals on the abscissa are too broad.
D) a and b but not c
A) The three dimensional effect only makes the graph harder to read.
B) Any change in the number of private schools is difficult to see.
C) The time intervals on the abscissa are too broad.
D) a and b but not c
سؤال
سؤال
سؤال
Inglehart (1990) presented data on the mean Satisfaction with Life scores for 24 developed countries. These data follow:
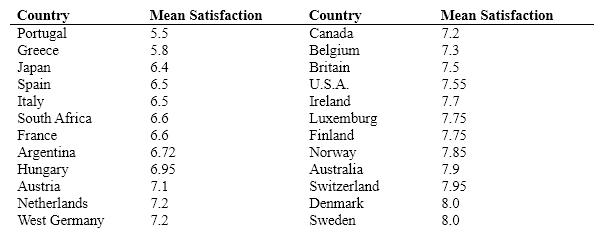
A histogram of these data would be
A) reasonably symmetric.
B) positively skewed.
C) very bimodal.
D) impossible to draw.
A histogram of these data would be
A) reasonably symmetric.
B) positively skewed.
C) very bimodal.
D) impossible to draw.
سؤال
سؤال
سؤال
سؤال
سؤال
سؤال
The Center for Disease Control has published statistics relating maternal smoking to low birth weight. The data follow in terms of the percentage of birth weights
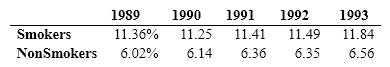
Which of the following ways of presenting the data would be most informative?
A) a histogram
B) a time series graph with a line for smokers and one for non-smokers
C) two pie charts
D) a stem-and-leaf display
Which of the following ways of presenting the data would be most informative?
A) a histogram
B) a time series graph with a line for smokers and one for non-smokers
C) two pie charts
D) a stem-and-leaf display
سؤال
سؤال
سؤال
سؤال
سؤال
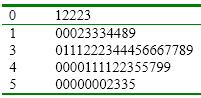
The following is a frequency distribution.
سؤال
سؤال
سؤال
سؤال
سؤال
سؤال
سؤال
سؤال
سؤال
سؤال
سؤال
سؤال
A data set of test scores consisted of the following:
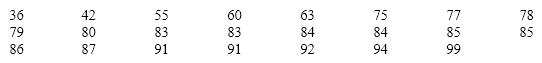
On a stem-and-leaf display, the values of the tens digits (3 - 9) are
A) the trailing digits.
B) the leaves.
C) the less significant digits.
D) the stems.
On a stem-and-leaf display, the values of the tens digits (3 - 9) are
A) the trailing digits.
B) the leaves.
C) the less significant digits.
D) the stems.
سؤال
سؤال
سؤال
سؤال
سؤال
سؤال
The next six questions are based on the following data. 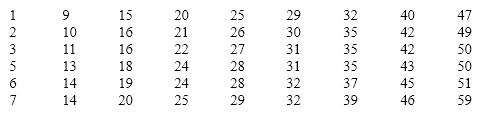
Create a frequency distribution for these data.
Create a frequency distribution for these data.
سؤال
The next six questions are based on the following data.
Create a stem and leaf plot for these data.
Create a stem and leaf plot for these data.
سؤال
سؤال
سؤال
The next six questions are based on the following data.
Which graphical technique do you think displays the data least effectively? Why?
Which graphical technique do you think displays the data least effectively? Why?
سؤال
سؤال
The next six questions are based on the following data.
Where do the data tend to cluster?
Where do the data tend to cluster?
سؤال
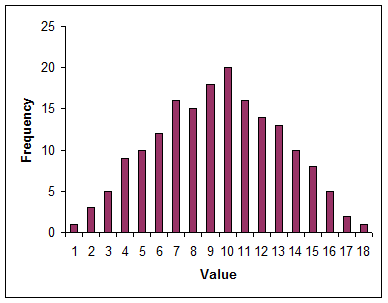
Answer the following questions based on the graph below.
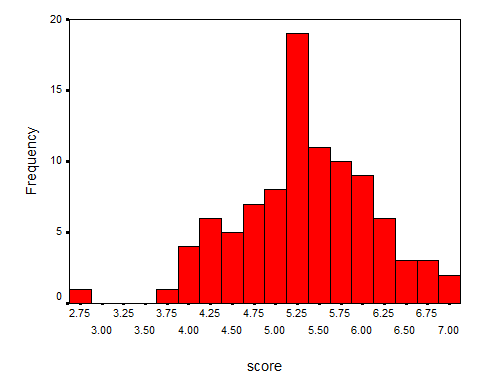
a. Is the graph symmetrical?
b. Is the graph unimodal or bimodal?
c. Do the data appear skewed? If so, positively or negatively?
d. Do there appear to be outliers? If so, for what values?
a. Is the graph symmetrical?
b. Is the graph unimodal or bimodal?
c. Do the data appear skewed? If so, positively or negatively?
d. Do there appear to be outliers? If so, for what values?
سؤال
The next six questions are based on the following data.
Is the distribution symmetrical?
Is the distribution symmetrical?
سؤال
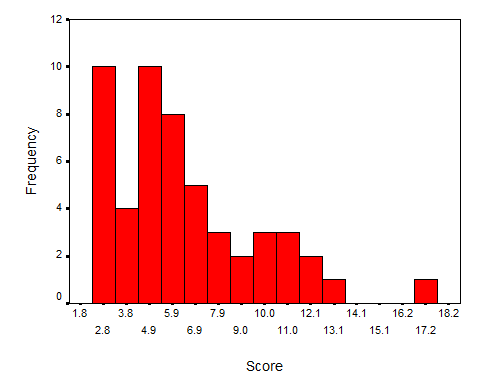
Answer the following questions based on the graph below.
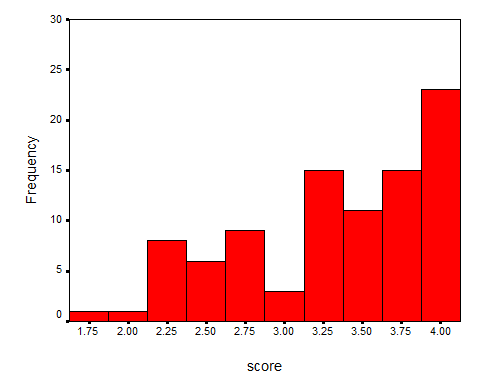
a. Is the graph symmetrical?
b. Is the graph unimodal or bimodal?
c. Do the data appear skewed? If so, positively or negatively?
d. Do there appear to be outliers? If so, for what values?
a. Is the graph symmetrical?
b. Is the graph unimodal or bimodal?
c. Do the data appear skewed? If so, positively or negatively?
d. Do there appear to be outliers? If so, for what values?
سؤال
سؤال
The following graph is unimodal.
سؤال
سؤال
سؤال
Use two terms to describe the following data.
سؤال
The next six questions are based on the following data.
Create a histogram for these data using an interval of 5 (e.g., 0 to 5, 6 to 10).
Create a histogram for these data using an interval of 5 (e.g., 0 to 5, 6 to 10).

فتح الحزمة
قم بالتسجيل لفتح البطاقات في هذه المجموعة!
Unlock Deck
Unlock Deck
1/57
العب
ملء الشاشة (f)
Deck 3: Displaying Data
1
Outliers are
A) extreme or unusual values.
B) the lowest value in a data set.
C) the lowest and highest scores in a data set.
D) all of the above
A) extreme or unusual values.
B) the lowest value in a data set.
C) the lowest and highest scores in a data set.
D) all of the above
extreme or unusual values.
2
A stem-and-leaf display is often
A) a simplified representation of the underlying data.
B) a quick way to draw a histogram.
C) more informative than the corresponding histogram.
D) all of the above
A) a simplified representation of the underlying data.
B) a quick way to draw a histogram.
C) more informative than the corresponding histogram.
D) all of the above
all of the above
3
The data in the previous question show a much higher incidence of low birth weight babies from mothers who smoke. This finding is likely to be a reliable one because
A) everyone knows that smoking is a bad thing.
B) the smokers rate of low birth weight is twice that of the non-smokers.
C) the pattern of differences occurs reliably over each of 5 years.
D) there is a general increase in low birth weight over the years.
A) everyone knows that smoking is a bad thing.
B) the smokers rate of low birth weight is twice that of the non-smokers.
C) the pattern of differences occurs reliably over each of 5 years.
D) there is a general increase in low birth weight over the years.
the pattern of differences occurs reliably over each of 5 years.
4
Assume that you have a set of data with 70 values spread fairly evenly between 0 and 100. The optimal number of categories for a histogram of these data would be approximately
A) 4
B) 10
C) 25
D) 50
A) 4
B) 10
C) 25
D) 50
فتح الحزمة
افتح القفل للوصول البطاقات البالغ عددها 57 في هذه المجموعة.
فتح الحزمة
k this deck
5
In the text there was a stem-and-leaf display showing the performance of students who attended class regularly and those who often skipped class. This display illustrated
A) that poor attendees did more poorly than good attendees.
B) the shape of the two distributions.
C) the dispersion of the two distributions.
D) all of the above
A) that poor attendees did more poorly than good attendees.
B) the shape of the two distributions.
C) the dispersion of the two distributions.
D) all of the above
فتح الحزمة
افتح القفل للوصول البطاقات البالغ عددها 57 في هذه المجموعة.
فتح الحزمة
k this deck
6
Someone asks you if you have seen the movie Titanic . Before you answer, you look back into your memory for all of the movies you have ever seen and review the titles one at a time. This is an example of
A) parallel processing
B) frequent processing
C) sequential processing
D) sensory memory
A) parallel processing
B) frequent processing
C) sequential processing
D) sensory memory
فتح الحزمة
افتح القفل للوصول البطاقات البالغ عددها 57 في هذه المجموعة.
فتح الحزمة
k this deck
7
Which of the following is the least important characteristic of graphics?
A) clarity
B) beauty
C) simplicity
D) neatness
A) clarity
B) beauty
C) simplicity
D) neatness
فتح الحزمة
افتح القفل للوصول البطاقات البالغ عددها 57 في هذه المجموعة.
فتح الحزمة
k this deck
8
Assume that we had the following set of data:
T hese data would most likely be characterized as
A) positively skewed.
B) normal.
C) negatively skewed.
D) uniformly distributed.
T hese data would most likely be characterized as
A) positively skewed.
B) normal.
C) negatively skewed.
D) uniformly distributed.
فتح الحزمة
افتح القفل للوصول البطاقات البالغ عددها 57 في هذه المجموعة.
فتح الحزمة
k this deck
9
If you created a stem-and-leaf display of the math SAT scores of all entering students in a large Midwestern state university, the leaves would most likely be
A) the numbers 2 through 8.
B) the numbers 0 through 9 (with code |6|5 = 650).
C) t, f, c.
D) the symbols * and .
A) the numbers 2 through 8.
B) the numbers 0 through 9 (with code |6|5 = 650).
C) t, f, c.
D) the symbols * and .
فتح الحزمة
افتح القفل للوصول البطاقات البالغ عددها 57 في هذه المجموعة.
فتح الحزمة
k this deck
10
The following graphic is adapted from one in Wainer (1984), plotting the number of private and public elementary schools (in thousands) in the U.S. between 1930 and 1970. Wainer was presenting it as a bad example, and I have made it worse. What is bad about this example?
A) The three dimensional effect only makes the graph harder to read.
B) Any change in the number of private schools is difficult to see.
C) The time intervals on the abscissa are too broad.
D) a and b but not c
A) The three dimensional effect only makes the graph harder to read.
B) Any change in the number of private schools is difficult to see.
C) The time intervals on the abscissa are too broad.
D) a and b but not c
فتح الحزمة
افتح القفل للوصول البطاقات البالغ عددها 57 في هذه المجموعة.
فتح الحزمة
k this deck
11
The "real lower limit" of an interval in a histogram is
A) the lowest integer value for scores in that interval.
B) the midpoint of the interval.
C) the lowest continuous value that would be rounded up into that interval.
D) the smallest width of the interval.
A) the lowest integer value for scores in that interval.
B) the midpoint of the interval.
C) the lowest continuous value that would be rounded up into that interval.
D) the smallest width of the interval.
فتح الحزمة
افتح القفل للوصول البطاقات البالغ عددها 57 في هذه المجموعة.
فتح الحزمة
k this deck
12
If you created a stem-and-leaf display of the math SAT scores of all entering students in a large Midwestern state university, the stem would best be
A) the numbers 0 through 10.
B) the numbers 200 through 800.
C) the numbers 2 through 8.
D) it is impossible to tell
A) the numbers 0 through 10.
B) the numbers 200 through 800.
C) the numbers 2 through 8.
D) it is impossible to tell
فتح الحزمة
افتح القفل للوصول البطاقات البالغ عددها 57 في هذه المجموعة.
فتح الحزمة
k this deck
13
Inglehart (1990) presented data on the mean Satisfaction with Life scores for 24 developed countries. These data follow:
A histogram of these data would be
A) reasonably symmetric.
B) positively skewed.
C) very bimodal.
D) impossible to draw.
A histogram of these data would be
A) reasonably symmetric.
B) positively skewed.
C) very bimodal.
D) impossible to draw.
فتح الحزمة
افتح القفل للوصول البطاقات البالغ عددها 57 في هذه المجموعة.
فتح الحزمة
k this deck
14
On October 25, 1978 the Washington Post presented a graphic showing the declining purchasing power of the U.S. dollar. What was worth $1 in 1958 was worth only $0.44 in 1978. They illustrated the decline in value by showing a dollar that was 3 inches by 1 inch in 1959, and one that was 1.32 inches (44% of 3 inches) by .44 inches in 1978. What is wrong with this kind of a display?
A) You can't equate dollars in 1958 with dollars in 1978.
B) The dollar actually increased in purchasing power over that period of time.
C) There is nothing wrong with doing this.
D) The area of the dollar is reduced by more than .44%.
A) You can't equate dollars in 1958 with dollars in 1978.
B) The dollar actually increased in purchasing power over that period of time.
C) There is nothing wrong with doing this.
D) The area of the dollar is reduced by more than .44%.
فتح الحزمة
افتح القفل للوصول البطاقات البالغ عددها 57 في هذه المجموعة.
فتح الحزمة
k this deck
15
"5s" represents what numbers on a stem-and-leaf display according to Tukey?
A) 50-51
B) 52-53
C) 54-55
D) 56-57
A) 50-51
B) 52-53
C) 54-55
D) 56-57
فتح الحزمة
افتح القفل للوصول البطاقات البالغ عددها 57 في هذه المجموعة.
فتح الحزمة
k this deck
16
Frequency distributions are used
A) as a first step in examining data.
B) as a screening device to identify questionable values.
C) to organize data.
D) all of the above
A) as a first step in examining data.
B) as a screening device to identify questionable values.
C) to organize data.
D) all of the above
فتح الحزمة
افتح القفل للوصول البطاقات البالغ عددها 57 في هذه المجموعة.
فتح الحزمة
k this deck
17
On a recent fundraising drive, most of the 30 volunteers raised between $10 and $50 each. However, Brian and Karen each raised over $100. Which of the following is true?
A) The amounts of money raised by Brian and Karen are outliers.
B) The data would best be represented three-dimensionally.
C) The data appear negatively skewed.
D) The data should be represented on a back-to-back stem-and-leaf display.
A) The amounts of money raised by Brian and Karen are outliers.
B) The data would best be represented three-dimensionally.
C) The data appear negatively skewed.
D) The data should be represented on a back-to-back stem-and-leaf display.
فتح الحزمة
افتح القفل للوصول البطاقات البالغ عددها 57 في هذه المجموعة.
فتح الحزمة
k this deck
18
For the data referred to in the previous question, the distribution would best be called
A) bimodal.
B) unimodal.
C) symmetric.
D) balanced.
A) bimodal.
B) unimodal.
C) symmetric.
D) balanced.
فتح الحزمة
افتح القفل للوصول البطاقات البالغ عددها 57 في هذه المجموعة.
فتح الحزمة
k this deck
19
The Center for Disease Control has published statistics relating maternal smoking to low birth weight. The data follow in terms of the percentage of birth weights
Which of the following ways of presenting the data would be most informative?
A) a histogram
B) a time series graph with a line for smokers and one for non-smokers
C) two pie charts
D) a stem-and-leaf display
Which of the following ways of presenting the data would be most informative?
A) a histogram
B) a time series graph with a line for smokers and one for non-smokers
C) two pie charts
D) a stem-and-leaf display
فتح الحزمة
افتح القفل للوصول البطاقات البالغ عددها 57 في هذه المجموعة.
فتح الحزمة
k this deck
20
When we plot a histogram, the values on the X axis are
A) the real lower limits and real upper limits
B) the midpoints
C) the integers closest to the boundaries.
D) any of the above, depending on what makes the most sense at the time
A) the real lower limits and real upper limits
B) the midpoints
C) the integers closest to the boundaries.
D) any of the above, depending on what makes the most sense at the time
فتح الحزمة
افتح القفل للوصول البطاقات البالغ عددها 57 في هذه المجموعة.
فتح الحزمة
k this deck
21
Displaying data on graphs
A) can aid communication of results to an audience.
B) can organize data in logical order.
C) can be done with computers.
D) all of the above
A) can aid communication of results to an audience.
B) can organize data in logical order.
C) can be done with computers.
D) all of the above
فتح الحزمة
افتح القفل للوصول البطاقات البالغ عددها 57 في هذه المجموعة.
فتح الحزمة
k this deck
22
In deciding on the number of stems to use in a stem and leaf display,
A) you should always break the stems into 5 stems per every 10 units.
B) you should normally make all of the stems the same width.
C) you should generally use 10 stems in all.
D) you should disregard the frequencies of the data.
A) you should always break the stems into 5 stems per every 10 units.
B) you should normally make all of the stems the same width.
C) you should generally use 10 stems in all.
D) you should disregard the frequencies of the data.
فتح الحزمة
افتح القفل للوصول البطاقات البالغ عددها 57 في هذه المجموعة.
فتح الحزمة
k this deck
23
The real lower limit and the real upper limit of the interval 40-49 are
A) 39.5 and 49.5.
B) 40 and 49.
C) 40 and 50.
D) 39 and 50.
A) 39.5 and 49.5.
B) 40 and 49.
C) 40 and 50.
D) 39 and 50.
فتح الحزمة
افتح القفل للوصول البطاقات البالغ عددها 57 في هذه المجموعة.
فتح الحزمة
k this deck
24
The following is a frequency distribution.
فتح الحزمة
افتح القفل للوصول البطاقات البالغ عددها 57 في هذه المجموعة.
فتح الحزمة
k this deck
25
Boxplots are graphical displays that
A) emphasize the basic characteristics of the data.
B) focus on the median and spread of the data.
C) allow us to visually see how two or more distributions compare.
D) all of the above
A) emphasize the basic characteristics of the data.
B) focus on the median and spread of the data.
C) allow us to visually see how two or more distributions compare.
D) all of the above
فتح الحزمة
افتح القفل للوصول البطاقات البالغ عددها 57 في هذه المجموعة.
فتح الحزمة
k this deck
26
Which of the following distributions can be symmetric?
A) unimodal
B) bimodal
C) normal
D) all of the above
A) unimodal
B) bimodal
C) normal
D) all of the above
فتح الحزمة
افتح القفل للوصول البطاقات البالغ عددها 57 في هذه المجموعة.
فتح الحزمة
k this deck
27
A normal distribution must
A) have outliers.
B) be symmetric.
C) be positively skewed.
D) be negatively skewed.
A) have outliers.
B) be symmetric.
C) be positively skewed.
D) be negatively skewed.
فتح الحزمة
افتح القفل للوصول البطاقات البالغ عددها 57 في هذه المجموعة.
فتح الحزمة
k this deck
28
To get an accurate idea about the shape of a distribution,
A) relatively large samples of data are needed.
B) computer programs are needed.
C) three-dimensional plots are usually helpful.
D) stem-and-leaf displays are the only accurate methods of presentation.
A) relatively large samples of data are needed.
B) computer programs are needed.
C) three-dimensional plots are usually helpful.
D) stem-and-leaf displays are the only accurate methods of presentation.
فتح الحزمة
افتح القفل للوصول البطاقات البالغ عددها 57 في هذه المجموعة.
فتح الحزمة
k this deck
29
Kurtosis is
A) the constant in the midpoint equation when graphing histograms.
B) a little-used measure of the shape of a distribution.
C) a computer graphics program.
D) a disease common to people named Kurt.
A) the constant in the midpoint equation when graphing histograms.
B) a little-used measure of the shape of a distribution.
C) a computer graphics program.
D) a disease common to people named Kurt.
فتح الحزمة
افتح القفل للوصول البطاقات البالغ عددها 57 في هذه المجموعة.
فتح الحزمة
k this deck
30
If the distribution of the ages of people were positively skewed, which of the following is most likely correct?
A) There are about the same number of young people as old people.
B) There are more young people than old people.
C) There are more old people than young people.
D) none of the above
A) There are about the same number of young people as old people.
B) There are more young people than old people.
C) There are more old people than young people.
D) none of the above
فتح الحزمة
افتح القفل للوصول البطاقات البالغ عددها 57 في هذه المجموعة.
فتح الحزمة
k this deck
31
The onset of eating disorders was shown to occur most often during puberty and during the late teen years in girls. A distribution of the frequencies of onset of eating disorders by age would most likely be
A) unimodal.
B) normal.
C) bimodal.
D) all of the above
A) unimodal.
B) normal.
C) bimodal.
D) all of the above
فتح الحزمة
افتح القفل للوصول البطاقات البالغ عددها 57 في هذه المجموعة.
فتح الحزمة
k this deck
32
In the above data set, the outliers would most likely be
A) 94 and 99.
B) 36 and 99.
C) 36 and 42.
D) There are no outliers.
A) 94 and 99.
B) 36 and 99.
C) 36 and 42.
D) There are no outliers.
فتح الحزمة
افتح القفل للوصول البطاقات البالغ عددها 57 في هذه المجموعة.
فتح الحزمة
k this deck
33
Given the following numbers, 10, 25, 37, and 40, the leading digits are 1, 2, 3, and 4.
فتح الحزمة
افتح القفل للوصول البطاقات البالغ عددها 57 في هذه المجموعة.
فتح الحزمة
k this deck
34
A negatively skewed distribution
A) has a tail pointing to the left.
B) has a tail pointing to the right.
C) is symmetric.
D) is also positively skewed.
A) has a tail pointing to the left.
B) has a tail pointing to the right.
C) is symmetric.
D) is also positively skewed.
فتح الحزمة
افتح القفل للوصول البطاقات البالغ عددها 57 في هذه المجموعة.
فتح الحزمة
k this deck
35
In making plots of data, which of the following rules is true?
A) Three-dimensional plots should never be used.
B) Rules of graphical presentation are prescriptive and should never be broken.
C) The ultimate goal in making plots is to make data attractive.
D) The point of representing data graphically is better communication.
A) Three-dimensional plots should never be used.
B) Rules of graphical presentation are prescriptive and should never be broken.
C) The ultimate goal in making plots is to make data attractive.
D) The point of representing data graphically is better communication.
فتح الحزمة
افتح القفل للوصول البطاقات البالغ عددها 57 في هذه المجموعة.
فتح الحزمة
k this deck
36
A data set of test scores consisted of the following:
On a stem-and-leaf display, the values of the tens digits (3 - 9) are
A) the trailing digits.
B) the leaves.
C) the less significant digits.
D) the stems.
On a stem-and-leaf display, the values of the tens digits (3 - 9) are
A) the trailing digits.
B) the leaves.
C) the less significant digits.
D) the stems.
فتح الحزمة
افتح القفل للوصول البطاقات البالغ عددها 57 في هذه المجموعة.
فتح الحزمة
k this deck
37
Assume that you have a set of data with 70 values spread fairly evenly between 0 and 100. The optimal number of categories for a histogram of these data would be approximately
A) 4
B) 50
C) 10
D) 25
A) 4
B) 50
C) 10
D) 25
فتح الحزمة
افتح القفل للوصول البطاقات البالغ عددها 57 في هذه المجموعة.
فتح الحزمة
k this deck
38
The leading digits are the leaves in a stem and leaf plot.
فتح الحزمة
افتح القفل للوصول البطاقات البالغ عددها 57 في هذه المجموعة.
فتح الحزمة
k this deck
39
The above data set appears
A) positively skewed.
B) negatively skewed.
C) normally distributed.
D) bimodal.
A) positively skewed.
B) negatively skewed.
C) normally distributed.
D) bimodal.
فتح الحزمة
افتح القفل للوصول البطاقات البالغ عددها 57 في هذه المجموعة.
فتح الحزمة
k this deck
40
A frequency distribution
A) displays the average of each score received.
B) offers no more information than a collection of raw data.
C) counts the number of times each score is received.
D) does none of the above.
A) displays the average of each score received.
B) offers no more information than a collection of raw data.
C) counts the number of times each score is received.
D) does none of the above.
فتح الحزمة
افتح القفل للوصول البطاقات البالغ عددها 57 في هذه المجموعة.
فتح الحزمة
k this deck
41
When a variable has many values, and each value occurs rarely, a stem-and-leaf plot is preferable to a histogram.
فتح الحزمة
افتح القفل للوصول البطاقات البالغ عددها 57 في هذه المجموعة.
فتح الحزمة
k this deck
42
The next six questions are based on the following data.
Create a frequency distribution for these data.
Create a frequency distribution for these data.
فتح الحزمة
افتح القفل للوصول البطاقات البالغ عددها 57 في هذه المجموعة.
فتح الحزمة
k this deck
43
The next six questions are based on the following data.
Create a stem and leaf plot for these data.
Create a stem and leaf plot for these data.
فتح الحزمة
افتح القفل للوصول البطاقات البالغ عددها 57 في هذه المجموعة.
فتح الحزمة
k this deck
44
The previous graph is symmetrical.
فتح الحزمة
افتح القفل للوصول البطاقات البالغ عددها 57 في هذه المجموعة.
فتح الحزمة
k this deck
45
Skewness refers to how symmetrical or assymetrical a distribution is.
فتح الحزمة
افتح القفل للوصول البطاقات البالغ عددها 57 في هذه المجموعة.
فتح الحزمة
k this deck
46
The next six questions are based on the following data.
Which graphical technique do you think displays the data least effectively? Why?
Which graphical technique do you think displays the data least effectively? Why?
فتح الحزمة
افتح القفل للوصول البطاقات البالغ عددها 57 في هذه المجموعة.
فتح الحزمة
k this deck
47
An outlier refers to data that falls toward the middle of a distribution.
فتح الحزمة
افتح القفل للوصول البطاقات البالغ عددها 57 في هذه المجموعة.
فتح الحزمة
k this deck
48
The next six questions are based on the following data.
Where do the data tend to cluster?
Where do the data tend to cluster?
فتح الحزمة
افتح القفل للوصول البطاقات البالغ عددها 57 في هذه المجموعة.
فتح الحزمة
k this deck
49
Answer the following questions based on the graph below.
a. Is the graph symmetrical?
b. Is the graph unimodal or bimodal?
c. Do the data appear skewed? If so, positively or negatively?
d. Do there appear to be outliers? If so, for what values?
a. Is the graph symmetrical?
b. Is the graph unimodal or bimodal?
c. Do the data appear skewed? If so, positively or negatively?
d. Do there appear to be outliers? If so, for what values?
فتح الحزمة
افتح القفل للوصول البطاقات البالغ عددها 57 في هذه المجموعة.
فتح الحزمة
k this deck
50
The next six questions are based on the following data.
Is the distribution symmetrical?
Is the distribution symmetrical?
فتح الحزمة
افتح القفل للوصول البطاقات البالغ عددها 57 في هذه المجموعة.
فتح الحزمة
k this deck
51
Answer the following questions based on the graph below.
a. Is the graph symmetrical?
b. Is the graph unimodal or bimodal?
c. Do the data appear skewed? If so, positively or negatively?
d. Do there appear to be outliers? If so, for what values?
a. Is the graph symmetrical?
b. Is the graph unimodal or bimodal?
c. Do the data appear skewed? If so, positively or negatively?
d. Do there appear to be outliers? If so, for what values?
فتح الحزمة
افتح القفل للوصول البطاقات البالغ عددها 57 في هذه المجموعة.
فتح الحزمة
k this deck
52
In a frequency distribution, the number of observations that fall within an interval is plotted.
فتح الحزمة
افتح القفل للوصول البطاقات البالغ عددها 57 في هذه المجموعة.
فتح الحزمة
k this deck
53
The following graph is unimodal.
فتح الحزمة
افتح القفل للوصول البطاقات البالغ عددها 57 في هذه المجموعة.
فتح الحزمة
k this deck
54
Draw a distribution that is negatively skewed.
فتح الحزمة
افتح القفل للوصول البطاقات البالغ عددها 57 في هذه المجموعة.
فتح الحزمة
k this deck
55
87 is the midpoint of the interval from 85 to 89.
فتح الحزمة
افتح القفل للوصول البطاقات البالغ عددها 57 في هذه المجموعة.
فتح الحزمة
k this deck
56
Use two terms to describe the following data.
فتح الحزمة
افتح القفل للوصول البطاقات البالغ عددها 57 في هذه المجموعة.
فتح الحزمة
k this deck
57
The next six questions are based on the following data.
Create a histogram for these data using an interval of 5 (e.g., 0 to 5, 6 to 10).
Create a histogram for these data using an interval of 5 (e.g., 0 to 5, 6 to 10).
فتح الحزمة
افتح القفل للوصول البطاقات البالغ عددها 57 في هذه المجموعة.
فتح الحزمة
k this deck
فتح الحزمة
افتح القفل للوصول البطاقات البالغ عددها 57 في هذه المجموعة.


