Deck 6: Enhancing Charts
ملء الشاشة (f)
سؤال

In the figure above, number 2 is pointing to a data label.
سؤال
 In the figure above, the error bars shown identify potential error amounts relative to each data marker in a(n) ____ series.
A) format
B) data
C) information
D) axis
سؤال
سؤال
سؤال
سؤال
سؤال
سؤال
سؤال
سؤال

In the figure above, number 3 is pointing to an error bar.
سؤال

In the figure above, number 1 is pointing to the horizontal axis title.
سؤال
سؤال
سؤال
سؤال
سؤال
سؤال
سؤال
سؤال
سؤال
 In the figure above, ____ identifies the horizontal axis title.
A) 1
B) 2
C) 3
D) 4
سؤال
سؤال
سؤال
سؤال
سؤال
سؤال
سؤال
سؤال
سؤال
سؤال
سؤال
سؤال
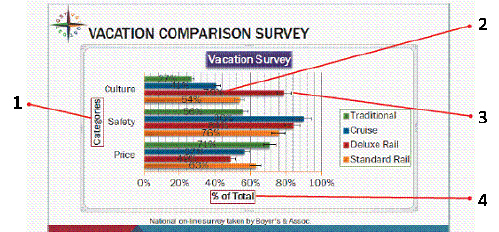
In the figure above, ____ identifies a value axis label.
A) 1
B) 2
C) 3
D) 4
سؤال
سؤال
In the figure above, the words "Vacation Survey" are the ____.
A) chart label
B) chart title
C) data label
D) data series
سؤال
سؤال
سؤال
سؤال
سؤال
In the figure above, ____ identifies a category axis label.
A) 1
B) 2
C) 3
D) 4
سؤال
سؤال
سؤال
سؤال
سؤال
سؤال
سؤال
سؤال
سؤال
سؤال
سؤال
سؤال
سؤال
سؤال
سؤال
سؤال
سؤال
سؤال
سؤال
سؤال
سؤال
سؤال
سؤال
سؤال
Match between columns
سؤال
سؤال
سؤال
سؤال
سؤال

فتح الحزمة
قم بالتسجيل لفتح البطاقات في هذه المجموعة!
Unlock Deck
Unlock Deck
1/68
العب
ملء الشاشة (f)
Deck 6: Enhancing Charts
1
In the figure above, number 2 is pointing to a data label.
True
2
In the figure above, the error bars shown identify potential error amounts relative to each data marker in a(n) ____ series.A) format
B) data
C) information
D) axis
B
3
A pie chart is designed to display data from one data series in proportion to the sum of all of the data series.
True
4
A chart template saves ____.
A) chart type information
B) design theme
C) style information
D) All of the above
A) chart type information
B) design theme
C) style information
D) All of the above
فتح الحزمة
افتح القفل للوصول البطاقات البالغ عددها 68 في هذه المجموعة.
فتح الحزمة
k this deck
5
To open the Research task pane, click the Information button in the Proofing group on the Review tab.
فتح الحزمة
افتح القفل للوصول البطاقات البالغ عددها 68 في هذه المجموعة.
فتح الحزمة
k this deck
6
Slides with relevant graphics have little impact on a typical audience.
فتح الحزمة
افتح القفل للوصول البطاقات البالغ عددها 68 في هذه المجموعة.
فتح الحزمة
k this deck
7
To change slide orientation of the presentation from the Ribbon, click the Slide Orientation button in the Page Setup group on the Format tab.
فتح الحزمة
افتح القفل للوصول البطاقات البالغ عددها 68 في هذه المجموعة.
فتح الحزمة
k this deck
8
If you don't have Excel installed on your computer, PowerPoint uses Microsoft ____ to create charts.
A) Chart
B) Graph
C) Access
D) Worksheet
A) Chart
B) Graph
C) Access
D) Worksheet
فتح الحزمة
افتح القفل للوصول البطاقات البالغ عددها 68 في هذه المجموعة.
فتح الحزمة
k this deck
9
There are two ways to add a chart to a slide: you can embed it or link it.
فتح الحزمة
افتح القفل للوصول البطاقات البالغ عددها 68 في هذه المجموعة.
فتح الحزمة
k this deck
10
In the figure above, number 3 is pointing to an error bar.
فتح الحزمة
افتح القفل للوصول البطاقات البالغ عددها 68 في هذه المجموعة.
فتح الحزمة
k this deck
11
In the figure above, number 1 is pointing to the horizontal axis title.
فتح الحزمة
افتح القفل للوصول البطاقات البالغ عددها 68 في هذه المجموعة.
فتح الحزمة
k this deck
12
The most effective way to show numerical data is to show the data in a table.
فتح الحزمة
افتح القفل للوصول البطاقات البالغ عددها 68 في هذه المجموعة.
فتح الحزمة
k this deck
13
Themes and theme effects are alike for all Office programs
فتح الحزمة
افتح القفل للوصول البطاقات البالغ عددها 68 في هذه المجموعة.
فتح الحزمة
k this deck
14
____ are small lines of measurement that intersect an axis and identify the categories, values, or series in a chart.
A) Error bars
B) Trendlines
C) Tick marks
D) Axis lines
A) Error bars
B) Trendlines
C) Tick marks
D) Axis lines
فتح الحزمة
افتح القفل للوصول البطاقات البالغ عددها 68 في هذه المجموعة.
فتح الحزمة
k this deck
15
The orientation setting for the slides is the same as the orientation setting for the notes, handouts, and outline.
فتح الحزمة
افتح القفل للوصول البطاقات البالغ عددها 68 في هذه المجموعة.
فتح الحزمة
k this deck
16
PowerPoint uses Graph by default to create charts in a presentation.
فتح الحزمة
افتح القفل للوصول البطاقات البالغ عددها 68 في هذه المجموعة.
فتح الحزمة
k this deck
17
If you create a customized chart that you want to reuse, you can save it as a template (*.crtx) to the Charts Template folder.
فتح الحزمة
افتح القفل للوصول البطاقات البالغ عددها 68 في هذه المجموعة.
فتح الحزمة
k this deck
18
A PowerPoint presentation is primarily a visual communication tool.
فتح الحزمة
افتح القفل للوصول البطاقات البالغ عددها 68 في هذه المجموعة.
فتح الحزمة
k this deck
19
A chart theme specifies where chart elements, such as axes titles, data labels, and the legend, are displayed within the chart area.
فتح الحزمة
افتح القفل للوصول البطاقات البالغ عددها 68 في هذه المجموعة.
فتح الحزمة
k this deck
20
In the figure above, ____ identifies the horizontal axis title.A) 1
B) 2
C) 3
D) 4
فتح الحزمة
افتح القفل للوصول البطاقات البالغ عددها 68 في هذه المجموعة.
فتح الحزمة
k this deck
21
To change PowerPoint settings, click the ____ tab on the Ribbon, then click Options to open the PowerPoint Options dialog box.
A) Home
B) File
C) Format
D) Design
A) Home
B) File
C) Format
D) Design
فتح الحزمة
افتح القفل للوصول البطاقات البالغ عددها 68 في هذه المجموعة.
فتح الحزمة
k this deck
22
The object you create with the source program is saved to a file called the ____.
A) destination file
B) linked file
C) source file
D) fixed layout file
A) destination file
B) linked file
C) source file
D) fixed layout file
فتح الحزمة
افتح القفل للوصول البطاقات البالغ عددها 68 في هذه المجموعة.
فتح الحزمة
k this deck
23
When adjusting the space between data series markers, a negative number ____.
A) moves the data markers down in the plot area
B) adds space between the data markers
C) moves the data markers to the right in the plot area
D) overlaps the data markers
A) moves the data markers down in the plot area
B) adds space between the data markers
C) moves the data markers to the right in the plot area
D) overlaps the data markers
فتح الحزمة
افتح القفل للوصول البطاقات البالغ عددها 68 في هذه المجموعة.
فتح الحزمة
k this deck
24
A link is a ____.
A) connection between a source file and a destination file
B) connection between an embedded object and a source file
C) picture that is pasted to a slide
D) chart created using Microsoft Graph
A) connection between a source file and a destination file
B) connection between an embedded object and a source file
C) picture that is pasted to a slide
D) chart created using Microsoft Graph
فتح الحزمة
افتح القفل للوصول البطاقات البالغ عددها 68 في هذه المجموعة.
فتح الحزمة
k this deck
25
You can enter a value from ____ percent to 100 percent in the Series Overlap text box.
A) -100
B) -10
C) 0
D) 50
A) -100
B) -10
C) 0
D) 50
فتح الحزمة
افتح القفل للوصول البطاقات البالغ عددها 68 في هذه المجموعة.
فتح الحزمة
k this deck
26
When you click one of the numbers on the value axis, ____.
A) the number is highlighted
B) the entire axis is selected
C) a format dialog box opens
D) the plot area is selected
A) the number is highlighted
B) the entire axis is selected
C) a format dialog box opens
D) the plot area is selected
فتح الحزمة
افتح القفل للوصول البطاقات البالغ عددها 68 في هذه المجموعة.
فتح الحزمة
k this deck
27
The program used to create an embedded object is called the ____.
A) source program
B) embedded program
C) destination program
D) linked program
A) source program
B) embedded program
C) destination program
D) linked program
فتح الحزمة
افتح القفل للوصول البطاقات البالغ عددها 68 في هذه المجموعة.
فتح الحزمة
k this deck
28
When adjusting the space between data series markers, a positive number ____.
A) moves the data markers up in the plot area
B) adds space between the data markers
C) moves the data markers to the left in the plot area
D) overlaps the data markers
A) moves the data markers up in the plot area
B) adds space between the data markers
C) moves the data markers to the left in the plot area
D) overlaps the data markers
فتح الحزمة
افتح القفل للوصول البطاقات البالغ عددها 68 في هذه المجموعة.
فتح الحزمة
k this deck
29
Major ____ identify major units on the axis and are usually identified by a tick mark.
A) axis
B) labels
C) borders
D) gridlines
A) axis
B) labels
C) borders
D) gridlines
فتح الحزمة
افتح القفل للوصول البطاقات البالغ عددها 68 في هذه المجموعة.
فتح الحزمة
k this deck
30
To change the space between data series markers in the chart, ____.
A) adjust the number in the Series Overlap text box
B) drag a data series marker left or right
C) change the width of the data series marker outline
D) modify the data series marker formula
A) adjust the number in the Series Overlap text box
B) drag a data series marker left or right
C) change the width of the data series marker outline
D) modify the data series marker formula
فتح الحزمة
افتح القفل للوصول البطاقات البالغ عددها 68 في هذه المجموعة.
فتح الحزمة
k this deck
31
You have ____ options for individually animating data markers.
A) one
B) two
C) three
D) four
A) one
B) two
C) three
D) four
فتح الحزمة
افتح القفل للوصول البطاقات البالغ عددها 68 في هذه المجموعة.
فتح الحزمة
k this deck
32
In the figure above, ____ identifies a value axis label.
A) 1
B) 2
C) 3
D) 4
فتح الحزمة
افتح القفل للوصول البطاقات البالغ عددها 68 في هذه المجموعة.
فتح الحزمة
k this deck
33
A destination file is ____.
A) the file that is saved by a source program when creating an embedded object
B) another type of source file
C) a linked object
D) the file, such as a presentation file, where an object is embedded
A) the file that is saved by a source program when creating an embedded object
B) another type of source file
C) a linked object
D) the file, such as a presentation file, where an object is embedded
فتح الحزمة
افتح القفل للوصول البطاقات البالغ عددها 68 في هذه المجموعة.
فتح الحزمة
k this deck
34
In the figure above, the words "Vacation Survey" are the ____.
A) chart label
B) chart title
C) data label
D) data series
فتح الحزمة
افتح القفل للوصول البطاقات البالغ عددها 68 في هذه المجموعة.
فتح الحزمة
k this deck
35
The following is not true about gridlines: ____.
A) There are two types of gridlines.
B) They are usually identified by a trendline.
C) They make data easier to read.
D) They extend from the axes across the plot area.
A) There are two types of gridlines.
B) They are usually identified by a trendline.
C) They make data easier to read.
D) They extend from the axes across the plot area.
فتح الحزمة
افتح القفل للوصول البطاقات البالغ عددها 68 في هذه المجموعة.
فتح الحزمة
k this deck
36
A linked object is stored in its ____.
A) worksheet
B) PowerPoint file
C) destination file
D) source file
A) worksheet
B) PowerPoint file
C) destination file
D) source file
فتح الحزمة
افتح القفل للوصول البطاقات البالغ عددها 68 في هذه المجموعة.
فتح الحزمة
k this deck
37
You can customize your installation of PowerPoint by changing various settings and preferences. In the PowerPoint Options dialog box, there are ____ sections identified in the left pane, which offer you ways to customize PowerPoint.
A) five
B) seven
C) nine
D) eleven
A) five
B) seven
C) nine
D) eleven
فتح الحزمة
افتح القفل للوصول البطاقات البالغ عددها 68 في هذه المجموعة.
فتح الحزمة
k this deck
38
You would find a Spanish thesaurus and a word translator in the ____.
A) Help task pane
B) Spelling task pane
C) Research task pane
D) Home task pane
A) Help task pane
B) Spelling task pane
C) Research task pane
D) Home task pane
فتح الحزمة
افتح القفل للوصول البطاقات البالغ عددها 68 في هذه المجموعة.
فتح الحزمة
k this deck
39
In the figure above, ____ identifies a category axis label.
A) 1
B) 2
C) 3
D) 4
فتح الحزمة
افتح القفل للوصول البطاقات البالغ عددها 68 في هذه المجموعة.
فتح الحزمة
k this deck
40
You can animate data makers of the same color individually ____.
A) by category
B) by chart
C) by group
D) by series
A) by category
B) by chart
C) by group
D) by series
فتح الحزمة
افتح القفل للوصول البطاقات البالغ عددها 68 في هذه المجموعة.
فتح الحزمة
k this deck
41
An example of an object that you can link is a(n) ____.
A) bitmap image
B) Excel worksheet
C) PowerPoint slide
D) All of the above
A) bitmap image
B) Excel worksheet
C) PowerPoint slide
D) All of the above
فتح الحزمة
افتح القفل للوصول البطاقات البالغ عددها 68 في هذه المجموعة.
فتح الحزمة
k this deck
42
In the following situation(s) it would be better to link an object rather than embedding an object: ____.
A) When you want the latest information in your object
B) When you want to access the object in its source program, even if the source file is not available
C) When you want the object to become a part of your presentation
D) When the object is shared on a network and others have access to it
A) When you want the latest information in your object
B) When you want to access the object in its source program, even if the source file is not available
C) When you want the object to become a part of your presentation
D) When the object is shared on a network and others have access to it
فتح الحزمة
افتح القفل للوصول البطاقات البالغ عددها 68 في هذه المجموعة.
فتح الحزمة
k this deck
43
In the following situation(s) it would be better to embed an object rather than linking an object: ____.
A) When you want the latest information in your object
B) When you want to access the object in its source program, even if the source file is not available
C) When you want the object to become a part of your presentation
D) When the object is shared on a network and others have access to it
A) When you want the latest information in your object
B) When you want to access the object in its source program, even if the source file is not available
C) When you want the object to become a part of your presentation
D) When the object is shared on a network and others have access to it
فتح الحزمة
افتح القفل للوصول البطاقات البالغ عددها 68 في هذه المجموعة.
فتح الحزمة
k this deck
44
When you change the source file of a linked object, ____.
A) the linked object becomes invalid and is removed from the slide
B) a new linked object is created
C) the linked object reflects the changes made
D) access to the linked object is restricted
A) the linked object becomes invalid and is removed from the slide
B) a new linked object is created
C) the linked object reflects the changes made
D) access to the linked object is restricted
فتح الحزمة
افتح القفل للوصول البطاقات البالغ عددها 68 في هذه المجموعة.
فتح الحزمة
k this deck
45
Data marker animation options for a chart include ____.
A) compound animation by series and category
B) individual data markers by series
C) all data markers
D) individual data markers by category
A) compound animation by series and category
B) individual data markers by series
C) all data markers
D) individual data markers by category
فتح الحزمة
افتح القفل للوصول البطاقات البالغ عددها 68 في هذه المجموعة.
فتح الحزمة
k this deck
46
Case-Based Critical Thinking Question Julie is working on a financial presentation that involves a number of complex charts. She wants her charts to be clear and easy to read. She also wants to use some of PowerPoint's advanced charting features. What could Julie add to her chart that would identify potential inaccuracies in data?
A) Trendlines
B) Tick marks
C) Error bars
D) Up bars
A) Trendlines
B) Tick marks
C) Error bars
D) Up bars
فتح الحزمة
افتح القفل للوصول البطاقات البالغ عددها 68 في هذه المجموعة.
فتح الحزمة
k this deck
47
You can animate ____ in a chart.
A) data markers
B) gridlines
C) the legend
D) Entire chart
A) data markers
B) gridlines
C) the legend
D) Entire chart
فتح الحزمة
افتح القفل للوصول البطاقات البالغ عددها 68 في هذه المجموعة.
فتح الحزمة
k this deck
48
Animating data markers individually by ____________________ displays the data markers of each category in the chart.
فتح الحزمة
افتح القفل للوصول البطاقات البالغ عددها 68 في هذه المجموعة.
فتح الحزمة
k this deck
49
Case-Based Critical Thinking Question Julie is working on a financial presentation that involves a number of complex charts. She wants her charts to be clear and easy to read. She also wants to use some of PowerPoint's advanced charting features. What could Julie add to her chart that would predict future developments?
A) Trendlines
B) Tick marks
C) Error bars
D) Up bars
A) Trendlines
B) Tick marks
C) Error bars
D) Up bars
فتح الحزمة
افتح القفل للوصول البطاقات البالغ عددها 68 في هذه المجموعة.
فتح الحزمة
k this deck
50
You can easily add or remove a legend by clicking the Legend button in the Labels group on the Chart Tools ___________________ tab.
فتح الحزمة
افتح القفل للوصول البطاقات البالغ عددها 68 في هذه المجموعة.
فتح الحزمة
k this deck
51
The following statement is NOT true about linked objects: ____.
A) Your PowerPoint presentation must be open to update a linked object.
B) You must have access to the linked object's source file.
C) You must have access to the linked object's source program.
D) You can open a linked object by double-clicking it.
A) Your PowerPoint presentation must be open to update a linked object.
B) You must have access to the linked object's source file.
C) You must have access to the linked object's source program.
D) You can open a linked object by double-clicking it.
فتح الحزمة
افتح القفل للوصول البطاقات البالغ عددها 68 في هذه المجموعة.
فتح الحزمة
k this deck
52
When you need to customize the size and orientation of the slides in your presentation, you can do so using the commands in the Page Setup group on the ___________________ tab on the Ribbon.
فتح الحزمة
افتح القفل للوصول البطاقات البالغ عددها 68 في هذه المجموعة.
فتح الحزمة
k this deck
53
___________________ identify potential error amounts relative to each data marker in a data series.
فتح الحزمة
افتح القفل للوصول البطاقات البالغ عددها 68 في هذه المجموعة.
فتح الحزمة
k this deck
54
Case-Based Critical Thinking Question Julie is working on a financial presentation that involves a number of complex charts. She wants her charts to be clear and easy to read. She also wants to use some of PowerPoint's advanced charting features. What would Julie add to her chart to make sure her categories are clearly identified on the category axis?
A) Trendlines
B) Tick marks
C) Error bars
D) Up bars
A) Trendlines
B) Tick marks
C) Error bars
D) Up bars
فتح الحزمة
افتح القفل للوصول البطاقات البالغ عددها 68 في هذه المجموعة.
فتح الحزمة
k this deck
55
A(n) ___________________ is a graphical representation of an upward or downward trend in a data series, also used to predict future trends.
فتح الحزمة
افتح القفل للوصول البطاقات البالغ عددها 68 في هذه المجموعة.
فتح الحزمة
k this deck
56
Ways to improve presentation performance include ____.
A) reducing single letter and single word animations
B) reducing the size of animated pictures
C) reducing the number of simultaneous animations
D) removing graphics with transparent fills
A) reducing single letter and single word animations
B) reducing the size of animated pictures
C) reducing the number of simultaneous animations
D) removing graphics with transparent fills
فتح الحزمة
افتح القفل للوصول البطاقات البالغ عددها 68 في هذه المجموعة.
فتح الحزمة
k this deck
57
To apply a chart template to an existing chart, click the ___________________ button in the Type group, click Templates, then click the chart template.
فتح الحزمة
افتح القفل للوصول البطاقات البالغ عددها 68 في هذه المجموعة.
فتح الحزمة
k this deck
58
To edit or change a linked object, ____.
A) click the object, then click the Link button on the Home tab
B) double-click the source program
C) open the linked object's source file
D) open the Links dialog box
A) click the object, then click the Link button on the Home tab
B) double-click the source program
C) open the linked object's source file
D) open the Links dialog box
فتح الحزمة
افتح القفل للوصول البطاقات البالغ عددها 68 في هذه المجموعة.
فتح الحزمة
k this deck
59
When you link an object, ____ appears on the slide.
A) the object itself
B) a representation of the of object
C) an animation
D) a linked icon
A) the object itself
B) a representation of the of object
C) an animation
D) a linked icon
فتح الحزمة
افتح القفل للوصول البطاقات البالغ عددها 68 في هذه المجموعة.
فتح الحزمة
k this deck
60
In the figure above, number 8 is pointing to a ____________________.
فتح الحزمة
افتح القفل للوصول البطاقات البالغ عددها 68 في هذه المجموعة.
فتح الحزمة
k this deck
61
Minor gridlines are darker in color than other gridlines.
فتح الحزمة
افتح القفل للوصول البطاقات البالغ عددها 68 في هذه المجموعة.
فتح الحزمة
k this deck
62
Exit animation effects cause an object to leave the slide.
فتح الحزمة
افتح القفل للوصول البطاقات البالغ عددها 68 في هذه المجموعة.
فتح الحزمة
k this deck
63
Match between columns
فتح الحزمة
افتح القفل للوصول البطاقات البالغ عددها 68 في هذه المجموعة.
فتح الحزمة
k this deck
64
Explain how a chart is animated. Be sure to describe which parts of the chart can be animated and how the animation works.
فتح الحزمة
افتح القفل للوصول البطاقات البالغ عددها 68 في هذه المجموعة.
فتح الحزمة
k this deck
65
The object you create with a source program is saved in a destination file.
فتح الحزمة
افتح القفل للوصول البطاقات البالغ عددها 68 في هذه المجموعة.
فتح الحزمة
k this deck
66
Describe in detail your understanding of embedded and linked charts. Discuss their differences and similarities and properly define the terms "source file," "destination file," and "source program."
فتح الحزمة
افتح القفل للوصول البطاقات البالغ عددها 68 في هذه المجموعة.
فتح الحزمة
k this deck
67
A linked object is stored in its source file, not on a presentation slide such as embedded objects.
فتح الحزمة
افتح القفل للوصول البطاقات البالغ عددها 68 في هذه المجموعة.
فتح الحزمة
k this deck
68
Animating data markers individually by ____________________ displays the data markers of each series.
فتح الحزمة
افتح القفل للوصول البطاقات البالغ عددها 68 في هذه المجموعة.
فتح الحزمة
k this deck
فتح الحزمة
افتح القفل للوصول البطاقات البالغ عددها 68 في هذه المجموعة.


