Deck 16: Simple Linear Regression and Correlat
ملء الشاشة (f)
سؤال
سؤال
سؤال
سؤال
سؤال
A regression analysis between weight ( y in pounds)and height ( x in inches)resulted in the following least squares line:  . This implies that if the height is increased by 1 inch, the weight is expected to increase by an average of 6 pounds.
. This implies that if the height is increased by 1 inch, the weight is expected to increase by an average of 6 pounds. سؤال
When the actual values y of a dependent variable and the corresponding predicted values  are the same, the standard error of the estimate will be 1.0.
are the same, the standard error of the estimate will be 1.0. سؤال
سؤال
The regression line  has been fitted to the data points (4, 11), (2, 7), and (1, 5). The sum of squares for error will be 10.0.
has been fitted to the data points (4, 11), (2, 7), and (1, 5). The sum of squares for error will be 10.0. سؤال
A regression analysis between sales (in $)and advertising (in $)resulted in the following least squares line:  . This implies that an increase of $1 in advertising is associated with an increase of $60 in sales.
. This implies that an increase of $1 in advertising is associated with an increase of $60 in sales. سؤال
The residual ri is defined as the difference between the actual value yi and the estimated value  .
.
. سؤال
سؤال
A simple linear regression equation is given by  . The point estimate of y when x = 4 is 20.45.
. The point estimate of y when x = 4 is 20.45. سؤال
If cov( x , y )= 7.5075 and  , then the sample slope coefficient is 2.145.
, then the sample slope coefficient is 2.145. سؤال
سؤال
سؤال
A regression analysis between sales (in $1000)and advertising (in $100)resulted in the following least squares line:  . This implies that if advertising is $600, then the predicted amount of sales (in dollars)is $125,000.
. This implies that if advertising is $600, then the predicted amount of sales (in dollars)is $125,000. سؤال
سؤال
سؤال
سؤال
سؤال
سؤال
سؤال
سؤال
سؤال
سؤال
سؤال
سؤال
سؤال
سؤال
سؤال
سؤال
سؤال
When the actual values y of a dependent variable and the corresponding predicted values  are the same, the standard error of estimate s e will be 0.0.
are the same, the standard error of estimate s e will be 0.0. سؤال
سؤال
In a simple linear regression problem, the least squares line is 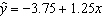 , and the coefficient of determination is 0.81. The coefficient of correlation must be - 0.90.
, and the coefficient of determination is 0.81. The coefficient of correlation must be - 0.90. سؤال
سؤال
سؤال
سؤال
سؤال
In simple linear regression, the denominator of the standard error of estimate s e is  .
.
. سؤال
سؤال
The regression line  has been fitted to the data points (4, 8), (2, 5), and (1, 2). The sum of the squared residuals will be:
A)7
B)15
C)8
D)22
has been fitted to the data points (4, 8), (2, 5), and (1, 2). The sum of the squared residuals will be:A)7
B)15
C)8
D)22
سؤال
سؤال
سؤال
سؤال
سؤال
سؤال
A regression analysis between weight ( y in pounds)and height ( x in inches)resulted in the following least squares line:  . This implies that if the height is increased by 1 inch, the weight, on average, is expected to:
A)increase by 1 pound.
B)decrease by 1 pound.
C)increase by 5 pounds.
D)increase by 24 pounds.
. This implies that if the height is increased by 1 inch, the weight, on average, is expected to:A)increase by 1 pound.
B)decrease by 1 pound.
C)increase by 5 pounds.
D)increase by 24 pounds.
سؤال
سؤال
سؤال
A regression analysis between sales (in $1000)and advertising (in $100)resulted in the following least squares line:  . This implies that if advertising is $800, then the predicted amount of sales (in dollars)is:
A)$4875
B)$123,000
C)$487,500
D)$12,300
. This implies that if advertising is $800, then the predicted amount of sales (in dollars)is:A)$4875
B)$123,000
C)$487,500
D)$12,300
سؤال
سؤال
A regression analysis between sales (in $1,000)and advertising (in $1,000)resulted in the following least squares line:  . This implies that:
A)as advertising increases by $1,000, sales increases by $5,000.
B)as advertising increases by $1,000, sales increases by $80,000.
C)as advertising increases by $5, sales increases by $80.
D)None of these choices.
. This implies that:A)as advertising increases by $1,000, sales increases by $5,000.
B)as advertising increases by $1,000, sales increases by $80,000.
C)as advertising increases by $5, sales increases by $80.
D)None of these choices.
سؤال
سؤال
سؤال
سؤال
Given the least squares regression line  :
:
A)the relationship between x and y is positive.
B)the relationship between x and y is negative.
C)as x decreases, so does y.
D)None of these choices.
:A)the relationship between x and y is positive.
B)the relationship between x and y is negative.
C)as x decreases, so does y.
D)None of these choices.
سؤال
سؤال
The point where confidence intervals and prediction intervals do best is  .
.
. سؤال
سؤال
سؤال
سؤال
Given that 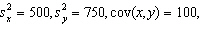 and n = 6, the standard error of estimate is:
A)3,749.00
B)937.25
C)30.61
D)None of these choices.
and n = 6, the standard error of estimate is:A)3,749.00
B)937.25
C)30.61
D)None of these choices.
سؤال
سؤال
سؤال
سؤال
In the least squares regression line  , the predicted value of y equals:
A)1.0 when x = - 1.0
B)2.0 when x = 1.0
C)2.0 when x = - 1.0
D)1.0 when x = 1.0
, the predicted value of y equals:A)1.0 when x = - 1.0
B)2.0 when x = 1.0
C)2.0 when x = - 1.0
D)1.0 when x = 1.0
سؤال
سؤال
سؤال
سؤال
سؤال
Given the least squares regression line 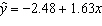 , and a coefficient of determination of 0.81, the coefficient of correlation is:
A)- 0.66
B)0.81
C)- 0.90
D)0.90
, and a coefficient of determination of 0.81, the coefficient of correlation is:A)- 0.66
B)0.81
C)- 0.90
D)0.90
سؤال
In a simple linear regression problem, the following statistics are calculated from a sample of 10 observations: 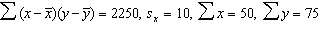 . The least squares estimates of the slope and y -intercept are, respectively,
A)1.5 and 0.5
B)2.5 and 1.5
C)1.5 and 2.5
D)2.5 and - 5.0
. The least squares estimates of the slope and y -intercept are, respectively,A)1.5 and 0.5
B)2.5 and 1.5
C)1.5 and 2.5
D)2.5 and - 5.0
سؤال
In a simple linear regression problem, the following sum of squares are produced: 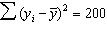 ,
, 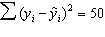 , and
, and 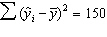 . The percentage of the variation in y that is explained by the variation in x is:
A)25%
B)75%
C)33%
D)50%
, , and . The percentage of the variation in y that is explained by the variation in x is:A)25%
B)75%
C)33%
D)50%
سؤال
سؤال
سؤال
سؤال
سؤال
سؤال

فتح الحزمة
قم بالتسجيل لفتح البطاقات في هذه المجموعة!
Unlock Deck
Unlock Deck
1/238
العب
ملء الشاشة (f)
Deck 16: Simple Linear Regression and Correlat
1
The value of the sum of squares for regression SSR can never be smaller than 1.
False
2
The method of least squares requires that the sum of the squared deviations between actual y values in the scatter diagram and y values predicted by the regression line be minimized.
True
3
Statisticians have shown that sample y -intercept b 0 and sample slope coefficient b 1 are unbiased estimators of the population regression parameters b 0 and b 1, respectively.
True
4
The first-order linear model is sometimes called the simple linear regression model.
فتح الحزمة
افتح القفل للوصول البطاقات البالغ عددها 238 في هذه المجموعة.
فتح الحزمة
k this deck
5
A regression analysis between weight ( y in pounds)and height ( x in inches)resulted in the following least squares line: . This implies that if the height is increased by 1 inch, the weight is expected to increase by an average of 6 pounds.
. This implies that if the height is increased by 1 inch, the weight is expected to increase by an average of 6 pounds. فتح الحزمة
افتح القفل للوصول البطاقات البالغ عددها 238 في هذه المجموعة.
فتح الحزمة
k this deck
6
When the actual values y of a dependent variable and the corresponding predicted values are the same, the standard error of the estimate will be 1.0.
are the same, the standard error of the estimate will be 1.0. فتح الحزمة
افتح القفل للوصول البطاقات البالغ عددها 238 في هذه المجموعة.
فتح الحزمة
k this deck
7
If the coefficient of correlation is 1.0, then the coefficient of determination must be 1.0.
فتح الحزمة
افتح القفل للوصول البطاقات البالغ عددها 238 في هذه المجموعة.
فتح الحزمة
k this deck
8
The regression line has been fitted to the data points (4, 11), (2, 7), and (1, 5). The sum of squares for error will be 10.0.
has been fitted to the data points (4, 11), (2, 7), and (1, 5). The sum of squares for error will be 10.0. فتح الحزمة
افتح القفل للوصول البطاقات البالغ عددها 238 في هذه المجموعة.
فتح الحزمة
k this deck
9
A regression analysis between sales (in $)and advertising (in $)resulted in the following least squares line: . This implies that an increase of $1 in advertising is associated with an increase of $60 in sales.
. This implies that an increase of $1 in advertising is associated with an increase of $60 in sales. فتح الحزمة
افتح القفل للوصول البطاقات البالغ عددها 238 في هذه المجموعة.
فتح الحزمة
k this deck
10
The residual ri is defined as the difference between the actual value yi and the estimated value .
. فتح الحزمة
افتح القفل للوصول البطاقات البالغ عددها 238 في هذه المجموعة.
فتح الحزمة
k this deck
11
The value of the sum of squares for regression SSR can never be smaller than 0.0.
فتح الحزمة
افتح القفل للوصول البطاقات البالغ عددها 238 في هذه المجموعة.
فتح الحزمة
k this deck
12
A simple linear regression equation is given by . The point estimate of y when x = 4 is 20.45.
. The point estimate of y when x = 4 is 20.45. فتح الحزمة
افتح القفل للوصول البطاقات البالغ عددها 238 في هذه المجموعة.
فتح الحزمة
k this deck
13
If cov( x , y )= 7.5075 and , then the sample slope coefficient is 2.145.
, then the sample slope coefficient is 2.145. فتح الحزمة
افتح القفل للوصول البطاقات البالغ عددها 238 في هذه المجموعة.
فتح الحزمة
k this deck
14
Another name for the residual term in a regression equation is random error.
فتح الحزمة
افتح القفل للوصول البطاقات البالغ عددها 238 في هذه المجموعة.
فتح الحزمة
k this deck
15
The vertical spread of the data points about the regression line is measured by the y -intercept.
فتح الحزمة
افتح القفل للوصول البطاقات البالغ عددها 238 في هذه المجموعة.
فتح الحزمة
k this deck
16
A regression analysis between sales (in $1000)and advertising (in $100)resulted in the following least squares line: . This implies that if advertising is $600, then the predicted amount of sales (in dollars)is $125,000.
. This implies that if advertising is $600, then the predicted amount of sales (in dollars)is $125,000. فتح الحزمة
افتح القفل للوصول البطاقات البالغ عددها 238 في هذه المجموعة.
فتح الحزمة
k this deck
17
A direct relationship between an independent variable x and a dependent variably y means that the variables x and y increase or decrease together.
فتح الحزمة
افتح القفل للوصول البطاقات البالغ عددها 238 في هذه المجموعة.
فتح الحزمة
k this deck
18
To create a deterministic model, we start with a probabilistic model that approximates the relationship we want to model.
فتح الحزمة
افتح القفل للوصول البطاقات البالغ عددها 238 في هذه المجموعة.
فتح الحزمة
k this deck
19
An inverse relationship between an independent variable x and a dependent variably y means that as x increases, y decreases, and vice versa.
فتح الحزمة
افتح القفل للوصول البطاقات البالغ عددها 238 في هذه المجموعة.
فتح الحزمة
k this deck
20
The residuals are observations of the error variable e . Consequently, the minimized sum of squared deviations is called the sum of squares for error, denoted SSE.
فتح الحزمة
افتح القفل للوصول البطاقات البالغ عددها 238 في هذه المجموعة.
فتح الحزمة
k this deck
21
If the coefficient of correlation is - 0.81, then the percentage of the variation in y that is explained by the regression line is 81%.
فتح الحزمة
افتح القفل للوصول البطاقات البالغ عددها 238 في هذه المجموعة.
فتح الحزمة
k this deck
22
A prediction interval is used when we want to predict a one-time occurrence for a particular value of y when the independent variable is a given x value.
فتح الحزمة
افتح القفل للوصول البطاقات البالغ عددها 238 في هذه المجموعة.
فتح الحزمة
k this deck
23
If the coefficient of determination is 0.95, this means that 95% of the variation in the independent variable x can be explained by the y variable.
فتح الحزمة
افتح القفل للوصول البطاقات البالغ عددها 238 في هذه المجموعة.
فتح الحزمة
k this deck
24
A store manager gives a pre-employment examination to new employees. The test is scored from 1 to 100. He has data on their sales at the end of one year measured in dollars. He wants to know if there is any linear relationship between pre-employment examination score and sales. An appropriate test to use is the t -test of the population correlation coefficient.
فتح الحزمة
افتح القفل للوصول البطاقات البالغ عددها 238 في هذه المجموعة.
فتح الحزمة
k this deck
25
If all the points in a scatter diagram lie on the least squares regression line, then the coefficient of correlation must be 1.0.
فتح الحزمة
افتح القفل للوصول البطاقات البالغ عددها 238 في هذه المجموعة.
فتح الحزمة
k this deck
26
If the coefficient of determination is 1.0, then the coefficient of correlation must be 1.0.
فتح الحزمة
افتح القفل للوصول البطاقات البالغ عددها 238 في هذه المجموعة.
فتح الحزمة
k this deck
27
If the error variable e is normally distributed, the test statistic for testing H 0: b 1 = 0 has a Student t -distribution with n - 2 degrees of freedom.
فتح الحزمة
افتح القفل للوصول البطاقات البالغ عددها 238 في هذه المجموعة.
فتح الحزمة
k this deck
28
If there is no linear relationship between two variables x and y , the coefficient of determination must be - 1.0.
فتح الحزمة
افتح القفل للوصول البطاقات البالغ عددها 238 في هذه المجموعة.
فتح الحزمة
k this deck
29
If the coefficient of determination is 0.95, this means that 95% of the y values were predicted correctly by the regression line.
فتح الحزمة
افتح القفل للوصول البطاقات البالغ عددها 238 في هذه المجموعة.
فتح الحزمة
k this deck
30
Correlation analysis is used to determine whether there is a linear relationship between an independent variable x and a dependent variable y .
فتح الحزمة
افتح القفل للوصول البطاقات البالغ عددها 238 في هذه المجموعة.
فتح الحزمة
k this deck
31
The probability distribution of the error variable e is normal, with mean E ( e )= 0, and standard deviation s e =1.
فتح الحزمة
افتح القفل للوصول البطاقات البالغ عددها 238 في هذه المجموعة.
فتح الحزمة
k this deck
32
A zero correlation coefficient between a pair of random variables means that there is no linear relationship between the random variables.
فتح الحزمة
افتح القفل للوصول البطاقات البالغ عددها 238 في هذه المجموعة.
فتح الحزمة
k this deck
33
When the actual values y of a dependent variable and the corresponding predicted values are the same, the standard error of estimate s e will be 0.0.
are the same, the standard error of estimate s e will be 0.0. فتح الحزمة
افتح القفل للوصول البطاقات البالغ عددها 238 في هذه المجموعة.
فتح الحزمة
k this deck
34
A zero population correlation coefficient for x and y means that there is no type of relationship whatsoever between x and y.
فتح الحزمة
افتح القفل للوصول البطاقات البالغ عددها 238 في هذه المجموعة.
فتح الحزمة
k this deck
35
In a simple linear regression problem, the least squares line is , and the coefficient of determination is 0.81. The coefficient of correlation must be - 0.90.
, and the coefficient of determination is 0.81. The coefficient of correlation must be - 0.90. فتح الحزمة
افتح القفل للوصول البطاقات البالغ عددها 238 في هذه المجموعة.
فتح الحزمة
k this deck
36
The value of the sum of squares for regression SSR can never be larger than the value of total sum of squares SST.
فتح الحزمة
افتح القفل للوصول البطاقات البالغ عددها 238 في هذه المجموعة.
فتح الحزمة
k this deck
37
The coefficient of determination is equal to the coefficient of correlation squared.
فتح الحزمة
افتح القفل للوصول البطاقات البالغ عددها 238 في هذه المجموعة.
فتح الحزمة
k this deck
38
If the value of the sum of squares for error SSE equals zero, then the coefficient of determination must equal zero.
فتح الحزمة
افتح القفل للوصول البطاقات البالغ عددها 238 في هذه المجموعة.
فتح الحزمة
k this deck
39
In a simple linear regression model, testing whether the slope b 1 of the population regression line could be zero is the same as testing whether or not the population coefficient of correlation r equals zero.
فتح الحزمة
افتح القفل للوصول البطاقات البالغ عددها 238 في هذه المجموعة.
فتح الحزمة
k this deck
40
In simple linear regression, the denominator of the standard error of estimate s e is .
. فتح الحزمة
افتح القفل للوصول البطاقات البالغ عددها 238 في هذه المجموعة.
فتح الحزمة
k this deck
41
Which of the following techniques is used to predict the value of one variable on the basis of other variables?
A)Correlation analysis
B)Coefficient of correlation
C)Covariance
D)Regression analysis
A)Correlation analysis
B)Coefficient of correlation
C)Covariance
D)Regression analysis
فتح الحزمة
افتح القفل للوصول البطاقات البالغ عددها 238 في هذه المجموعة.
فتح الحزمة
k this deck
42
The regression line has been fitted to the data points (4, 8), (2, 5), and (1, 2). The sum of the squared residuals will be:
A)7
B)15
C)8
D)22
has been fitted to the data points (4, 8), (2, 5), and (1, 2). The sum of the squared residuals will be:A)7
B)15
C)8
D)22
فتح الحزمة
افتح القفل للوصول البطاقات البالغ عددها 238 في هذه المجموعة.
فتح الحزمة
k this deck
43
A confidence interval estimate for the expected value of y will always be wider than the prediction interval for the same given value of x and the same confidence level.
فتح الحزمة
افتح القفل للوصول البطاقات البالغ عددها 238 في هذه المجموعة.
فتح الحزمة
k this deck
44
In the simple linear regression model, the slope represents the:
A)value of y when x = 0.
B)average change in y per unit change in x.
C)value of x when y = 0.
D)average change in x per unit change in y.
A)value of y when x = 0.
B)average change in y per unit change in x.
C)value of x when y = 0.
D)average change in x per unit change in y.
فتح الحزمة
افتح القفل للوصول البطاقات البالغ عددها 238 في هذه المجموعة.
فتح الحزمة
k this deck
45
The residual is defined as the difference between:
A)the actual value of y and the estimated value of y
B)the actual value of x and the estimated value of x
C)the actual value of y and the estimated value of x
D)the actual value of x and the estimated value of y
A)the actual value of y and the estimated value of y
B)the actual value of x and the estimated value of x
C)the actual value of y and the estimated value of x
D)the actual value of x and the estimated value of y
فتح الحزمة
افتح القفل للوصول البطاقات البالغ عددها 238 في هذه المجموعة.
فتح الحزمة
k this deck
46
In the simple linear regression model, the y -intercept represents the:
A)change in y per unit change in x .
B)change in x per unit change in y .
C)value of y when x = 0.
D)value of x when y = 0.
A)change in y per unit change in x .
B)change in x per unit change in y .
C)value of y when x = 0.
D)value of x when y = 0.
فتح الحزمة
افتح القفل للوصول البطاقات البالغ عددها 238 في هذه المجموعة.
فتح الحزمة
k this deck
47
The graph of a confidence interval for the expected value of y is represented by two parallel lines, one on either side of the regression line.
فتح الحزمة
افتح القفل للوصول البطاقات البالغ عددها 238 في هذه المجموعة.
فتح الحزمة
k this deck
48
A regression analysis between weight ( y in pounds)and height ( x in inches)resulted in the following least squares line: . This implies that if the height is increased by 1 inch, the weight, on average, is expected to:
A)increase by 1 pound.
B)decrease by 1 pound.
C)increase by 5 pounds.
D)increase by 24 pounds.
. This implies that if the height is increased by 1 inch, the weight, on average, is expected to:A)increase by 1 pound.
B)decrease by 1 pound.
C)increase by 5 pounds.
D)increase by 24 pounds.
فتح الحزمة
افتح القفل للوصول البطاقات البالغ عددها 238 في هذه المجموعة.
فتح الحزمة
k this deck
49
In the first order linear regression model, the population parameters of the y -intercept and the slope are estimated, respectively, by:
A)b 0 and b 1
B)b 0 and b 1
C)b 0 and b 1
D)b 0 and b 1
A)b 0 and b 1
B)b 0 and b 1
C)b 0 and b 1
D)b 0 and b 1
فتح الحزمة
افتح القفل للوصول البطاقات البالغ عددها 238 في هذه المجموعة.
فتح الحزمة
k this deck
50
A confidence interval (as opposed to a prediction interval)is used to estimate the long-run average value of y .
فتح الحزمة
افتح القفل للوصول البطاقات البالغ عددها 238 في هذه المجموعة.
فتح الحزمة
k this deck
51
A regression analysis between sales (in $1000)and advertising (in $100)resulted in the following least squares line: . This implies that if advertising is $800, then the predicted amount of sales (in dollars)is:
A)$4875
B)$123,000
C)$487,500
D)$12,300
. This implies that if advertising is $800, then the predicted amount of sales (in dollars)is:A)$4875
B)$123,000
C)$487,500
D)$12,300
فتح الحزمة
افتح القفل للوصول البطاقات البالغ عددها 238 في هذه المجموعة.
فتح الحزمة
k this deck
52
If an estimated regression line has a y -intercept of 10 and a slope of 4, then when x = 2 the actual value of y is:
A)18
B)15
C)14
D)unknown.
A)18
B)15
C)14
D)unknown.
فتح الحزمة
افتح القفل للوصول البطاقات البالغ عددها 238 في هذه المجموعة.
فتح الحزمة
k this deck
53
A regression analysis between sales (in $1,000)and advertising (in $1,000)resulted in the following least squares line: . This implies that:
A)as advertising increases by $1,000, sales increases by $5,000.
B)as advertising increases by $1,000, sales increases by $80,000.
C)as advertising increases by $5, sales increases by $80.
D)None of these choices.
. This implies that:A)as advertising increases by $1,000, sales increases by $5,000.
B)as advertising increases by $1,000, sales increases by $80,000.
C)as advertising increases by $5, sales increases by $80.
D)None of these choices.
فتح الحزمة
افتح القفل للوصول البطاقات البالغ عددها 238 في هذه المجموعة.
فتح الحزمة
k this deck
54
In regression analysis, the residuals represent the:
A)difference between the actual y values and their predicted values.
B)difference between the actual x values and their predicted values.
C)square root of the slope of the regression line.
D)change in y per unit change in x.
A)difference between the actual y values and their predicted values.
B)difference between the actual x values and their predicted values.
C)square root of the slope of the regression line.
D)change in y per unit change in x.
فتح الحزمة
افتح القفل للوصول البطاقات البالغ عددها 238 في هذه المجموعة.
فتح الحزمة
k this deck
55
There is more error in estimating a mean value of y as opposed to predicting an individual value of y .
فتح الحزمة
افتح القفل للوصول البطاقات البالغ عددها 238 في هذه المجموعة.
فتح الحزمة
k this deck
56
The confidence interval estimate of the expected value of y will be narrower than the prediction interval for the same given value of x and confidence level. This is because there is less error in estimating a mean value as opposed to predicting an individual value.
فتح الحزمة
افتح القفل للوصول البطاقات البالغ عددها 238 في هذه المجموعة.
فتح الحزمة
k this deck
57
Given the least squares regression line :
A)the relationship between x and y is positive.
B)the relationship between x and y is negative.
C)as x decreases, so does y.
D)None of these choices.
:A)the relationship between x and y is positive.
B)the relationship between x and y is negative.
C)as x decreases, so does y.
D)None of these choices.
فتح الحزمة
افتح القفل للوصول البطاقات البالغ عددها 238 في هذه المجموعة.
فتح الحزمة
k this deck
58
The prediction interval for a particular value of y is always wider than the confidence interval for mean value of y , given the same data set, x value, and confidence level.
فتح الحزمة
افتح القفل للوصول البطاقات البالغ عددها 238 في هذه المجموعة.
فتح الحزمة
k this deck
59
The point where confidence intervals and prediction intervals do best is .
. فتح الحزمة
افتح القفل للوصول البطاقات البالغ عددها 238 في هذه المجموعة.
فتح الحزمة
k this deck
60
In the first-order linear regression model, the population parameters of the y -intercept and the slope are, respectively,
A)b 0 and b 1
B)b 0 and b 1
C)b 0 and b 1
D)b 0 and b 1
A)b 0 and b 1
B)b 0 and b 1
C)b 0 and b 1
D)b 0 and b 1
فتح الحزمة
افتح القفل للوصول البطاقات البالغ عددها 238 في هذه المجموعة.
فتح الحزمة
k this deck
61
In regression analysis, if the coefficient of determination is 1.0, then:
A)the sum of squares for error must be 1.0
B)the sum of squares for regression must be 1.0
C)the sum of squares for error must be 0.0
D)the sum of squares for regression must be 0.0
A)the sum of squares for error must be 1.0
B)the sum of squares for regression must be 1.0
C)the sum of squares for error must be 0.0
D)the sum of squares for regression must be 0.0
فتح الحزمة
افتح القفل للوصول البطاقات البالغ عددها 238 في هذه المجموعة.
فتح الحزمة
k this deck
62
When all the actual values of y are equal to their predicted values, the standard error of estimate will be:
A)1.0
B)- 1.0
C)0.0
D)None of these choices.
A)1.0
B)- 1.0
C)0.0
D)None of these choices.
فتح الحزمة
افتح القفل للوصول البطاقات البالغ عددها 238 في هذه المجموعة.
فتح الحزمة
k this deck
63
Given that and n = 6, the standard error of estimate is:
A)3,749.00
B)937.25
C)30.61
D)None of these choices.
and n = 6, the standard error of estimate is:A)3,749.00
B)937.25
C)30.61
D)None of these choices.
فتح الحزمة
افتح القفل للوصول البطاقات البالغ عددها 238 في هذه المجموعة.
فتح الحزمة
k this deck
64
In simple linear regression, most often we perform a two-tail test of the population slope b 1 to determine whether there is sufficient evidence to infer that a linear relationship exists. The null hypothesis is stated as:
A)H 0: b 1 = 0
B)H 0: b 1 = b 1
C)H 0: b 1 ¹ 0
D)None of these choices.
A)H 0: b 1 = 0
B)H 0: b 1 = b 1
C)H 0: b 1 ¹ 0
D)None of these choices.
فتح الحزمة
افتح القفل للوصول البطاقات البالغ عددها 238 في هذه المجموعة.
فتح الحزمة
k this deck
65
Testing whether the slope of the population regression line could be zero is equivalent to testing whether the:
A)sample coefficient of correlation could be zero
B)standard error of estimate could be zero
C)population coefficient of correlation could be zero
D)sum of squares for error could be zero
A)sample coefficient of correlation could be zero
B)standard error of estimate could be zero
C)population coefficient of correlation could be zero
D)sum of squares for error could be zero
فتح الحزمة
افتح القفل للوصول البطاقات البالغ عددها 238 في هذه المجموعة.
فتح الحزمة
k this deck
66
If the coefficient of correlation is - 0.60, then the coefficient of determination is:
A)- 0.60
B)- 0.36
C)0.36
D)0.77
A)- 0.60
B)- 0.36
C)0.36
D)0.77
فتح الحزمة
افتح القفل للوصول البطاقات البالغ عددها 238 في هذه المجموعة.
فتح الحزمة
k this deck
67
In the least squares regression line , the predicted value of y equals:
A)1.0 when x = - 1.0
B)2.0 when x = 1.0
C)2.0 when x = - 1.0
D)1.0 when x = 1.0
, the predicted value of y equals:A)1.0 when x = - 1.0
B)2.0 when x = 1.0
C)2.0 when x = - 1.0
D)1.0 when x = 1.0
فتح الحزمة
افتح القفل للوصول البطاقات البالغ عددها 238 في هذه المجموعة.
فتح الحزمة
k this deck
68
The coefficient of correlation is used to determine:
A)the strength and direction of the linear relationship between x and y .
B)the least squares estimates of the regression parameters.
C)the predicted value of y for a given value of x .
D)All of these choices.
A)the strength and direction of the linear relationship between x and y .
B)the least squares estimates of the regression parameters.
C)the predicted value of y for a given value of x .
D)All of these choices.
فتح الحزمة
افتح القفل للوصول البطاقات البالغ عددها 238 في هذه المجموعة.
فتح الحزمة
k this deck
69
If all the points in a scatter diagram lie on the least squares regression line, then the coefficient of correlation must be:
A)1.0
B)- 1.0
C)either 1.0 or - 1.0
D)0.0
A)1.0
B)- 1.0
C)either 1.0 or - 1.0
D)0.0
فتح الحزمة
افتح القفل للوصول البطاقات البالغ عددها 238 في هذه المجموعة.
فتح الحزمة
k this deck
70
A regression line using 25 observations produced SSR = 118.68 and SSE = 56.32. The standard error of estimate was:
A)2.11
B)1.56
C)2.44
D)None of these choices.
A)2.11
B)1.56
C)2.44
D)None of these choices.
فتح الحزمة
افتح القفل للوصول البطاقات البالغ عددها 238 في هذه المجموعة.
فتح الحزمة
k this deck
71
If the coefficient of determination is 0.975, then which of the following is true regarding the slope of the regression line?
A)All we can tell is that it must be positive.
B)It must be 0.975.
C)It must be 0.987.
D)Cannot tell the sign or the value.
A)All we can tell is that it must be positive.
B)It must be 0.975.
C)It must be 0.987.
D)Cannot tell the sign or the value.
فتح الحزمة
افتح القفل للوصول البطاقات البالغ عددها 238 في هذه المجموعة.
فتح الحزمة
k this deck
72
Given the least squares regression line , and a coefficient of determination of 0.81, the coefficient of correlation is:
A)- 0.66
B)0.81
C)- 0.90
D)0.90
, and a coefficient of determination of 0.81, the coefficient of correlation is:A)- 0.66
B)0.81
C)- 0.90
D)0.90
فتح الحزمة
افتح القفل للوصول البطاقات البالغ عددها 238 في هذه المجموعة.
فتح الحزمة
k this deck
73
In a simple linear regression problem, the following statistics are calculated from a sample of 10 observations: . The least squares estimates of the slope and y -intercept are, respectively,
A)1.5 and 0.5
B)2.5 and 1.5
C)1.5 and 2.5
D)2.5 and - 5.0
. The least squares estimates of the slope and y -intercept are, respectively,A)1.5 and 0.5
B)2.5 and 1.5
C)1.5 and 2.5
D)2.5 and - 5.0
فتح الحزمة
افتح القفل للوصول البطاقات البالغ عددها 238 في هذه المجموعة.
فتح الحزمة
k this deck
74
In a simple linear regression problem, the following sum of squares are produced: , , and . The percentage of the variation in y that is explained by the variation in x is:
A)25%
B)75%
C)33%
D)50%
, , and . The percentage of the variation in y that is explained by the variation in x is:A)25%
B)75%
C)33%
D)50%
فتح الحزمة
افتح القفل للوصول البطاقات البالغ عددها 238 في هذه المجموعة.
فتح الحزمة
k this deck
75
The symbol for the population coefficient of correlation is:
A)r
B)r
C)r 2
D)r 2
A)r
B)r
C)r 2
D)r 2
فتح الحزمة
افتح القفل للوصول البطاقات البالغ عددها 238 في هذه المجموعة.
فتح الحزمة
k this deck
76
The symbol for the sample coefficient of correlation is:
A)r
B)r
C)r 2
D)r 2
A)r
B)r
C)r 2
D)r 2
فتح الحزمة
افتح القفل للوصول البطاقات البالغ عددها 238 في هذه المجموعة.
فتح الحزمة
k this deck
77
If the coefficient of correlation between x and y is close to 1.0, this indicates that:
A)y causes x to happen.
B)x causes y to happen.
C)both a and b.
D)there may or may not be a causal relationship between x and y.
A)y causes x to happen.
B)x causes y to happen.
C)both a and b.
D)there may or may not be a causal relationship between x and y.
فتح الحزمة
افتح القفل للوصول البطاقات البالغ عددها 238 في هذه المجموعة.
فتح الحزمة
k this deck
78
Given that the sum of squares for error is 60 and the sum of squares for regression is 140, then the coefficient of determination is:
A)0.429
B)0.300
C)0.700
D)None of these choices.
A)0.429
B)0.300
C)0.700
D)None of these choices.
فتح الحزمة
افتح القفل للوصول البطاقات البالغ عددها 238 في هذه المجموعة.
فتح الحزمة
k this deck
79
The least squares method for determining the best fit minimizes:
A)total variation in the dependent variable
B)sum of squares for error
C)sum of squares for regression
D)All of these choices are true.
A)total variation in the dependent variable
B)sum of squares for error
C)sum of squares for regression
D)All of these choices are true.
فتح الحزمة
افتح القفل للوصول البطاقات البالغ عددها 238 في هذه المجموعة.
فتح الحزمة
k this deck
80
If the coefficient of correlation is - 0.80, then the percentage of the variation in y that is explained by the variation in x is:
A)80%
B)64%
C)89%
D)None of these choices.
A)80%
B)64%
C)89%
D)None of these choices.
فتح الحزمة
افتح القفل للوصول البطاقات البالغ عددها 238 في هذه المجموعة.
فتح الحزمة
k this deck
فتح الحزمة
افتح القفل للوصول البطاقات البالغ عددها 238 في هذه المجموعة.


