Deck 10: Correlation and Regression
ملء الشاشة (f)
سؤال
A regression line was calculated as  .The slope of this line is -3.2.
.The slope of this line is -3.2. سؤال
The standard error of estimate is the standard deviation of the observed x-values about the predicted  values.
values. سؤال
With enough variables, it is possible to get an  value close to 1, even if the variables have no particular
meaning in the model.
value close to 1, even if the variables have no particularmeaning in the model.
سؤال
سؤال
سؤال
سؤال
سؤال
Using a regression line of  , a value of x = 3.6 would result in a predicted value of
  .
.
, a value of x = 3.6 would result in a predicted value of . سؤال
سؤال
سؤال
سؤال
If there are three independent variables  available, then the value of
  for a multiple
regression of y using will always be smaller than the value of
  for a multiple regression of y
using just
available, then the value of for a multipleregression of y using
will always be smaller than the value of for a multiple regression of yusing just
سؤال
سؤال
سؤال
سؤال
سؤال
سؤال
سؤال
سؤال
سؤال
Compute the correlation coefficient for the data below 
A)0.942
B)-0.347
C)-0.496
D)-0.992
A)0.942
B)-0.347
C)-0.496
D)-0.992
سؤال
Test the significance of the correlation coefficient r at  for the data below.
A)
B)
C)
D)
for the data below. A)
B)
C)
D)
سؤال
A study was conducted to determine if there was a relationship between the prices a non-member of a club paid for various publications and the prices that a member paid for the same publications.The data
Gathered are shown below.What is the value of the correlation coefficient?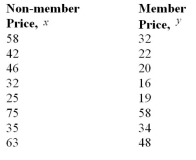
A)0.762
B)0.857
C)0.679
D)0.932
Gathered are shown below.What is the value of the correlation coefficient?
A)0.762
B)0.857
C)0.679
D)0.932
سؤال
The western city wishes to see if there is a relationship between the summer temperature and the amount
of electricity used (in kilowatts).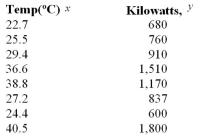
If a correlation coefficient calculated for n = 14 and is found to be r = 0.856, what is the test value for the t - test?
A)4.059
B)5.736
C)2.851
D)6.374
of electricity used (in kilowatts).
If a correlation coefficient calculated for n = 14 and
is found to be r = 0.856, what is the test value for the t - test?A)4.059
B)5.736
C)2.851
D)6.374
سؤال
A study was conducted to determine if there was a relationship between the prices a non-member of a club paid for various publications and the prices that a member paid for the same publications.The data
Collected is shown below.Determine the value of
A)13,251
B)93,624
C)19,712
D)9349
Collected is shown below.Determine the value of
A)13,251
B)93,624
C)19,712
D)9349
سؤال
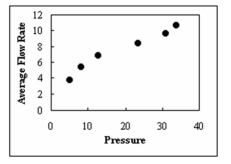
Daniel Wiseman, a scientist for Gres-Trans Corp., wants to determine if the flow rate of a particular material changes with different changes in temperature.The data is plotted in the figure
Below.What type of relationship exists between the flow rate and the change in temperature?
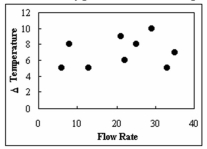
A)negative
B)positive
C)There is no relationship.
D)curvilinear
Below.What type of relationship exists between the flow rate and the change in temperature?
A)negative
B)positive
C)There is no relationship.
D)curvilinear
سؤال
Compute the correlation coefficient for the data below 
A)-0.484
B)0.235
C)0.000
D)-0.323
A)-0.484
B)0.235
C)0.000
D)-0.323
سؤال
Compute the correlation coefficient for the data below 
A)0.521
B)0.368
C)-0.271
D)-0.058
A)0.521
B)0.368
C)-0.271
D)-0.058
سؤال
سؤال
If r = -0.879 and n = 6, test the significance of the correlation coefficient at 
A)
B)
C)
D)
A)
B)
C)
D)
سؤال
 Determine the type of relationship shown in the figure below.
A)positive
B)negative
C)multiple
D)There is no relationship.
سؤال
The equation of a regression line is  .What is the intercept of this line?
A)-4.6
B)3.2
C)4.6
D)0
.What is the intercept of this line?A)-4.6
B)3.2
C)4.6
D)0
سؤال
Compute the correlation coefficient for the data below 
A)0.123
B)10.857
A)0.123
B)10.857
سؤال
A study was conducted to determine if there was a relationship between the prices a non-member of a club paid for various publications and the prices that a member paid for the same publications.The data
Collected are shown below.Find the value of
A)13,251
B)93,624
C)19,712
D)9349
Collected are shown below.Find the value of
A)13,251
B)93,624
C)19,712
D)9349
سؤال
Compute the correlation coefficient for the data below 
A)0.661
B)-0.437
C)0.467
D)-0.135
A)0.661
B)-0.437
C)0.467
D)-0.135
سؤال
Ten pairs of points yielded a correlation coefficient r of 0.79.If  which of the following statements is correct if
  (Do not calculate a t-value.)
A)Because 0.79 is greater than 0.632, the null hypothesis is not rejected.
B)Because 0.79 is greater than 0.632, the null hypothesis is rejected.
C)Because 0.79 is greater than 0.602, the null hypothesis is not rejected.
D)There is no correlation between the variables.
which of the following statements is correct if (Do not calculate a t-value.)A)Because 0.79 is greater than 0.632, the null hypothesis is not rejected.
B)Because 0.79 is greater than 0.632, the null hypothesis is rejected.
C)Because 0.79 is greater than 0.602, the null hypothesis is not rejected.
D)There is no correlation between the variables.
سؤال
The western city wishes to see if there is a relationship between the summer temperature and the amount
of electricity used (in kilowatts).
A correlation coefficient computed for n = 18 and is r = 0.692.Using the t -test for the correlation coefficient, what are the critical values?
A)+2.120
B)+2.101
C)+1.734
D)+1.746
of electricity used (in kilowatts).
A correlation coefficient computed for n = 18 and
is r = 0.692.Using the t -test for the correlation coefficient, what are the critical values?A)+2.120
B)+2.101
C)+1.734
D)+1.746
سؤال
A study was conducted to determine if there was a relationship between the prices a non-member of a club paid for various publications and the prices that a member paid for the same publications.Which of
The following could not be the value of a correlation coefficient?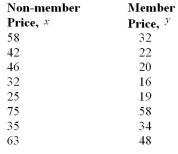
A)-0.683
B)0.197
C)1.000
D)-1.369
The following could not be the value of a correlation coefficient?
A)-0.683
B)0.197
C)1.000
D)-1.369
سؤال
The western city wishes to see if there is a relationship between the summer temperature and the amount
of electricity used (in kilowatts).
Compute the value of the correlation coefficient for the data in the table.
A)0.924
B)0.834
C)0.798
D)0.938
of electricity used (in kilowatts).
Compute the value of the correlation coefficient for the data in the table.
A)0.924
B)0.834
C)0.798
D)0.938
سؤال
Test the significance of the correlation coefficient r at  for the data below.
A)
B)
C)
D)
for the data below. A)
B)
C)
D)
سؤال
سؤال
Compute the standard error of the estimate for the data below. 
A)0.66
B)1.02
C)1.49
D)1.79
A)0.66
B)1.02
C)1.49
D)1.79
سؤال
Compute the slope of the regression line for the data below. 
A)-1.31
B)-0.43
C)0.93
D)-3.06
A)-1.31
B)-0.43
C)0.93
D)-3.06
سؤال
سؤال
Compute the slope of the regression line for the data below. 
A)-0.51
B)-1.43
C)1.01
D)-3.37
A)-0.51
B)-1.43
C)1.01
D)-3.37
سؤال
سؤال
Compute the standard error of the estimate for the data below. 
A)3.36
B)3.93
C)7.06
D)9.07
A)3.36
B)3.93
C)7.06
D)9.07
سؤال
Compute the intercept of the regression line for the data below. 
A)3.54
B)3.87
C)4.15
D)4.87
A)3.54
B)3.87
C)4.15
D)4.87
سؤال
Compute the slope of the regression line for the data below. 
A)-1.93
B)-0.93
C)1.36
D)-4.78
A)-1.93
B)-0.93
C)1.36
D)-4.78
سؤال
سؤال
سؤال
The following data list ages of cars (in years) and monthly repair cost (in dollars).What is the standard error of estimate? 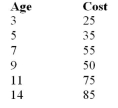
A)6.36
B)7.34
C)8.75
D)5.49
A)6.36
B)7.34
C)8.75
D)5.49
سؤال
Compute the standard error of the estimate for the data below. 
A)11.50
B)3.80
C)14.46
D)7.35
A)11.50
B)3.80
C)14.46
D)7.35
سؤال
Compute the intercept of the regression line for the data below. 
A)0.71
B)3.72
C)3.93
D)9.32
A)0.71
B)3.72
C)3.93
D)9.32
سؤال
سؤال
What is the value of  when x = 3, if the equation of the regression line is
  = 23.1 - 3.8x?
A)4.73
B)5.29
C)34.5
D)11.7
when x = 3, if the equation of the regression line is = 23.1 - 3.8x?A)4.73
B)5.29
C)34.5
D)11.7
سؤال
سؤال
Compute the intercept of the regression line for the data below. 
A)1.38
B)2.90
C)3.77
D)7.54
A)1.38
B)2.90
C)3.77
D)7.54
سؤال
سؤال
What is the equation for the regression line if  ?
?
A)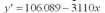
B)
C)
D)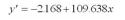
?A)
B)
C)
D)
سؤال
An experiment is carried out to determine the relationship between the average speed
(rpm) and power (hp) of a mixer.Construct a scatter plot for the data obtained in the
experiment.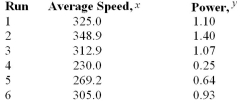
(rpm) and power (hp) of a mixer.Construct a scatter plot for the data obtained in the
experiment.
سؤال
A psychologist wants to determine if there is a linear relationship between the number of hours a
person goes without sleep and the number of mistakes he/she makes on a simple test.The following
data is recorded.Determine the equation of the regression line and graph the line on a scatter
plot.
person goes without sleep and the number of mistakes he/she makes on a simple test.The following
data is recorded.Determine the equation of the regression line and graph the line on a scatter
plot.
سؤال
The standard error of estimate can be used for constructing a(n) __________ interval about a  value.
________________________________________
value.________________________________________
سؤال
سؤال
سؤال
In a multiple regression model 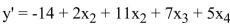 if the value of
  increases by 6 and the value of x3 decreases by 3, then the predicted value for y will
A)increase by 87
B)decrease by 87
C)increase by 45
D)decrease by 45
if the value of increases by 6 and the value of x3 decreases by 3, then the predicted value for y willA)increase by 87
B)decrease by 87
C)increase by 45
D)decrease by 45
سؤال
سؤال
سؤال
An analysis results in a multiple regression equation of 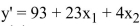 We can conclude that
A)The variable x1 is a very significant factor in this model
B)The variable x1 is a moderately significant factor in this model
C)The variable x1 is not a significant factor in this model
D)This is insufficient information to assess the significance of x1
We can conclude thatA)The variable x1 is a very significant factor in this model
B)The variable x1 is a moderately significant factor in this model
C)The variable x1 is not a significant factor in this model
D)This is insufficient information to assess the significance of x1
سؤال
In a multiple regression model  value changes by 2, then the predicted value for y will change by
A)10
B)32
C)0
D)30
value changes by 2, then the predicted value for y will change byA)10
B)32
C)0
D)30
سؤال
سؤال
A study was conducted to determine if there was a linear relationship between a person's age and his/
her peak heart rate.Construct a scatter plot and determine what type of relationship there is between a
person's age and his/her peak heart rate.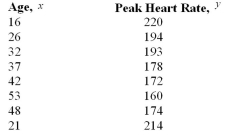
her peak heart rate.Construct a scatter plot and determine what type of relationship there is between a
person's age and his/her peak heart rate.
سؤال
A multiple regression line was calculated in which  was a student's grade point average and
  was a student's age.The multiple regression line was calculated as
 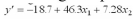 .If a student has a grade
Point average of 5.9 and is 20 years old, what is the predicted value of ?
?
A)387.2
B)400.1
C)421.6
D)615.5
was a student's grade point average and was a student's age.The multiple regression line was calculated as .If a student has a gradePoint average of 5.9 and is 20 years old, what is the predicted value of
?A)387.2
B)400.1
C)421.6
D)615.5
سؤال
سؤال
Draw a scatter plot for the following data that show the demand for a product (in hundreds) and its price
(in dollars) charged in nine different cities.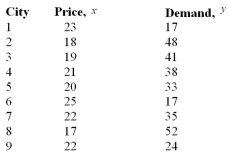
(in dollars) charged in nine different cities.
سؤال
سؤال
سؤال

فتح الحزمة
قم بالتسجيل لفتح البطاقات في هذه المجموعة!
Unlock Deck
Unlock Deck
1/78
العب
ملء الشاشة (f)
Deck 10: Correlation and Regression
1
A regression line was calculated as .The slope of this line is -3.2.
.The slope of this line is -3.2.True
2
The standard error of estimate is the standard deviation of the observed x-values about the predicted values.
values.False
3
With enough variables, it is possible to get an value close to 1, even if the variables have no particular
meaning in the model.
value close to 1, even if the variables have no particularmeaning in the model.
True
4
The range of the correlation coefficient is from 0 to 1.
فتح الحزمة
افتح القفل للوصول البطاقات البالغ عددها 78 في هذه المجموعة.
فتح الحزمة
k this deck
5
A positive relationship exists when both variables increase or decrease at the same time.
فتح الحزمة
افتح القفل للوصول البطاقات البالغ عددها 78 في هذه المجموعة.
فتح الحزمة
k this deck
6
A correlation coefficient of 0.96 would mean that the values of x increase as the values of y decrease.
فتح الحزمة
افتح القفل للوصول البطاقات البالغ عددها 78 في هذه المجموعة.
فتح الحزمة
k this deck
7
When the x-axis and y-axis have been truncated, the y-intercept can be used to graph the regression
line.
line.
فتح الحزمة
افتح القفل للوصول البطاقات البالغ عددها 78 في هذه المجموعة.
فتح الحزمة
k this deck
8
Using a regression line of , a value of x = 3.6 would result in a predicted value of .
, a value of x = 3.6 would result in a predicted value of . فتح الحزمة
افتح القفل للوصول البطاقات البالغ عددها 78 في هذه المجموعة.
فتح الحزمة
k this deck
9
If one found that the sum of the residuals from a regression line (with an intercept) was a large negative
value, one could conclude that there is a negative relationship between the independent and dependent
variables.
There must have been a calculation error since the residuals sum to 0 (apart from rounding error).
value, one could conclude that there is a negative relationship between the independent and dependent
variables.
There must have been a calculation error since the residuals sum to 0 (apart from rounding error).
فتح الحزمة
افتح القفل للوصول البطاقات البالغ عددها 78 في هذه المجموعة.
فتح الحزمة
k this deck
10
The standard error of estimate is the square root of the unexplained variation.
فتح الحزمة
افتح القفل للوصول البطاقات البالغ عددها 78 في هذه المجموعة.
فتح الحزمة
k this deck
11
The symbol used for the multiple correlation coefficient is R.
فتح الحزمة
افتح القفل للوصول البطاقات البالغ عددها 78 في هذه المجموعة.
فتح الحزمة
k this deck
12
If there are three independent variables available, then the value of for a multiple
regression of y using will always be smaller than the value of for a multiple regression of y
using just
available, then the value of for a multipleregression of y using
will always be smaller than the value of for a multiple regression of yusing just
فتح الحزمة
افتح القفل للوصول البطاقات البالغ عددها 78 في هذه المجموعة.
فتح الحزمة
k this deck
13
The two variables in a scatter plot are called the
A)Independent variable and dependent variable
B)Relative frequency and relative proportion
C)Spread and pattern
D)Lines and points
A)Independent variable and dependent variable
B)Relative frequency and relative proportion
C)Spread and pattern
D)Lines and points
فتح الحزمة
افتح القفل للوصول البطاقات البالغ عددها 78 في هذه المجموعة.
فتح الحزمة
k this deck
14
The possible relationship between pairs of data values could be examined from a
A)Histogram
B)Scatter plot
C)Pareto graph
D)Pie chart
A)Histogram
B)Scatter plot
C)Pareto graph
D)Pie chart
فتح الحزمة
افتح القفل للوصول البطاقات البالغ عددها 78 في هذه المجموعة.
فتح الحزمة
k this deck
15
Regression is a statistical method used to describe the nature of the relationship between variables.
فتح الحزمة
افتح القفل للوصول البطاقات البالغ عددها 78 في هذه المجموعة.
فتح الحزمة
k this deck
16
A positive linear relationship exists when the points in a Pareto graph fall approximately in an ascending
straight line.
straight line.
فتح الحزمة
افتح القفل للوصول البطاقات البالغ عددها 78 في هذه المجموعة.
فتح الحزمة
k this deck
17
The population correlation coefficient is computed by using all possible pairs of data values x, y taken
from a population.
from a population.
فتح الحزمة
افتح القفل للوصول البطاقات البالغ عددها 78 في هذه المجموعة.
فتح الحزمة
k this deck
18
If the correlation between two variables is computed to be 0.012, one can conclude that there is
essentially no relation between the two variables.
essentially no relation between the two variables.
فتح الحزمة
افتح القفل للوصول البطاقات البالغ عددها 78 في هذه المجموعة.
فتح الحزمة
k this deck
19
The rounding rule for the correlation coefficient uses two decimal places.
فتح الحزمة
افتح القفل للوصول البطاقات البالغ عددها 78 في هذه المجموعة.
فتح الحزمة
k this deck
20
A regression line can be used to show trends in data.
فتح الحزمة
افتح القفل للوصول البطاقات البالغ عددها 78 في هذه المجموعة.
فتح الحزمة
k this deck
21
Compute the correlation coefficient for the data below
A)0.942
B)-0.347
C)-0.496
D)-0.992
A)0.942
B)-0.347
C)-0.496
D)-0.992
فتح الحزمة
افتح القفل للوصول البطاقات البالغ عددها 78 في هذه المجموعة.
فتح الحزمة
k this deck
22
Test the significance of the correlation coefficient r at for the data below.
A)
B)
C)
D)
for the data below. A)
B)
C)
D)
فتح الحزمة
افتح القفل للوصول البطاقات البالغ عددها 78 في هذه المجموعة.
فتح الحزمة
k this deck
23
A study was conducted to determine if there was a relationship between the prices a non-member of a club paid for various publications and the prices that a member paid for the same publications.The data
Gathered are shown below.What is the value of the correlation coefficient?
A)0.762
B)0.857
C)0.679
D)0.932
Gathered are shown below.What is the value of the correlation coefficient?
A)0.762
B)0.857
C)0.679
D)0.932
فتح الحزمة
افتح القفل للوصول البطاقات البالغ عددها 78 في هذه المجموعة.
فتح الحزمة
k this deck
24
The western city wishes to see if there is a relationship between the summer temperature and the amount
of electricity used (in kilowatts).
If a correlation coefficient calculated for n = 14 and is found to be r = 0.856, what is the test value for the t - test?
A)4.059
B)5.736
C)2.851
D)6.374
of electricity used (in kilowatts).
If a correlation coefficient calculated for n = 14 and
is found to be r = 0.856, what is the test value for the t - test?A)4.059
B)5.736
C)2.851
D)6.374
فتح الحزمة
افتح القفل للوصول البطاقات البالغ عددها 78 في هذه المجموعة.
فتح الحزمة
k this deck
25
A study was conducted to determine if there was a relationship between the prices a non-member of a club paid for various publications and the prices that a member paid for the same publications.The data
Collected is shown below.Determine the value of
A)13,251
B)93,624
C)19,712
D)9349
Collected is shown below.Determine the value of
A)13,251
B)93,624
C)19,712
D)9349
فتح الحزمة
افتح القفل للوصول البطاقات البالغ عددها 78 في هذه المجموعة.
فتح الحزمة
k this deck
26
Daniel Wiseman, a scientist for Gres-Trans Corp., wants to determine if the flow rate of a particular material changes with different changes in temperature.The data is plotted in the figure
Below.What type of relationship exists between the flow rate and the change in temperature?
A)negative
B)positive
C)There is no relationship.
D)curvilinear
Below.What type of relationship exists between the flow rate and the change in temperature?
A)negative
B)positive
C)There is no relationship.
D)curvilinear
فتح الحزمة
افتح القفل للوصول البطاقات البالغ عددها 78 في هذه المجموعة.
فتح الحزمة
k this deck
27
Compute the correlation coefficient for the data below
A)-0.484
B)0.235
C)0.000
D)-0.323
A)-0.484
B)0.235
C)0.000
D)-0.323
فتح الحزمة
افتح القفل للوصول البطاقات البالغ عددها 78 في هذه المجموعة.
فتح الحزمة
k this deck
28
Compute the correlation coefficient for the data below
A)0.521
B)0.368
C)-0.271
D)-0.058
A)0.521
B)0.368
C)-0.271
D)-0.058
فتح الحزمة
افتح القفل للوصول البطاقات البالغ عددها 78 في هذه المجموعة.
فتح الحزمة
k this deck
29
Which of the following does not explain a possible relationship between variables when the null hypothesis is rejected?
A)direct cause-and-effect
B)reverse cause-and-effect
C)caused by a third variable
D)negative effect
A)direct cause-and-effect
B)reverse cause-and-effect
C)caused by a third variable
D)negative effect
فتح الحزمة
افتح القفل للوصول البطاقات البالغ عددها 78 في هذه المجموعة.
فتح الحزمة
k this deck
30
If r = -0.879 and n = 6, test the significance of the correlation coefficient at
A)
B)
C)
D)
A)
B)
C)
D)
فتح الحزمة
افتح القفل للوصول البطاقات البالغ عددها 78 في هذه المجموعة.
فتح الحزمة
k this deck
31
Determine the type of relationship shown in the figure below.A)positive
B)negative
C)multiple
D)There is no relationship.
فتح الحزمة
افتح القفل للوصول البطاقات البالغ عددها 78 في هذه المجموعة.
فتح الحزمة
k this deck
32
The equation of a regression line is .What is the intercept of this line?
A)-4.6
B)3.2
C)4.6
D)0
.What is the intercept of this line?A)-4.6
B)3.2
C)4.6
D)0
فتح الحزمة
افتح القفل للوصول البطاقات البالغ عددها 78 في هذه المجموعة.
فتح الحزمة
k this deck
33
Compute the correlation coefficient for the data below
A)0.123
B)10.857
A)0.123
B)10.857
فتح الحزمة
افتح القفل للوصول البطاقات البالغ عددها 78 في هذه المجموعة.
فتح الحزمة
k this deck
34
A study was conducted to determine if there was a relationship between the prices a non-member of a club paid for various publications and the prices that a member paid for the same publications.The data
Collected are shown below.Find the value of
A)13,251
B)93,624
C)19,712
D)9349
Collected are shown below.Find the value of
A)13,251
B)93,624
C)19,712
D)9349
فتح الحزمة
افتح القفل للوصول البطاقات البالغ عددها 78 في هذه المجموعة.
فتح الحزمة
k this deck
35
Compute the correlation coefficient for the data below
A)0.661
B)-0.437
C)0.467
D)-0.135
A)0.661
B)-0.437
C)0.467
D)-0.135
فتح الحزمة
افتح القفل للوصول البطاقات البالغ عددها 78 في هذه المجموعة.
فتح الحزمة
k this deck
36
Ten pairs of points yielded a correlation coefficient r of 0.79.If which of the following statements is correct if (Do not calculate a t-value.)
A)Because 0.79 is greater than 0.632, the null hypothesis is not rejected.
B)Because 0.79 is greater than 0.632, the null hypothesis is rejected.
C)Because 0.79 is greater than 0.602, the null hypothesis is not rejected.
D)There is no correlation between the variables.
which of the following statements is correct if (Do not calculate a t-value.)A)Because 0.79 is greater than 0.632, the null hypothesis is not rejected.
B)Because 0.79 is greater than 0.632, the null hypothesis is rejected.
C)Because 0.79 is greater than 0.602, the null hypothesis is not rejected.
D)There is no correlation between the variables.
فتح الحزمة
افتح القفل للوصول البطاقات البالغ عددها 78 في هذه المجموعة.
فتح الحزمة
k this deck
37
The western city wishes to see if there is a relationship between the summer temperature and the amount
of electricity used (in kilowatts).
A correlation coefficient computed for n = 18 and is r = 0.692.Using the t -test for the correlation coefficient, what are the critical values?
A)+2.120
B)+2.101
C)+1.734
D)+1.746
of electricity used (in kilowatts).
A correlation coefficient computed for n = 18 and
is r = 0.692.Using the t -test for the correlation coefficient, what are the critical values?A)+2.120
B)+2.101
C)+1.734
D)+1.746
فتح الحزمة
افتح القفل للوصول البطاقات البالغ عددها 78 في هذه المجموعة.
فتح الحزمة
k this deck
38
A study was conducted to determine if there was a relationship between the prices a non-member of a club paid for various publications and the prices that a member paid for the same publications.Which of
The following could not be the value of a correlation coefficient?
A)-0.683
B)0.197
C)1.000
D)-1.369
The following could not be the value of a correlation coefficient?
A)-0.683
B)0.197
C)1.000
D)-1.369
فتح الحزمة
افتح القفل للوصول البطاقات البالغ عددها 78 في هذه المجموعة.
فتح الحزمة
k this deck
39
The western city wishes to see if there is a relationship between the summer temperature and the amount
of electricity used (in kilowatts).
Compute the value of the correlation coefficient for the data in the table.
A)0.924
B)0.834
C)0.798
D)0.938
of electricity used (in kilowatts).
Compute the value of the correlation coefficient for the data in the table.
A)0.924
B)0.834
C)0.798
D)0.938
فتح الحزمة
افتح القفل للوصول البطاقات البالغ عددها 78 في هذه المجموعة.
فتح الحزمة
k this deck
40
Test the significance of the correlation coefficient r at for the data below.
A)
B)
C)
D)
for the data below. A)
B)
C)
D)
فتح الحزمة
افتح القفل للوصول البطاقات البالغ عددها 78 في هذه المجموعة.
فتح الحزمة
k this deck
41
If the equation for the regression line is y = -4x + 6, then the slope of this line is
A)12
B)6
C)2
D)-4
A)12
B)6
C)2
D)-4
فتح الحزمة
افتح القفل للوصول البطاقات البالغ عددها 78 في هذه المجموعة.
فتح الحزمة
k this deck
42
Compute the standard error of the estimate for the data below.
A)0.66
B)1.02
C)1.49
D)1.79
A)0.66
B)1.02
C)1.49
D)1.79
فتح الحزمة
افتح القفل للوصول البطاقات البالغ عددها 78 في هذه المجموعة.
فتح الحزمة
k this deck
43
Compute the slope of the regression line for the data below.
A)-1.31
B)-0.43
C)0.93
D)-3.06
A)-1.31
B)-0.43
C)0.93
D)-3.06
فتح الحزمة
افتح القفل للوصول البطاقات البالغ عددها 78 في هذه المجموعة.
فتح الحزمة
k this deck
44
If the equation for the regression line is y = 7x - 6, then a value of x = 3 will result in a predicted value for y of
A)13
B)25
C)27
D)15
A)13
B)25
C)27
D)15
فتح الحزمة
افتح القفل للوصول البطاقات البالغ عددها 78 في هذه المجموعة.
فتح الحزمة
k this deck
45
Compute the slope of the regression line for the data below.
A)-0.51
B)-1.43
C)1.01
D)-3.37
A)-0.51
B)-1.43
C)1.01
D)-3.37
فتح الحزمة
افتح القفل للوصول البطاقات البالغ عددها 78 في هذه المجموعة.
فتح الحزمة
k this deck
46
If the equation for the regression line is y = 11x + 2, then a value of x = -3 will result in a predicted value for y of
A)2
B)5
C)-31
D)11
A)2
B)5
C)-31
D)11
فتح الحزمة
افتح القفل للوصول البطاقات البالغ عددها 78 في هذه المجموعة.
فتح الحزمة
k this deck
47
Compute the standard error of the estimate for the data below.
A)3.36
B)3.93
C)7.06
D)9.07
A)3.36
B)3.93
C)7.06
D)9.07
فتح الحزمة
افتح القفل للوصول البطاقات البالغ عددها 78 في هذه المجموعة.
فتح الحزمة
k this deck
48
Compute the intercept of the regression line for the data below.
A)3.54
B)3.87
C)4.15
D)4.87
A)3.54
B)3.87
C)4.15
D)4.87
فتح الحزمة
افتح القفل للوصول البطاقات البالغ عددها 78 في هذه المجموعة.
فتح الحزمة
k this deck
49
Compute the slope of the regression line for the data below.
A)-1.93
B)-0.93
C)1.36
D)-4.78
A)-1.93
B)-0.93
C)1.36
D)-4.78
فتح الحزمة
افتح القفل للوصول البطاقات البالغ عددها 78 في هذه المجموعة.
فتح الحزمة
k this deck
50
If the equation for the regression line is y = -8x + 3, then the intercept of this line is
A)6
B)3
C)-5
D)-8
A)6
B)3
C)-5
D)-8
فتح الحزمة
افتح القفل للوصول البطاقات البالغ عددها 78 في هذه المجموعة.
فتح الحزمة
k this deck
51
If the correlation coefficient r is equal to 0.6, find the coefficient of nondetermination.
A)0.64
B)0.77
C)0.48
D)0.36
A)0.64
B)0.77
C)0.48
D)0.36
فتح الحزمة
افتح القفل للوصول البطاقات البالغ عددها 78 في هذه المجموعة.
فتح الحزمة
k this deck
52
The following data list ages of cars (in years) and monthly repair cost (in dollars).What is the standard error of estimate?
A)6.36
B)7.34
C)8.75
D)5.49
A)6.36
B)7.34
C)8.75
D)5.49
فتح الحزمة
افتح القفل للوصول البطاقات البالغ عددها 78 في هذه المجموعة.
فتح الحزمة
k this deck
53
Compute the standard error of the estimate for the data below.
A)11.50
B)3.80
C)14.46
D)7.35
A)11.50
B)3.80
C)14.46
D)7.35
فتح الحزمة
افتح القفل للوصول البطاقات البالغ عددها 78 في هذه المجموعة.
فتح الحزمة
k this deck
54
Compute the intercept of the regression line for the data below.
A)0.71
B)3.72
C)3.93
D)9.32
A)0.71
B)3.72
C)3.93
D)9.32
فتح الحزمة
افتح القفل للوصول البطاقات البالغ عددها 78 في هذه المجموعة.
فتح الحزمة
k this deck
55
If the correlation coefficient r is equal to 0.66, find the coefficient of determination.
A)The coefficient of determination is 0.56.
B)The coefficient of determination is 0.81.
C)The coefficient of determination is 0.44.
D)The coefficient of determination is 0.19.
A)The coefficient of determination is 0.56.
B)The coefficient of determination is 0.81.
C)The coefficient of determination is 0.44.
D)The coefficient of determination is 0.19.
فتح الحزمة
افتح القفل للوصول البطاقات البالغ عددها 78 في هذه المجموعة.
فتح الحزمة
k this deck
56
What is the value of when x = 3, if the equation of the regression line is = 23.1 - 3.8x?
A)4.73
B)5.29
C)34.5
D)11.7
when x = 3, if the equation of the regression line is = 23.1 - 3.8x?A)4.73
B)5.29
C)34.5
D)11.7
فتح الحزمة
افتح القفل للوصول البطاقات البالغ عددها 78 في هذه المجموعة.
فتح الحزمة
k this deck
57
If the correlation coefficient is 0.79, what is the explained variation?
A)37.6%
B)62.4%
C)79%
D)21%
A)37.6%
B)62.4%
C)79%
D)21%
فتح الحزمة
افتح القفل للوصول البطاقات البالغ عددها 78 في هذه المجموعة.
فتح الحزمة
k this deck
58
Compute the intercept of the regression line for the data below.
A)1.38
B)2.90
C)3.77
D)7.54
A)1.38
B)2.90
C)3.77
D)7.54
فتح الحزمة
افتح القفل للوصول البطاقات البالغ عددها 78 في هذه المجموعة.
فتح الحزمة
k this deck
59
If the correlation coefficient r is equal to 0.48, find the coefficient of determination.
A)0.77
B)0.69
C)0.36
D)0.23
A)0.77
B)0.69
C)0.36
D)0.23
فتح الحزمة
افتح القفل للوصول البطاقات البالغ عددها 78 في هذه المجموعة.
فتح الحزمة
k this deck
60
What is the equation for the regression line if ?
A)
B)
C)
D)
?A)
B)
C)
D)
فتح الحزمة
افتح القفل للوصول البطاقات البالغ عددها 78 في هذه المجموعة.
فتح الحزمة
k this deck
61
An experiment is carried out to determine the relationship between the average speed
(rpm) and power (hp) of a mixer.Construct a scatter plot for the data obtained in the
experiment.
(rpm) and power (hp) of a mixer.Construct a scatter plot for the data obtained in the
experiment.
فتح الحزمة
افتح القفل للوصول البطاقات البالغ عددها 78 في هذه المجموعة.
فتح الحزمة
k this deck
62
A psychologist wants to determine if there is a linear relationship between the number of hours a
person goes without sleep and the number of mistakes he/she makes on a simple test.The following
data is recorded.Determine the equation of the regression line and graph the line on a scatter
plot.
person goes without sleep and the number of mistakes he/she makes on a simple test.The following
data is recorded.Determine the equation of the regression line and graph the line on a scatter
plot.
فتح الحزمة
افتح القفل للوصول البطاقات البالغ عددها 78 في هذه المجموعة.
فتح الحزمة
k this deck
63
The standard error of estimate can be used for constructing a(n) __________ interval about a value.
________________________________________
value.________________________________________
فتح الحزمة
افتح القفل للوصول البطاقات البالغ عددها 78 في هذه المجموعة.
فتح الحزمة
k this deck
64
When r is not significantly different from 0, the best predictor of y is the mean of the __________ of
y.
________________________________________
y.
________________________________________
فتح الحزمة
افتح القفل للوصول البطاقات البالغ عددها 78 في هذه المجموعة.
فتح الحزمة
k this deck
65
A study on the oxygen consumption rate (OCR) of sea cucumbers involved random samples of size 3 at each of the temperatures 10, 11, 12, 13, 14, and 15oC A regression model was fit in order to study
The relationship between OCR and temperature.If one of the analysts converted the temperatures to
Fahrenheit (o F = 32 +(9/5) o C ) the correlation coefficient would be
A)increased by a factor 9/5
B)increased by a factor 5/9
C)unaltered
D)decreased by a factor 9/5
The relationship between OCR and temperature.If one of the analysts converted the temperatures to
Fahrenheit (o F = 32 +(9/5) o C ) the correlation coefficient would be
A)increased by a factor 9/5
B)increased by a factor 5/9
C)unaltered
D)decreased by a factor 9/5
فتح الحزمة
افتح القفل للوصول البطاقات البالغ عددها 78 في هذه المجموعة.
فتح الحزمة
k this deck
66
In a multiple regression model if the value of increases by 6 and the value of x3 decreases by 3, then the predicted value for y will
A)increase by 87
B)decrease by 87
C)increase by 45
D)decrease by 45
if the value of increases by 6 and the value of x3 decreases by 3, then the predicted value for y willA)increase by 87
B)decrease by 87
C)increase by 45
D)decrease by 45
فتح الحزمة
افتح القفل للوصول البطاقات البالغ عددها 78 في هذه المجموعة.
فتح الحزمة
k this deck
67
As a researcher collects more and more data, the 95% prediction intervals in general
A)become narrower and narrower, with the widths getting closer and closer to 0
B)become narrower and narrower, but the widths are always more than approximately 2 times the standard error of the estimate
C)become narrower and narrower, but the widths are always more than approximately 4 times the standard error of the estimate
D)become narrower and narrower, but the widths are always more than approximately 4 times the slope
فتح الحزمة
افتح القفل للوصول البطاقات البالغ عددها 78 في هذه المجموعة.
فتح الحزمة
k this deck
68
For a prediction value of y' from a specific value x, which of the following contribute to the prediction error?
A)The error in estimating the slope
B)The error in estimating the intercept
C)The standard error of the estimate
D)All of the above
A)The error in estimating the slope
B)The error in estimating the intercept
C)The standard error of the estimate
D)All of the above
فتح الحزمة
افتح القفل للوصول البطاقات البالغ عددها 78 في هذه المجموعة.
فتح الحزمة
k this deck
69
An analysis results in a multiple regression equation of We can conclude that
A)The variable x1 is a very significant factor in this model
B)The variable x1 is a moderately significant factor in this model
C)The variable x1 is not a significant factor in this model
D)This is insufficient information to assess the significance of x1
We can conclude thatA)The variable x1 is a very significant factor in this model
B)The variable x1 is a moderately significant factor in this model
C)The variable x1 is not a significant factor in this model
D)This is insufficient information to assess the significance of x1
فتح الحزمة
افتح القفل للوصول البطاقات البالغ عددها 78 في هذه المجموعة.
فتح الحزمة
k this deck
70
In a multiple regression model value changes by 2, then the predicted value for y will change by
A)10
B)32
C)0
D)30
value changes by 2, then the predicted value for y will change byA)10
B)32
C)0
D)30
فتح الحزمة
افتح القفل للوصول البطاقات البالغ عددها 78 في هذه المجموعة.
فتح الحزمة
k this deck
71
If there is a strong negative linear relationship between the variables, the value of __________ will be
close to -1.
________________________________________
close to -1.
________________________________________
فتح الحزمة
افتح القفل للوصول البطاقات البالغ عددها 78 في هذه المجموعة.
فتح الحزمة
k this deck
72
A study was conducted to determine if there was a linear relationship between a person's age and his/
her peak heart rate.Construct a scatter plot and determine what type of relationship there is between a
person's age and his/her peak heart rate.
her peak heart rate.Construct a scatter plot and determine what type of relationship there is between a
person's age and his/her peak heart rate.
فتح الحزمة
افتح القفل للوصول البطاقات البالغ عددها 78 في هذه المجموعة.
فتح الحزمة
k this deck
73
A multiple regression line was calculated in which was a student's grade point average and was a student's age.The multiple regression line was calculated as .If a student has a grade
Point average of 5.9 and is 20 years old, what is the predicted value of ?
A)387.2
B)400.1
C)421.6
D)615.5
was a student's grade point average and was a student's age.The multiple regression line was calculated as .If a student has a gradePoint average of 5.9 and is 20 years old, what is the predicted value of
?A)387.2
B)400.1
C)421.6
D)615.5
فتح الحزمة
افتح القفل للوصول البطاقات البالغ عددها 78 في هذه المجموعة.
فتح الحزمة
k this deck
74
A study on the oxygen consumption rate (OCR) of sea cucumbers involved random samples of size 3 at each of the temperatures 10, 11, 12, 13, 14, and 15oC A regression model was fit in order to study
The relationship between OCR and temperature.The degrees of freedom for testing that there is no
Relationship between OCR and temperature would be
A)5
B)8
C)15
D)16
The relationship between OCR and temperature.The degrees of freedom for testing that there is no
Relationship between OCR and temperature would be
A)5
B)8
C)15
D)16
فتح الحزمة
افتح القفل للوصول البطاقات البالغ عددها 78 في هذه المجموعة.
فتح الحزمة
k this deck
75
Draw a scatter plot for the following data that show the demand for a product (in hundreds) and its price
(in dollars) charged in nine different cities.
(in dollars) charged in nine different cities.
فتح الحزمة
افتح القفل للوصول البطاقات البالغ عددها 78 في هذه المجموعة.
فتح الحزمة
k this deck
76
A correlation coefficient r was calculated to be 0.61.The coefficient of determination would be
approximately __________.
________________________________________
approximately __________.
________________________________________
فتح الحزمة
افتح القفل للوصول البطاقات البالغ عددها 78 في هذه المجموعة.
فتح الحزمة
k this deck
77
__________ is a statistical method used to determine whether a relationship between variables exists.
________________________________________
________________________________________
فتح الحزمة
افتح القفل للوصول البطاقات البالغ عددها 78 في هذه المجموعة.
فتح الحزمة
k this deck
78
A study on the oxygen consumption rate (OCR) of sea cucumbers involved random samples of size 3 at each of the temperatures 10, 11, 12, 13, 14, and 15oC.A regression model was fit in order to study the
Relationship between OCR and temperature.The slope of the regression line was found to be positive.
If one of the analysts converted the temperatures to Fahrenheit (o F = 32 + (9/5) o C) the slope of the
Regression line would be
A)increased by a factor 9/5
B)increased by a factor 5/9
C)unaltered
D)decreased by a factor 9/5
فتح الحزمة
افتح القفل للوصول البطاقات البالغ عددها 78 في هذه المجموعة.
فتح الحزمة
k this deck
فتح الحزمة
افتح القفل للوصول البطاقات البالغ عددها 78 في هذه المجموعة.


