Deck 3: Graphs and Functions
ملء الشاشة (f)
سؤال
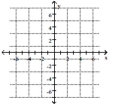
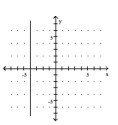
List the ordered pair corresponding to the indicated point. 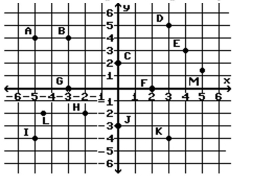
C
A)(1, 2)
B)(0, 2)
C)(2, 1)
D)(2, 0)
C
A)(1, 2)
B)(0, 2)
C)(2, 1)
D)(2, 0)
سؤال
List the ordered pair corresponding to the indicated point.
-L
A)
B)
C)
D)
-L
A)
B)
C)
D)
سؤال
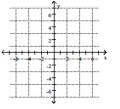
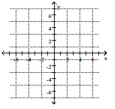
List the ordered pair corresponding to the indicated point.
G
A)(0, 3)
B)(0, -3)
C)(3, 0)
D)(-3, 0)
G
A)(0, 3)
B)(0, -3)
C)(3, 0)
D)(-3, 0)
سؤال
List the ordered pair corresponding to the indicated point.
-M
A)
B)
C)(1 12 , 5)
D)(5, 1 12 )
-M
A)
B)
C)(1 12 , 5)
D)(5, 1 12 )
سؤال
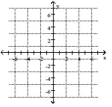
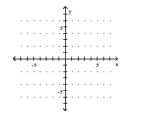
List the ordered pair corresponding to the indicated point.
J
A)(-3, 0)
B)(0, 3)
C)(0, -3)
D)(3, 0)
J
A)(-3, 0)
B)(0, 3)
C)(0, -3)
D)(3, 0)
سؤال
List the ordered pair corresponding to the indicated point.
E
A)(4, 3)
B)(4, 2)
C)(3, 4)
D)(3, -4)
E
A)(4, 3)
B)(4, 2)
C)(3, 4)
D)(3, -4)
سؤال
List the ordered pair corresponding to the indicated point.
B
A)(3, 4)
B)(-3, 4)
C)(4, 3)
D)(4, -3)
B
A)(3, 4)
B)(-3, 4)
C)(4, 3)
D)(4, -3)
سؤال
سؤال
List the ordered pair corresponding to the indicated point.
F
A)(2, 0)
B)(2, 1)
C)(0, 2)
D)(1, 2)
F
A)(2, 0)
B)(2, 1)
C)(0, 2)
D)(1, 2)
سؤال
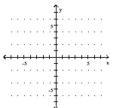
Plot the point.
-
A)
B)
C)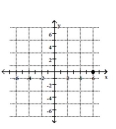
D)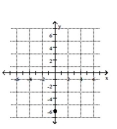
-
A)
B)
C)
D)
سؤال
List the ordered pair corresponding to the indicated point.
I
A)(-5, 4)
B)(-4, 5)
C)(-4, -5)
D)(-5, -4)
I
A)(-5, 4)
B)(-4, 5)
C)(-4, -5)
D)(-5, -4)
سؤال
Plot the point.
-
A)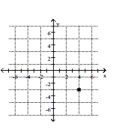
B)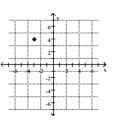
C)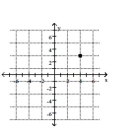
D)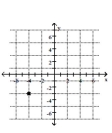
-
A)
B)
C)
D)
سؤال
Plot the point.
(4, 3)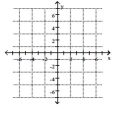
A)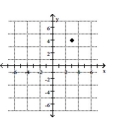
B)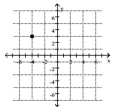
C)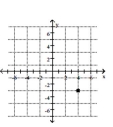
D)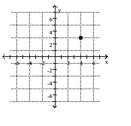
(4, 3)
A)
B)
C)
D)
سؤال
سؤال
سؤال
Plot the point.
-
A)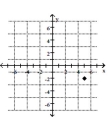
B)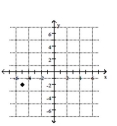
C)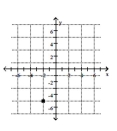
D)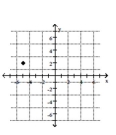
-
A)
B)
C)
D)
سؤال
List the ordered pair corresponding to the indicated point.
D
A)(4, -3)
B)(-3, 4)
C)(3, 5)
D)(5, 3)
D
A)(4, -3)
B)(-3, 4)
C)(3, 5)
D)(5, 3)
سؤال
Plot the point.
-(0, 3)
A)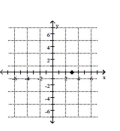
B)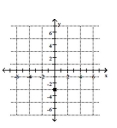
C)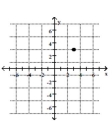
D)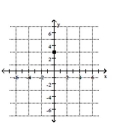
-(0, 3)
A)
B)
C)
D)
سؤال
سؤال
Plot the point.
-
A)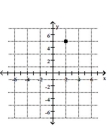
B)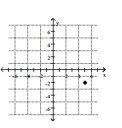
C)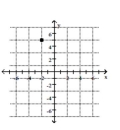
D)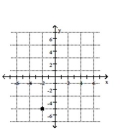
-
A)
B)
C)
D)
سؤال
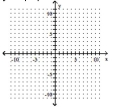
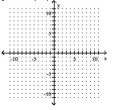
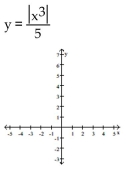
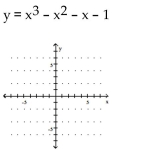
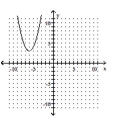
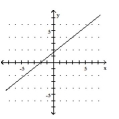
Graph the equation.
-
A)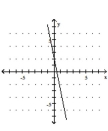
B)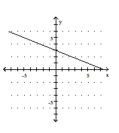
C)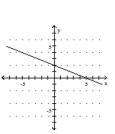
D)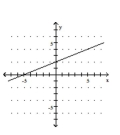
-
A)
B)
C)
D)
سؤال
Graph the equation.
-y = -3x - 1
A)
B)
C)
D)
-y = -3x - 1
A)
B)
C)
D)
سؤال
سؤال
Graph the equation.
-
A)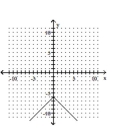
B)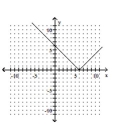
C)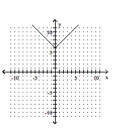
D)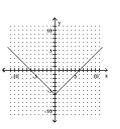
-
A)
B)
C)
D)
سؤال
سؤال
Graph the equation.
-
A)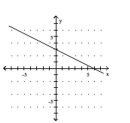
B)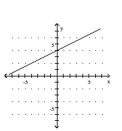
C)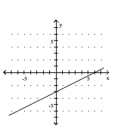
D)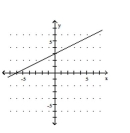
-
A)
B)
C)
D)
سؤال
Graph the equation.
-
A)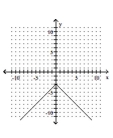
B)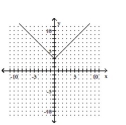
C)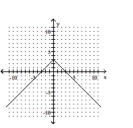
D)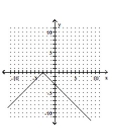
-
A)
B)
C)
D)
سؤال
سؤال
سؤال
Graph the equation.
-
A)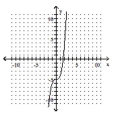
B)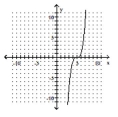
C)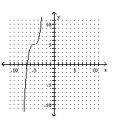
D)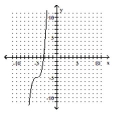
-
A)
B)
C)
D)
سؤال
سؤال
سؤال
Graph the equation.
-
A)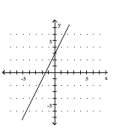
B)
C)
D)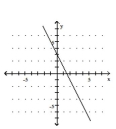
-
A)
B)
C)
D)
سؤال
Graph the equation.
y = x
A)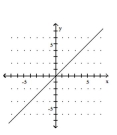
B)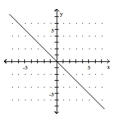
C)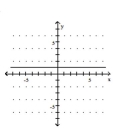
D)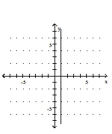
y = x
A)
B)
C)
D)
سؤال
سؤال
سؤال
سؤال
سؤال
Graph the equation.
-
A)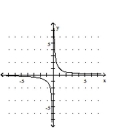
B)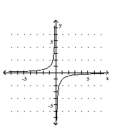
C)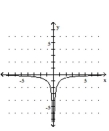
D)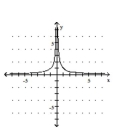
-
A)
B)
C)
D)
سؤال
Graph the equation.
-
A)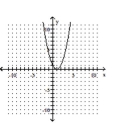
B)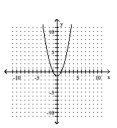
C)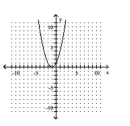
D)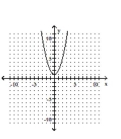
-
A)
B)
C)
D)
سؤال
Write the word or phrase that best completes each statement or answers the question.
Use a calculator to obtain at least eight points that are solutions to the equation. Then graph the equation by plotting
points.
Use a calculator to obtain at least eight points that are solutions to the equation. Then graph the equation by plotting
points.
سؤال
سؤال
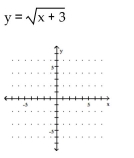
Determine whether the graph illustrated represents a function. Give the domain and range of the relation or function.
-
A)not a function domain: {x | x ? 3} range:
B)not a function domain: range: {y | y ? 3}
C)function domain: {x | x ? 3} range:
D)function domain: range: {y | y ? 3}
-
A)not a function domain: {x | x ? 3} range:
B)not a function domain: range: {y | y ? 3}
C)function domain: {x | x ? 3} range:
D)function domain: range: {y | y ? 3}
سؤال
Graph the equation.
-
A)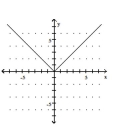
B)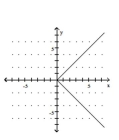
C)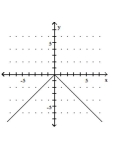
D)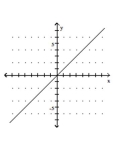
-
A)
B)
C)
D)
سؤال
Determine if the relation illustrated is a function. Give the domain and range of the function or relation.
-pets at home dog
dog
A)not a function
B)function domain: {Alice, Brad, Carl} domain: {snake, cat, dog}
Range: {snake, cat, dog} range: {Alice, Brad, Carl}
C)function
D)not a function domain: {Alice, Brad, Carl} domain: {snake, cat, dog}
Range: {snake, cat, dog} range: {Alice, Brad, Carl}
-pets at home
dogA)not a function
B)function domain: {Alice, Brad, Carl} domain: {snake, cat, dog}
Range: {snake, cat, dog} range: {Alice, Brad, Carl}
C)function
D)not a function domain: {Alice, Brad, Carl} domain: {snake, cat, dog}
Range: {snake, cat, dog} range: {Alice, Brad, Carl}
سؤال
The graph below shows the percentage of students enrolled in the College of Engineering at State University. Use the
graph to answer the question.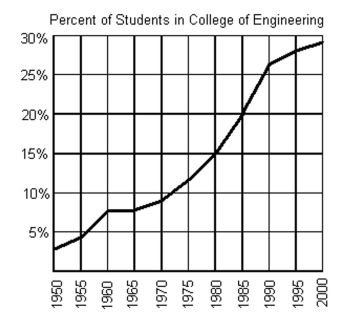
What percentage of the students at State University were enrolled in the College of Engineering in 1965?
A)approximately 8.5%
B)approximately 14%
C)approximately 12%
D)approximately 7%
graph to answer the question.
What percentage of the students at State University were enrolled in the College of Engineering in 1965?
A)approximately 8.5%
B)approximately 14%
C)approximately 12%
D)approximately 7%
سؤال
Write the word or phrase that best completes each statement or answers the question.
Use a calculator to obtain at least eight points that are solutions to the equation. Then graph the equation by plotting
points.
Use a calculator to obtain at least eight points that are solutions to the equation. Then graph the equation by plotting
points.
سؤال
Solve the problem.
Mark started out by walking up a hill for 5 minutes. For the next 5 minutes he walked down a steep hill to an elevation lower than his starting point. For the next 10 minutes he walked on level ground. For the next 10
Minutes he walked uphill. Determine which graph of elevation above sea level versus time matches the given
Situation.
A)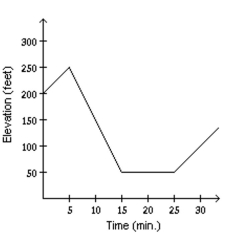
B)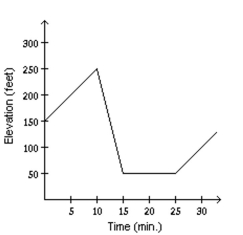
C)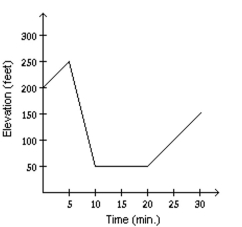
D)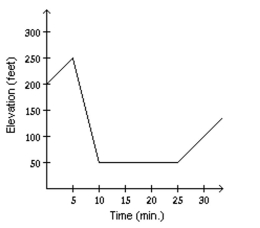
سؤال
Determine whether the graph illustrated represents a function. Give the domain and range of the relation or function.
-
A)not a function
B) domain:domain: range:: range:range:
C)function
D) domain:main: range:range: range::
-
A)not a function
B) domain:domain: range:: range:range:
C)function
D) domain:main: range:range: range::
سؤال
سؤال
Write the word or phrase that best completes each statement or answers the question.
Use a calculator to obtain at least eight points that are solutions to the equation. Then graph the equation by plotting
points.
Use a calculator to obtain at least eight points that are solutions to the equation. Then graph the equation by plotting
points.
سؤال
Determine whether the graph illustrated represents a function. Give the domain and range of the relation or function.
-
A) not a function domain: {-4} range:
B) not a function domain: range: {-4}
C) function domain: range: {-4}
D) function domain: {-4} range:
-
A) not a function domain: {-4} range:
B) not a function domain: range: {-4}
C) function domain: range: {-4}
D) function domain: {-4} range:
سؤال
The graph below shows the percentage of students enrolled in the College of Engineering at State University. Use the
graph to answer the question.
In what year were 28% of the students at State University enrolled in the College of Engineering?
A)1985
B)2000
C)1995
D)1990
graph to answer the question.
In what year were 28% of the students at State University enrolled in the College of Engineering?
A)1985
B)2000
C)1995
D)1990
سؤال
سؤال
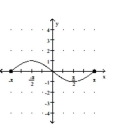
Determine whether the graph illustrated represents a function. Give the domain and range of the relation or function.
-
A)function domain: {x|- 7 < x < 7} range: {y|- 7 < y < 7}
B) not a function domain: range:
C)function domain: range:
D)not a function domain: {x|- 7 < x < 7} range: {y|- 7 < y < 7}
-
A)function domain: {x|- 7 < x < 7} range: {y|- 7 < y < 7}
B) not a function domain: range:
C)function domain: range:
D)not a function domain: {x|- 7 < x < 7} range: {y|- 7 < y < 7}
سؤال
سؤال
Solve the problem.
A freight train traveled at a speed of 50 mph for 3 hours, then stayed in a station for 1 hour, and then traveled 30 mph for 2 hours. Make a graph of distance traveled versus time to match the given situation.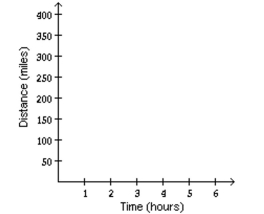
A)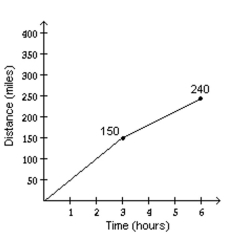
B)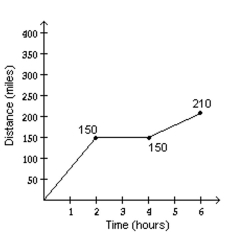
C)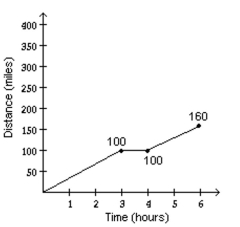
D)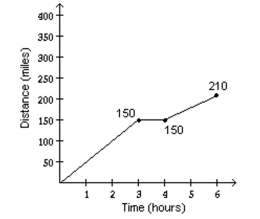
A freight train traveled at a speed of 50 mph for 3 hours, then stayed in a station for 1 hour, and then traveled 30 mph for 2 hours. Make a graph of distance traveled versus time to match the given situation.
A)
B)
C)
D)
سؤال
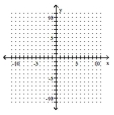
Determine whether the graph illustrated represents a function. Give the domain and range of the relation or function.
-
A)not a function domain: {-2} range:
B)not a function domain: range: {-2}
C)function domain: {-2} range:
D) function domain: range: {-2}
-
A)not a function domain: {-2} range:
B)not a function domain: range: {-2}
C)function domain: {-2} range:
D) function domain: range: {-2}
سؤال
Determine whether the graph illustrated represents a function. Give the domain and range of the relation or function.
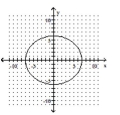
A)not a function domain: {x|-7 ≤ x ≤ 7} range: {y|-6 ≤ y ≤ 6}
B)function domain: {y|-6 ≤ y ≤ 6} range: {x|-7 ≤ x ≤ 7}
C)not a function domain: {y|-6 ≤ y ≤ 6} range: {x|-7 ≤ x ≤ 7}
D)function domain: {x|-7 ≤ x ≤ 7} range: {y|-6 ≤ y ≤ 6}
A)not a function domain: {x|-7 ≤ x ≤ 7} range: {y|-6 ≤ y ≤ 6}
B)function domain: {y|-6 ≤ y ≤ 6} range: {x|-7 ≤ x ≤ 7}
C)not a function domain: {y|-6 ≤ y ≤ 6} range: {x|-7 ≤ x ≤ 7}
D)function domain: {x|-7 ≤ x ≤ 7} range: {y|-6 ≤ y ≤ 6}
سؤال
Write the word or phrase that best completes each statement or answers the question.
Solve the problem.
The population of an endangered species of fish were moved to a controlled habitat to encourage the species to
increase in numbers. When they were moved there were 47 members in the population. In 18 months there
were 209 members in the population, with a growth pattern that was approximately linear. Draw a graph that
fits this data. On the graph, darken the part of the graph where the population is less than or equal to 100
members. Estimate, to the nearest month, how many months passed before the population reached 100.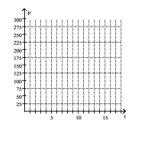

فتح الحزمة
قم بالتسجيل لفتح البطاقات في هذه المجموعة!
Unlock Deck
Unlock Deck
1/61
العب
ملء الشاشة (f)
Deck 3: Graphs and Functions
1
List the ordered pair corresponding to the indicated point.
C
A)(1, 2)
B)(0, 2)
C)(2, 1)
D)(2, 0)
C
A)(1, 2)
B)(0, 2)
C)(2, 1)
D)(2, 0)
(0, 2)
2
List the ordered pair corresponding to the indicated point.
-L
A)
B)
C)
D)
-L
A)
B)
C)
D)
3
List the ordered pair corresponding to the indicated point.
G
A)(0, 3)
B)(0, -3)
C)(3, 0)
D)(-3, 0)
G
A)(0, 3)
B)(0, -3)
C)(3, 0)
D)(-3, 0)
(-3, 0)
4
List the ordered pair corresponding to the indicated point.
-M
A)
B)
C)(1 12 , 5)
D)(5, 1 12 )
-M
A)
B)
C)(1 12 , 5)
D)(5, 1 12 )
فتح الحزمة
افتح القفل للوصول البطاقات البالغ عددها 61 في هذه المجموعة.
فتح الحزمة
k this deck
5
List the ordered pair corresponding to the indicated point.
J
A)(-3, 0)
B)(0, 3)
C)(0, -3)
D)(3, 0)
J
A)(-3, 0)
B)(0, 3)
C)(0, -3)
D)(3, 0)
فتح الحزمة
افتح القفل للوصول البطاقات البالغ عددها 61 في هذه المجموعة.
فتح الحزمة
k this deck
6
List the ordered pair corresponding to the indicated point.
E
A)(4, 3)
B)(4, 2)
C)(3, 4)
D)(3, -4)
E
A)(4, 3)
B)(4, 2)
C)(3, 4)
D)(3, -4)
فتح الحزمة
افتح القفل للوصول البطاقات البالغ عددها 61 في هذه المجموعة.
فتح الحزمة
k this deck
7
List the ordered pair corresponding to the indicated point.
B
A)(3, 4)
B)(-3, 4)
C)(4, 3)
D)(4, -3)
B
A)(3, 4)
B)(-3, 4)
C)(4, 3)
D)(4, -3)
فتح الحزمة
افتح القفل للوصول البطاقات البالغ عددها 61 في هذه المجموعة.
فتح الحزمة
k this deck
8
Determine the quadrant in which the point is located.
(-4, 5)
A)Quadrant I
B)Quadrant II
C)Quadrant III
D)Quadrant IV
(-4, 5)
A)Quadrant I
B)Quadrant II
C)Quadrant III
D)Quadrant IV
فتح الحزمة
افتح القفل للوصول البطاقات البالغ عددها 61 في هذه المجموعة.
فتح الحزمة
k this deck
9
List the ordered pair corresponding to the indicated point.
F
A)(2, 0)
B)(2, 1)
C)(0, 2)
D)(1, 2)
F
A)(2, 0)
B)(2, 1)
C)(0, 2)
D)(1, 2)
فتح الحزمة
افتح القفل للوصول البطاقات البالغ عددها 61 في هذه المجموعة.
فتح الحزمة
k this deck
10
Plot the point.
-
A)
B)
C)
D)
-
A)
B)
C)
D)
فتح الحزمة
افتح القفل للوصول البطاقات البالغ عددها 61 في هذه المجموعة.
فتح الحزمة
k this deck
11
List the ordered pair corresponding to the indicated point.
I
A)(-5, 4)
B)(-4, 5)
C)(-4, -5)
D)(-5, -4)
I
A)(-5, 4)
B)(-4, 5)
C)(-4, -5)
D)(-5, -4)
فتح الحزمة
افتح القفل للوصول البطاقات البالغ عددها 61 في هذه المجموعة.
فتح الحزمة
k this deck
12
Plot the point.
-
A)
B)
C)
D)
-
A)
B)
C)
D)
فتح الحزمة
افتح القفل للوصول البطاقات البالغ عددها 61 في هذه المجموعة.
فتح الحزمة
k this deck
13
Plot the point.
(4, 3)
A)
B)
C)
D)
(4, 3)
A)
B)
C)
D)
فتح الحزمة
افتح القفل للوصول البطاقات البالغ عددها 61 في هذه المجموعة.
فتح الحزمة
k this deck
14
Determine the quadrant in which the point is located.
(2, 1)
A)Quadrant I
B)Quadrant II
C)Quadrant III
D)Quadrant IV
(2, 1)
A)Quadrant I
B)Quadrant II
C)Quadrant III
D)Quadrant IV
فتح الحزمة
افتح القفل للوصول البطاقات البالغ عددها 61 في هذه المجموعة.
فتح الحزمة
k this deck
15
Determine the quadrant in which the point is located.
(-1, -4)
A)Quadrant I
B)Quadrant II
C)Quadrant III
D)Quadrant IV
(-1, -4)
A)Quadrant I
B)Quadrant II
C)Quadrant III
D)Quadrant IV
فتح الحزمة
افتح القفل للوصول البطاقات البالغ عددها 61 في هذه المجموعة.
فتح الحزمة
k this deck
16
Plot the point.
-
A)
B)
C)
D)
-
A)
B)
C)
D)
فتح الحزمة
افتح القفل للوصول البطاقات البالغ عددها 61 في هذه المجموعة.
فتح الحزمة
k this deck
17
List the ordered pair corresponding to the indicated point.
D
A)(4, -3)
B)(-3, 4)
C)(3, 5)
D)(5, 3)
D
A)(4, -3)
B)(-3, 4)
C)(3, 5)
D)(5, 3)
فتح الحزمة
افتح القفل للوصول البطاقات البالغ عددها 61 في هذه المجموعة.
فتح الحزمة
k this deck
18
Plot the point.
-(0, 3)
A)
B)
C)
D)
-(0, 3)
A)
B)
C)
D)
فتح الحزمة
افتح القفل للوصول البطاقات البالغ عددها 61 في هذه المجموعة.
فتح الحزمة
k this deck
19
Determine the quadrant in which the point is located.
(2, -3)
A)Quadrant I
B)Quadrant II
C)Quadrant III
D)Quadrant IV
(2, -3)
A)Quadrant I
B)Quadrant II
C)Quadrant III
D)Quadrant IV
فتح الحزمة
افتح القفل للوصول البطاقات البالغ عددها 61 في هذه المجموعة.
فتح الحزمة
k this deck
20
Plot the point.
-
A)
B)
C)
D)
-
A)
B)
C)
D)
فتح الحزمة
افتح القفل للوصول البطاقات البالغ عددها 61 في هذه المجموعة.
فتح الحزمة
k this deck
21
Graph the equation.
-
A)
B)
C)
D)
-
A)
B)
C)
D)
فتح الحزمة
افتح القفل للوصول البطاقات البالغ عددها 61 في هذه المجموعة.
فتح الحزمة
k this deck
22
Graph the equation.
-y = -3x - 1
A)
B)
C)
D)
-y = -3x - 1
A)
B)
C)
D)
فتح الحزمة
افتح القفل للوصول البطاقات البالغ عددها 61 في هذه المجموعة.
فتح الحزمة
k this deck
23
Determine whether the given ordered pair is a solution to the given equation.
-
A)yes
B)no
-
A)yes
B)no
فتح الحزمة
افتح القفل للوصول البطاقات البالغ عددها 61 في هذه المجموعة.
فتح الحزمة
k this deck
24
Graph the equation.
-
A)
B)
C)
D)
-
A)
B)
C)
D)
فتح الحزمة
افتح القفل للوصول البطاقات البالغ عددها 61 في هذه المجموعة.
فتح الحزمة
k this deck
25
Determine whether the given ordered pair is a solution to the given equation.
-
A)yes
B)no
-
A)yes
B)no
فتح الحزمة
افتح القفل للوصول البطاقات البالغ عددها 61 في هذه المجموعة.
فتح الحزمة
k this deck
26
Graph the equation.
-
A)
B)
C)
D)
-
A)
B)
C)
D)
فتح الحزمة
افتح القفل للوصول البطاقات البالغ عددها 61 في هذه المجموعة.
فتح الحزمة
k this deck
27
Graph the equation.
-
A)
B)
C)
D)
-
A)
B)
C)
D)
فتح الحزمة
افتح القفل للوصول البطاقات البالغ عددها 61 في هذه المجموعة.
فتح الحزمة
k this deck
28
Determine whether the given ordered pair is a solution to the given equation.
(4, 26); y = 7x + 2
A)yes
B)no
(4, 26); y = 7x + 2
A)yes
B)no
فتح الحزمة
افتح القفل للوصول البطاقات البالغ عددها 61 في هذه المجموعة.
فتح الحزمة
k this deck
29
Determine whether the given ordered pair is a solution to the given equation.
-
A)yes
B)no
-
A)yes
B)no
فتح الحزمة
افتح القفل للوصول البطاقات البالغ عددها 61 في هذه المجموعة.
فتح الحزمة
k this deck
30
Graph the equation.
-
A)
B)
C)
D)
-
A)
B)
C)
D)
فتح الحزمة
افتح القفل للوصول البطاقات البالغ عددها 61 في هذه المجموعة.
فتح الحزمة
k this deck
31
Determine whether the given ordered pair is a solution to the given equation.
-
A)yes
B)no
-
A)yes
B)no
فتح الحزمة
افتح القفل للوصول البطاقات البالغ عددها 61 في هذه المجموعة.
فتح الحزمة
k this deck
32
Determine whether the given ordered pair is a solution to the given equation.
-
A)yes
B)no
-
A)yes
B)no
فتح الحزمة
افتح القفل للوصول البطاقات البالغ عددها 61 في هذه المجموعة.
فتح الحزمة
k this deck
33
Graph the equation.
-
A)
B)
C)
D)
-
A)
B)
C)
D)
فتح الحزمة
افتح القفل للوصول البطاقات البالغ عددها 61 في هذه المجموعة.
فتح الحزمة
k this deck
34
Graph the equation.
y = x
A)
B)
C)
D)
y = x
A)
B)
C)
D)
فتح الحزمة
افتح القفل للوصول البطاقات البالغ عددها 61 في هذه المجموعة.
فتح الحزمة
k this deck
35
Determine whether the given ordered pair is a solution to the given equation.
(4, 40); y = 9x + 4
A)yes
B)no
(4, 40); y = 9x + 4
A)yes
B)no
فتح الحزمة
افتح القفل للوصول البطاقات البالغ عددها 61 في هذه المجموعة.
فتح الحزمة
k this deck
36
Determine whether the given ordered pair is a solution to the given equation.
-
A)yes
B)no
-
A)yes
B)no
فتح الحزمة
افتح القفل للوصول البطاقات البالغ عددها 61 في هذه المجموعة.
فتح الحزمة
k this deck
37
Determine whether the given ordered pair is a solution to the given equation.
-
A)yes
B)no
-
A)yes
B)no
فتح الحزمة
افتح القفل للوصول البطاقات البالغ عددها 61 في هذه المجموعة.
فتح الحزمة
k this deck
38
Determine whether the given ordered pair is a solution to the given equation.
-
A)yes
B)no
-
A)yes
B)no
فتح الحزمة
افتح القفل للوصول البطاقات البالغ عددها 61 في هذه المجموعة.
فتح الحزمة
k this deck
39
Graph the equation.
-
A)
B)
C)
D)
-
A)
B)
C)
D)
فتح الحزمة
افتح القفل للوصول البطاقات البالغ عددها 61 في هذه المجموعة.
فتح الحزمة
k this deck
40
Graph the equation.
-
A)
B)
C)
D)
-
A)
B)
C)
D)
فتح الحزمة
افتح القفل للوصول البطاقات البالغ عددها 61 في هذه المجموعة.
فتح الحزمة
k this deck
41
Write the word or phrase that best completes each statement or answers the question.
Use a calculator to obtain at least eight points that are solutions to the equation. Then graph the equation by plotting
points.
Use a calculator to obtain at least eight points that are solutions to the equation. Then graph the equation by plotting
points.
فتح الحزمة
افتح القفل للوصول البطاقات البالغ عددها 61 في هذه المجموعة.
فتح الحزمة
k this deck
42
Write the word or phrase that best completes each statement or answers the question.
Use a calculator to obtain at least eight points that are solutions to the equation. Then graph the equation by plotting
points.
Use a calculator to obtain at least eight points that are solutions to the equation. Then graph the equation by plotting
points.
فتح الحزمة
افتح القفل للوصول البطاقات البالغ عددها 61 في هذه المجموعة.
فتح الحزمة
k this deck
43
Determine if the relation illustrated is a function. Give the domain and range of the function or relation.
-students' academic advisor
A)not a function
B)not a function domain: {Bob, Ann, Dave} domain: {Ms. Lee, Mr. Bar}
Range: {Ms. Lee, Mr. Bar} range: {Bob, Ann, Dave}
C)function
D)function domain: {Bob, Ann, Dave} domain: {Ms. Lee, Mr. Bar}
Range: {Ms. Lee, Mr. Bar} range: {Bob, Ann, Dave}
-students' academic advisor
A)not a function
B)not a function domain: {Bob, Ann, Dave} domain: {Ms. Lee, Mr. Bar}
Range: {Ms. Lee, Mr. Bar} range: {Bob, Ann, Dave}
C)function
D)function domain: {Bob, Ann, Dave} domain: {Ms. Lee, Mr. Bar}
Range: {Ms. Lee, Mr. Bar} range: {Bob, Ann, Dave}
فتح الحزمة
افتح القفل للوصول البطاقات البالغ عددها 61 في هذه المجموعة.
فتح الحزمة
k this deck
44
Determine whether the graph illustrated represents a function. Give the domain and range of the relation or function.
-
A)not a function domain: {x | x ? 3} range:
B)not a function domain: range: {y | y ? 3}
C)function domain: {x | x ? 3} range:
D)function domain: range: {y | y ? 3}
-
A)not a function domain: {x | x ? 3} range:
B)not a function domain: range: {y | y ? 3}
C)function domain: {x | x ? 3} range:
D)function domain: range: {y | y ? 3}
فتح الحزمة
افتح القفل للوصول البطاقات البالغ عددها 61 في هذه المجموعة.
فتح الحزمة
k this deck
45
Graph the equation.
-
A)
B)
C)
D)
-
A)
B)
C)
D)
فتح الحزمة
افتح القفل للوصول البطاقات البالغ عددها 61 في هذه المجموعة.
فتح الحزمة
k this deck
46
Determine if the relation illustrated is a function. Give the domain and range of the function or relation.
-pets at home dog
A)not a function
B)function domain: {Alice, Brad, Carl} domain: {snake, cat, dog}
Range: {snake, cat, dog} range: {Alice, Brad, Carl}
C)function
D)not a function domain: {Alice, Brad, Carl} domain: {snake, cat, dog}
Range: {snake, cat, dog} range: {Alice, Brad, Carl}
-pets at home
dogA)not a function
B)function domain: {Alice, Brad, Carl} domain: {snake, cat, dog}
Range: {snake, cat, dog} range: {Alice, Brad, Carl}
C)function
D)not a function domain: {Alice, Brad, Carl} domain: {snake, cat, dog}
Range: {snake, cat, dog} range: {Alice, Brad, Carl}
فتح الحزمة
افتح القفل للوصول البطاقات البالغ عددها 61 في هذه المجموعة.
فتح الحزمة
k this deck
47
The graph below shows the percentage of students enrolled in the College of Engineering at State University. Use the
graph to answer the question.
What percentage of the students at State University were enrolled in the College of Engineering in 1965?
A)approximately 8.5%
B)approximately 14%
C)approximately 12%
D)approximately 7%
graph to answer the question.
What percentage of the students at State University were enrolled in the College of Engineering in 1965?
A)approximately 8.5%
B)approximately 14%
C)approximately 12%
D)approximately 7%
فتح الحزمة
افتح القفل للوصول البطاقات البالغ عددها 61 في هذه المجموعة.
فتح الحزمة
k this deck
48
Write the word or phrase that best completes each statement or answers the question.
Use a calculator to obtain at least eight points that are solutions to the equation. Then graph the equation by plotting
points.
Use a calculator to obtain at least eight points that are solutions to the equation. Then graph the equation by plotting
points.
فتح الحزمة
افتح القفل للوصول البطاقات البالغ عددها 61 في هذه المجموعة.
فتح الحزمة
k this deck
49
Solve the problem.
Mark started out by walking up a hill for 5 minutes. For the next 5 minutes he walked down a steep hill to an elevation lower than his starting point. For the next 10 minutes he walked on level ground. For the next 10
Minutes he walked uphill. Determine which graph of elevation above sea level versus time matches the given
Situation.
A)
B)
C)
D)
فتح الحزمة
افتح القفل للوصول البطاقات البالغ عددها 61 في هذه المجموعة.
فتح الحزمة
k this deck
50
Determine whether the graph illustrated represents a function. Give the domain and range of the relation or function.
-
A)not a function
B) domain:domain: range:: range:range:
C)function
D) domain:main: range:range: range::
-
A)not a function
B) domain:domain: range:: range:range:
C)function
D) domain:main: range:range: range::
فتح الحزمة
افتح القفل للوصول البطاقات البالغ عددها 61 في هذه المجموعة.
فتح الحزمة
k this deck
51
Determine if the relation illustrated is a function. Give the domain and range of the function or relation.
{(-2, 7), (-1, 4), (0, 3), (1, 4), (3, 12)}
A)function
B)function domain: {7, 4, 3, 12} domain: {-2, -1, 0, 1, 3}
Range: {-2, -1, 0, 1, 3} range: {7, 4, 3, 12}
C)not a function
D)not a function domain: {-2, -1, 0, 1, 3} domain: {7, 4, 3, 12}
Range: {7, 4, 3, 12} range: {-2, -1, 0, 1, 3}
{(-2, 7), (-1, 4), (0, 3), (1, 4), (3, 12)}
A)function
B)function domain: {7, 4, 3, 12} domain: {-2, -1, 0, 1, 3}
Range: {-2, -1, 0, 1, 3} range: {7, 4, 3, 12}
C)not a function
D)not a function domain: {-2, -1, 0, 1, 3} domain: {7, 4, 3, 12}
Range: {7, 4, 3, 12} range: {-2, -1, 0, 1, 3}
فتح الحزمة
افتح القفل للوصول البطاقات البالغ عددها 61 في هذه المجموعة.
فتح الحزمة
k this deck
52
Write the word or phrase that best completes each statement or answers the question.
Use a calculator to obtain at least eight points that are solutions to the equation. Then graph the equation by plotting
points.
Use a calculator to obtain at least eight points that are solutions to the equation. Then graph the equation by plotting
points.
فتح الحزمة
افتح القفل للوصول البطاقات البالغ عددها 61 في هذه المجموعة.
فتح الحزمة
k this deck
53
Determine whether the graph illustrated represents a function. Give the domain and range of the relation or function.
-
A) not a function domain: {-4} range:
B) not a function domain: range: {-4}
C) function domain: range: {-4}
D) function domain: {-4} range:
-
A) not a function domain: {-4} range:
B) not a function domain: range: {-4}
C) function domain: range: {-4}
D) function domain: {-4} range:
فتح الحزمة
افتح القفل للوصول البطاقات البالغ عددها 61 في هذه المجموعة.
فتح الحزمة
k this deck
54
The graph below shows the percentage of students enrolled in the College of Engineering at State University. Use the
graph to answer the question.
In what year were 28% of the students at State University enrolled in the College of Engineering?
A)1985
B)2000
C)1995
D)1990
graph to answer the question.
In what year were 28% of the students at State University enrolled in the College of Engineering?
A)1985
B)2000
C)1995
D)1990
فتح الحزمة
افتح القفل للوصول البطاقات البالغ عددها 61 في هذه المجموعة.
فتح الحزمة
k this deck
55
Determine if the relation illustrated is a function. Give the domain and range of the function or relation.
-five times a number
A)function domain:{15, 20, 25, 30} range: {3, 4, 5, 6}
B)not a function domain:{15, 20, 25, 30} range: {3, 4, 5, 6}
C) function domain: {3, 4, 5, 6} range: {15, 20, 25, 30}
D) not a function domain: {3, 4, 5, 6} range: {15, 20, 25, 30}
-five times a number
A)function domain:{15, 20, 25, 30} range: {3, 4, 5, 6}
B)not a function domain:{15, 20, 25, 30} range: {3, 4, 5, 6}
C) function domain: {3, 4, 5, 6} range: {15, 20, 25, 30}
D) not a function domain: {3, 4, 5, 6} range: {15, 20, 25, 30}
فتح الحزمة
افتح القفل للوصول البطاقات البالغ عددها 61 في هذه المجموعة.
فتح الحزمة
k this deck
56
Determine whether the graph illustrated represents a function. Give the domain and range of the relation or function.
-
A)function domain: {x|- 7 < x < 7} range: {y|- 7 < y < 7}
B) not a function domain: range:
C)function domain: range:
D)not a function domain: {x|- 7 < x < 7} range: {y|- 7 < y < 7}
-
A)function domain: {x|- 7 < x < 7} range: {y|- 7 < y < 7}
B) not a function domain: range:
C)function domain: range:
D)not a function domain: {x|- 7 < x < 7} range: {y|- 7 < y < 7}
فتح الحزمة
افتح القفل للوصول البطاقات البالغ عددها 61 في هذه المجموعة.
فتح الحزمة
k this deck
57
Determine if the relation illustrated is a function. Give the domain and range of the function or relation.
{(11, -4), (-5, -3), (-5, 0), (4, 3), (20, 5)}
A)function
B)function domain: {-4, -3, 0, 3, 5} domain: {11, 4, -5, 20}
Range: {11, 4, -5, 20} range: {-4, -3, 0, 3, 5}
C)not a function
D)not a function domain: {11, 4, -5, 20} domain: {-4, -3, 0, 3, 5}
Range: {-4, -3, 0, 3, 5} range: {11, 4, -5, 20}
{(11, -4), (-5, -3), (-5, 0), (4, 3), (20, 5)}
A)function
B)function domain: {-4, -3, 0, 3, 5} domain: {11, 4, -5, 20}
Range: {11, 4, -5, 20} range: {-4, -3, 0, 3, 5}
C)not a function
D)not a function domain: {11, 4, -5, 20} domain: {-4, -3, 0, 3, 5}
Range: {-4, -3, 0, 3, 5} range: {11, 4, -5, 20}
فتح الحزمة
افتح القفل للوصول البطاقات البالغ عددها 61 في هذه المجموعة.
فتح الحزمة
k this deck
58
Solve the problem.
A freight train traveled at a speed of 50 mph for 3 hours, then stayed in a station for 1 hour, and then traveled 30 mph for 2 hours. Make a graph of distance traveled versus time to match the given situation.
A)
B)
C)
D)
A freight train traveled at a speed of 50 mph for 3 hours, then stayed in a station for 1 hour, and then traveled 30 mph for 2 hours. Make a graph of distance traveled versus time to match the given situation.
A)
B)
C)
D)
فتح الحزمة
افتح القفل للوصول البطاقات البالغ عددها 61 في هذه المجموعة.
فتح الحزمة
k this deck
59
Determine whether the graph illustrated represents a function. Give the domain and range of the relation or function.
-
A)not a function domain: {-2} range:
B)not a function domain: range: {-2}
C)function domain: {-2} range:
D) function domain: range: {-2}
-
A)not a function domain: {-2} range:
B)not a function domain: range: {-2}
C)function domain: {-2} range:
D) function domain: range: {-2}
فتح الحزمة
افتح القفل للوصول البطاقات البالغ عددها 61 في هذه المجموعة.
فتح الحزمة
k this deck
60
Determine whether the graph illustrated represents a function. Give the domain and range of the relation or function.
A)not a function domain: {x|-7 ≤ x ≤ 7} range: {y|-6 ≤ y ≤ 6}
B)function domain: {y|-6 ≤ y ≤ 6} range: {x|-7 ≤ x ≤ 7}
C)not a function domain: {y|-6 ≤ y ≤ 6} range: {x|-7 ≤ x ≤ 7}
D)function domain: {x|-7 ≤ x ≤ 7} range: {y|-6 ≤ y ≤ 6}
A)not a function domain: {x|-7 ≤ x ≤ 7} range: {y|-6 ≤ y ≤ 6}
B)function domain: {y|-6 ≤ y ≤ 6} range: {x|-7 ≤ x ≤ 7}
C)not a function domain: {y|-6 ≤ y ≤ 6} range: {x|-7 ≤ x ≤ 7}
D)function domain: {x|-7 ≤ x ≤ 7} range: {y|-6 ≤ y ≤ 6}
فتح الحزمة
افتح القفل للوصول البطاقات البالغ عددها 61 في هذه المجموعة.
فتح الحزمة
k this deck
61
Write the word or phrase that best completes each statement or answers the question.
Solve the problem.
The population of an endangered species of fish were moved to a controlled habitat to encourage the species to
increase in numbers. When they were moved there were 47 members in the population. In 18 months there
were 209 members in the population, with a growth pattern that was approximately linear. Draw a graph that
fits this data. On the graph, darken the part of the graph where the population is less than or equal to 100
members. Estimate, to the nearest month, how many months passed before the population reached 100.
فتح الحزمة
افتح القفل للوصول البطاقات البالغ عددها 61 في هذه المجموعة.
فتح الحزمة
k this deck
فتح الحزمة
افتح القفل للوصول البطاقات البالغ عددها 61 في هذه المجموعة.


