Deck 9: Correlation and Regression
ملء الشاشة (f)
سؤال
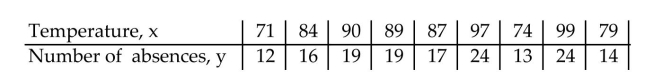
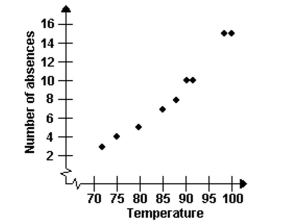
The data below are the temperatures on randomly chosen days during a summer class and the number of
absences on those days. Construct a scatter plot for the data.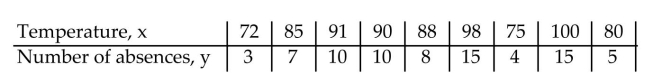
absences on those days. Construct a scatter plot for the data.
سؤال
سؤال
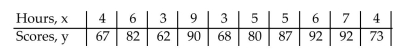
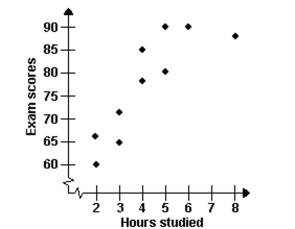
The data below are the final exam scores of 10 randomly selected statistics students and the number of hours
they studied for the exam. Construct a scatter plot for the data.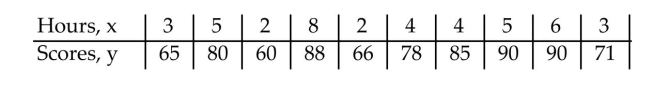
they studied for the exam. Construct a scatter plot for the data.
سؤال
سؤال
In an area of the Midwest, records were kept on the relationship between the rainfall (in inches)and the yield
of wheat (bushels per acre). Construct a scatter plot for the data.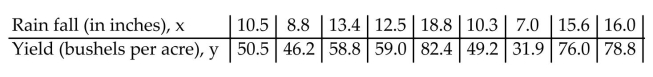
of wheat (bushels per acre). Construct a scatter plot for the data.
سؤال
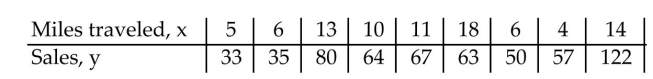
A manager wishes to determine the relationship between the number of miles (in hundreds of miles)the
managerʹs sales representatives travel per month and the amount of sales (in thousands of dollars)per month.
Construct a scatter plot for the data.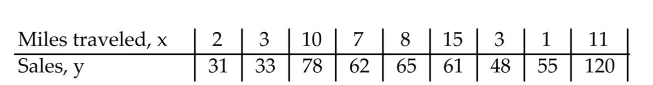
managerʹs sales representatives travel per month and the amount of sales (in thousands of dollars)per month.
Construct a scatter plot for the data.
سؤال
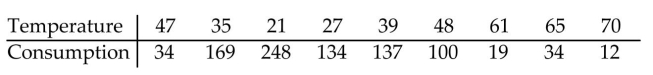
The data below are the average monthly temperatures, in °F, and the monthly natural gas consumption, in ccf,
for a household in northwestern Pennsylvania. Calculate the correlation coefficient, r.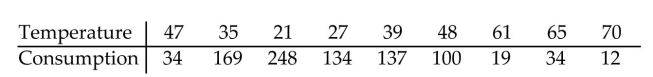
for a household in northwestern Pennsylvania. Calculate the correlation coefficient, r.
سؤال
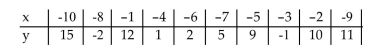
Construct a scatter plot for the given data. Determine whether there is a positive linear correlation, negative
linear correlation, or no linear correlation.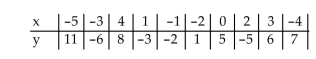
linear correlation, or no linear correlation.
سؤال
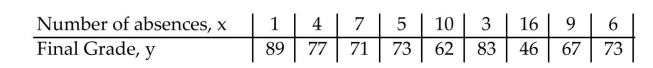
The data below are the number of absences and the final grades of 9 randomly selected students from a
statistics class. Construct a scatter plot for the data.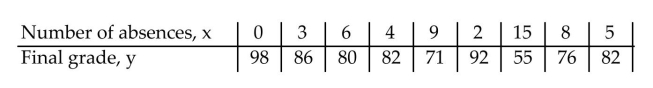
statistics class. Construct a scatter plot for the data.
سؤال
سؤال
سؤال
سؤال
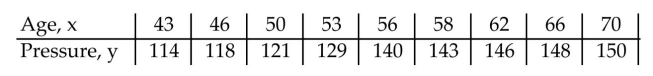
The data below are the ages and systolic blood pressures (measured in millimeters of mercury)of 9 randomly
selected adults. Construct a scatter plot for the data.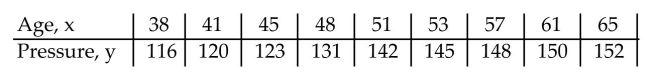
selected adults. Construct a scatter plot for the data.
سؤال
سؤال
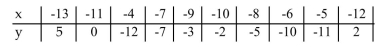
Construct a scatter plot for the given data. Determine whether there is a positive linear correlation, negative
linear correlation, or no linear correlation.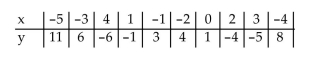
linear correlation, or no linear correlation.
سؤال
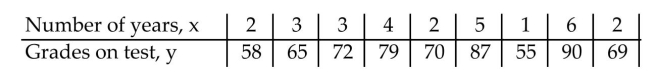
In order for applicants to work for the foreign-service department, they must take a test in the language of the
country where they plan to work. The data below show the relationship between the number of years that
applicants have studied a particular language and the grades they received on the proficiency exam. Construct
a scatter plot for the data.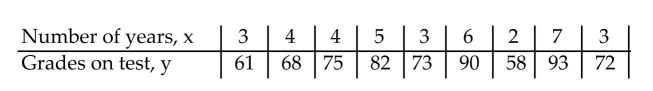
country where they plan to work. The data below show the relationship between the number of years that
applicants have studied a particular language and the grades they received on the proficiency exam. Construct
a scatter plot for the data.
سؤال
سؤال
سؤال
The data below are the gestation periods, in months, of randomly selected animals and their corresponding life
spans, in years. Construct a scatter plot for the data. Determine whether there is a positive linear correlation, a
negative linear correlation, or no linear correlation.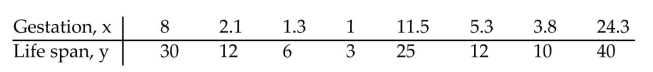
spans, in years. Construct a scatter plot for the data. Determine whether there is a positive linear correlation, a
negative linear correlation, or no linear correlation.
سؤال
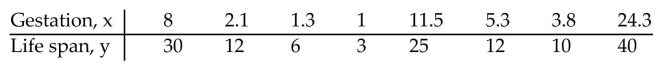
The data below are the gestation periods, in months, of randomly selected animals and their corresponding life
spans, in years. Calculate the correlation coefficient r.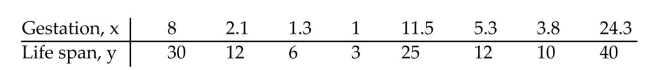
spans, in years. Calculate the correlation coefficient r.
سؤال
سؤال
سؤال
سؤال
Given a sample with r = 0.823 and n = 10, test the significance of the correlation r using α  = 0.05 and the claim
  ρ ρ= 0.
= 0.05 and the claim ρ ρ= 0. سؤال
For the data below, test the significance of the correlation coefficient using α  = 0.05 and the claim ρ
  = 0.
= 0. 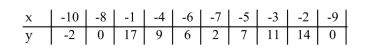
= 0.05 and the claim ρ = 0. سؤال
سؤال
سؤال
سؤال
Given a sample with r = -0.765 and n = 22, test the significance of the correlation r using α  = 0.02 and the claim
  ρ = 0.
= 0.02 and the claim ρ = 0. سؤال
سؤال
Given a sample with r = 0.321 and n = 30, test the significance of the correlation r using α  = 0.10 and the claim
  ρ = 0.
= 0.10 and the claim ρ = 0. سؤال
سؤال
سؤال
سؤال
سؤال
سؤال
Given a sample with r = -0.541, n = 20, test the significance of the correlation r using α  = 0.01 and the claim
  ρ = 0.
= 0.01 and the claim ρ = 0. سؤال
سؤال
سؤال
سؤال
The data below are the number of absences and the final grades of 9 randomly selected students from a
statistics class. Test the significance of the correlation coefficient using α and the claim ρ
statistics class. Test the significance of the correlation coefficient using α
and the claim ρ سؤال
The data below are the gestation periods, in months, of randomly selected animals and their corresponding life
spans, in years. Find the equation of the regression line for the given data.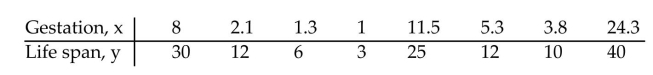 40
40
spans, in years. Find the equation of the regression line for the given data.
40 سؤال
سؤال
The data below are the gestation periods, in months, of randomly selected animals and their corresponding life
spans, in years. Test the significance of the correlation coefficient using α = 0.01 and the claim ρ
 40
40
spans, in years. Test the significance of the correlation coefficient using α
= 0.01 and the claim ρ 40 سؤال
A manager wishes to determine the relationship between the number of miles (in hundreds of miles)the
managerʹs sales representatives travel per month and the amount of sales (in thousands of dollars)per month.
Test the significance of the correlation coefficient using α = 0.01 and the claim ρ
managerʹs sales representatives travel per month and the amount of sales (in thousands of dollars)per month.
Test the significance of the correlation coefficient using α
= 0.01 and the claim ρ سؤال
For the data below, test the significance of the correlation coefficient using α  = 0.10 and the claim ρ
= 0.10 and the claim ρ سؤال
For the data below, test the significance of the correlation coefficient using α  = 0.01 and the claim ρ
= 0.01 and the claim ρ سؤال
سؤال
Calculate the coefficient of correlation, r, letting Row 1 represent the x-values and Row 2 represent the
y-values. Now calculate the coefficient of correlation, r, letting Row 2 represent the x-values and Row 1
represent the y-values. What effect does switching the explanatory and response variables have on the
correlation coefficient?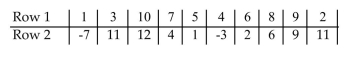
y-values. Now calculate the coefficient of correlation, r, letting Row 2 represent the x-values and Row 1
represent the y-values. What effect does switching the explanatory and response variables have on the
correlation coefficient?
سؤال
سؤال
In order for applicants to work for the foreign-service department, they must take a test in the language of the
country where they plan to work. The data below shows the relationship between the number of years that
applicants have studied a particular language and the grades they received on the proficiency exam. Test the
significance of the correlation coefficient using α = 0.10 and the claim ρ
country where they plan to work. The data below shows the relationship between the number of years that
applicants have studied a particular language and the grades they received on the proficiency exam. Test the
significance of the correlation coefficient using α
= 0.10 and the claim ρ سؤال
سؤال
The data below are the temperatures on randomly chosen days during a summer class and the number of
absences on those days. Test the significance of the correlation coefficient using α = 0.02, and the claim ρ
absences on those days. Test the significance of the correlation coefficient using α
= 0.02, and the claim ρ سؤال
Explain the difference between ∑ 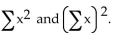
سؤال
The data below are the final exam scores of 10 randomly selected statistics students and the number of hours
they studied for the exam. Test the significance of the correlation coefficient using α and the claim ρ
they studied for the exam. Test the significance of the correlation coefficient using α
and the claim ρ سؤال
سؤال
In an area of the Midwest, records were kept on the relationship between the rainfall (in inches)and the yield
of wheat (bushels per acre). Test the significance of the correlation coefficient using α = 0.01 and the claim ρ

of wheat (bushels per acre). Test the significance of the correlation coefficient using α
= 0.01 and the claim ρ سؤال
The data below are the ages and systolic blood pressures (measured in millimeters of mercury)of 9 randomly
selected adults. Test the significance of the correlation coefficient using α = 0.05 and the claim ρ
selected adults. Test the significance of the correlation coefficient using α
= 0.05 and the claim ρ سؤال
سؤال
The data below are the average monthly temperatures, in  and the monthly natural gas consumption, in ccf,
for a household in northwestern Pennsylvania. Test the significance of the correlation coefficient using α and the claim ρ
and the monthly natural gas consumption, in ccf,for a household in northwestern Pennsylvania. Test the significance of the correlation coefficient using α
and the claim ρ سؤال
The data below are the average monthly temperatures, in  and the monthly natural gas consumption, in ccf,
for a household in northwestern Pennsylvania. Find the equation of the regression line for the given data.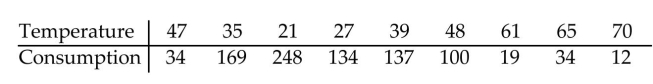
and the monthly natural gas consumption, in ccf,for a household in northwestern Pennsylvania. Find the equation of the regression line for the given data.
سؤال
The data below are the gestation periods, in months, of randomly selected animals and their corresponding life
spans, in years. Use the regression equation to predict the life span, y, for a gestation period of 6 months, x.
Assume the variables x and y have a significant correlation.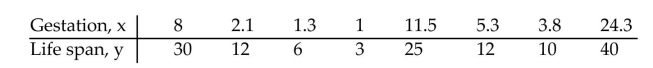
spans, in years. Use the regression equation to predict the life span, y, for a gestation period of 6 months, x.
Assume the variables x and y have a significant correlation.
سؤال
سؤال
سؤال
سؤال
سؤال
سؤال
سؤال
سؤال
سؤال
The data below are the average monthly temperatures, in  and the monthly natural gas consumption, in ccf,
for a household in northwestern Pennsylvania. What is the best-predicted value for the gas consumption, y,
given x = 50°F? Assume that the variables x and y have a significant correlation.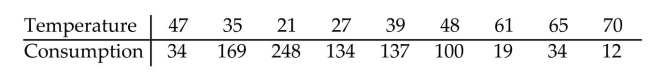
and the monthly natural gas consumption, in ccf,for a household in northwestern Pennsylvania. What is the best-predicted value for the gas consumption, y,
given x = 50°F? Assume that the variables x and y have a significant correlation.
سؤال
سؤال
سؤال
سؤال
سؤال
سؤال
سؤال
سؤال
سؤال

فتح الحزمة
قم بالتسجيل لفتح البطاقات في هذه المجموعة!
Unlock Deck
Unlock Deck
1/118
العب
ملء الشاشة (f)
Deck 9: Correlation and Regression
1
The data below are the temperatures on randomly chosen days during a summer class and the number of
absences on those days. Construct a scatter plot for the data.
absences on those days. Construct a scatter plot for the data.
2
Identify the explanatory variable and the response variable.
A college counselor wants to determine if the number of hours spent studying for a test can be used to predict
the grades on a test.
A college counselor wants to determine if the number of hours spent studying for a test can be used to predict
the grades on a test.
explanatory variable: hours studying; response variable: grades on the test
3
The data below are the final exam scores of 10 randomly selected statistics students and the number of hours
they studied for the exam. Construct a scatter plot for the data.
they studied for the exam. Construct a scatter plot for the data.
4
Calculate the correlation coefficient, r, for the data below.
A)-0.104
B)-0.132
C)-0.549
D)-0.581
A)-0.104
B)-0.132
C)-0.549
D)-0.581
فتح الحزمة
افتح القفل للوصول البطاقات البالغ عددها 118 في هذه المجموعة.
فتح الحزمة
k this deck
5
In an area of the Midwest, records were kept on the relationship between the rainfall (in inches)and the yield
of wheat (bushels per acre). Construct a scatter plot for the data.
of wheat (bushels per acre). Construct a scatter plot for the data.
فتح الحزمة
افتح القفل للوصول البطاقات البالغ عددها 118 في هذه المجموعة.
فتح الحزمة
k this deck
6
A manager wishes to determine the relationship between the number of miles (in hundreds of miles)the
managerʹs sales representatives travel per month and the amount of sales (in thousands of dollars)per month.
Construct a scatter plot for the data.
managerʹs sales representatives travel per month and the amount of sales (in thousands of dollars)per month.
Construct a scatter plot for the data.
فتح الحزمة
افتح القفل للوصول البطاقات البالغ عددها 118 في هذه المجموعة.
فتح الحزمة
k this deck
7
The data below are the average monthly temperatures, in °F, and the monthly natural gas consumption, in ccf,
for a household in northwestern Pennsylvania. Calculate the correlation coefficient, r.
for a household in northwestern Pennsylvania. Calculate the correlation coefficient, r.
فتح الحزمة
افتح القفل للوصول البطاقات البالغ عددها 118 في هذه المجموعة.
فتح الحزمة
k this deck
8
Construct a scatter plot for the given data. Determine whether there is a positive linear correlation, negative
linear correlation, or no linear correlation.
linear correlation, or no linear correlation.
فتح الحزمة
افتح القفل للوصول البطاقات البالغ عددها 118 في هذه المجموعة.
فتح الحزمة
k this deck
9
The data below are the number of absences and the final grades of 9 randomly selected students from a
statistics class. Construct a scatter plot for the data.
statistics class. Construct a scatter plot for the data.
فتح الحزمة
افتح القفل للوصول البطاقات البالغ عددها 118 في هذه المجموعة.
فتح الحزمة
k this deck
10
Given the size of a humanʹs brain, x, and their score on an IQ test, y, would you expect a positive correlation, a negative correlation, or no correlation?
A)no correlation
B)positive correlation
C)negative correlation
A)no correlation
B)positive correlation
C)negative correlation
فتح الحزمة
افتح القفل للوصول البطاقات البالغ عددها 118 في هذه المجموعة.
فتح الحزمة
k this deck
11
Identify the explanatory variable and the response variable.
An agricultural business wants to determine if the rainfall in inches can be used to predict the yield per acre on
a wheat farm.
An agricultural business wants to determine if the rainfall in inches can be used to predict the yield per acre on
a wheat farm.
فتح الحزمة
افتح القفل للوصول البطاقات البالغ عددها 118 في هذه المجموعة.
فتح الحزمة
k this deck
12
Calculate the correlation coefficient, r, for the data below.
A)-0.995
B)-0.671
C)-0.778
D)-0.885
A)-0.995
B)-0.671
C)-0.778
D)-0.885
فتح الحزمة
افتح القفل للوصول البطاقات البالغ عددها 118 في هذه المجموعة.
فتح الحزمة
k this deck
13
The data below are the ages and systolic blood pressures (measured in millimeters of mercury)of 9 randomly
selected adults. Construct a scatter plot for the data.
selected adults. Construct a scatter plot for the data.
فتح الحزمة
افتح القفل للوصول البطاقات البالغ عددها 118 في هذه المجموعة.
فتح الحزمة
k this deck
14
Given the supply of a commodity, x, and the price of a commodity, y, would you expect a positive correlation, a negative correlation, or no correlation?
A)negative correlation
B)positive correlation
C)no correlation
A)negative correlation
B)positive correlation
C)no correlation
فتح الحزمة
افتح القفل للوصول البطاقات البالغ عددها 118 في هذه المجموعة.
فتح الحزمة
k this deck
15
Construct a scatter plot for the given data. Determine whether there is a positive linear correlation, negative
linear correlation, or no linear correlation.
linear correlation, or no linear correlation.
فتح الحزمة
افتح القفل للوصول البطاقات البالغ عددها 118 في هذه المجموعة.
فتح الحزمة
k this deck
16
In order for applicants to work for the foreign-service department, they must take a test in the language of the
country where they plan to work. The data below show the relationship between the number of years that
applicants have studied a particular language and the grades they received on the proficiency exam. Construct
a scatter plot for the data.
country where they plan to work. The data below show the relationship between the number of years that
applicants have studied a particular language and the grades they received on the proficiency exam. Construct
a scatter plot for the data.
فتح الحزمة
افتح القفل للوصول البطاقات البالغ عددها 118 في هذه المجموعة.
فتح الحزمة
k this deck
17
Given the length of a humanʹs femur, x, and the length of a humanʹs humerus, y, would you expect a positive correlation, a negative correlation, or no correlation?
A)positive correlation
B)negative correlation
C)no correlation
A)positive correlation
B)negative correlation
C)no correlation
فتح الحزمة
افتح القفل للوصول البطاقات البالغ عددها 118 في هذه المجموعة.
فتح الحزمة
k this deck
18
Calculate the correlation coefficient, r, for the data below.
A)0.990
B)0.881
C)0.819
D)0.792
A)0.990
B)0.881
C)0.819
D)0.792
فتح الحزمة
افتح القفل للوصول البطاقات البالغ عددها 118 في هذه المجموعة.
فتح الحزمة
k this deck
19
The data below are the gestation periods, in months, of randomly selected animals and their corresponding life
spans, in years. Construct a scatter plot for the data. Determine whether there is a positive linear correlation, a
negative linear correlation, or no linear correlation.
spans, in years. Construct a scatter plot for the data. Determine whether there is a positive linear correlation, a
negative linear correlation, or no linear correlation.
فتح الحزمة
افتح القفل للوصول البطاقات البالغ عددها 118 في هذه المجموعة.
فتح الحزمة
k this deck
20
The data below are the gestation periods, in months, of randomly selected animals and their corresponding life
spans, in years. Calculate the correlation coefficient r.
spans, in years. Calculate the correlation coefficient r.
فتح الحزمة
افتح القفل للوصول البطاقات البالغ عددها 118 في هذه المجموعة.
فتح الحزمة
k this deck
21
The data below are the ages and systolic blood pressures (measured in millimeters of mercury)of 9 randomly selected adults. Calculate the correlation coefficient, r.
A)0.960
B)0.998
C)0.890
D)0.908
A)0.960
B)0.998
C)0.890
D)0.908
فتح الحزمة
افتح القفل للوصول البطاقات البالغ عددها 118 في هذه المجموعة.
فتح الحزمة
k this deck
22
In order for applicants to work for the foreign-service department, they must take a test in the language of the country where they plan to work. The data below shows the relationship between the number of years that
Applicants have studied a particular language and the grades they received on the proficiency exam. Calculate
The correlation coefficient, r.
A)0.934
B)0.911
C)0.891
D)0.902
Applicants have studied a particular language and the grades they received on the proficiency exam. Calculate
The correlation coefficient, r.
A)0.934
B)0.911
C)0.891
D)0.902
فتح الحزمة
افتح القفل للوصول البطاقات البالغ عددها 118 في هذه المجموعة.
فتح الحزمة
k this deck
23
Given a sample with r = 0.823, n = 10, and ? = 0.05, determine the critical values t0 necessary to test the claim ? = 0.
A)
B)
C)
D)
A)
B)
C)
D)
فتح الحزمة
افتح القفل للوصول البطاقات البالغ عددها 118 في هذه المجموعة.
فتح الحزمة
k this deck
24
Given a sample with r = 0.823 and n = 10, test the significance of the correlation r using α = 0.05 and the claim ρ ρ= 0.
= 0.05 and the claim ρ ρ= 0. فتح الحزمة
افتح القفل للوصول البطاقات البالغ عددها 118 في هذه المجموعة.
فتح الحزمة
k this deck
25
For the data below, test the significance of the correlation coefficient using α = 0.05 and the claim ρ = 0.
= 0.05 and the claim ρ = 0. فتح الحزمة
افتح القفل للوصول البطاقات البالغ عددها 118 في هذه المجموعة.
فتح الحزمة
k this deck
26
In an area of the Midwest, records were kept on the relationship between the rainfall (in inches)and the yield of wheat (bushels per acre). Calculate the correlation coefficient, r.
A)0.981
B)0.998
C)0.900
D)0.899
A)0.981
B)0.998
C)0.900
D)0.899
فتح الحزمة
افتح القفل للوصول البطاقات البالغ عددها 118 في هذه المجموعة.
فتح الحزمة
k this deck
27
Given a sample with r = 0.823, n = 10, and ? = 0.05, determine the standardized test statistic t necessary to test the claim ? = 0. Round answers to three decimal places.
A)4.098
B)3.816
C)2.891
D)1.782
A)4.098
B)3.816
C)2.891
D)1.782
فتح الحزمة
افتح القفل للوصول البطاقات البالغ عددها 118 في هذه المجموعة.
فتح الحزمة
k this deck
28
Given a sample with r = -0.541, n = 20, and ? = 0.01, determine the standardized test statistic t necessary to test the claiclaim = 0. Round answers to three decimal places.
A)-2.729
B)-5.132
C)-4.671
D)-3.251
A)-2.729
B)-5.132
C)-4.671
D)-3.251
فتح الحزمة
افتح القفل للوصول البطاقات البالغ عددها 118 في هذه المجموعة.
فتح الحزمة
k this deck
29
Given a sample with r = -0.765 and n = 22, test the significance of the correlation r using α = 0.02 and the claim ρ = 0.
= 0.02 and the claim ρ = 0. فتح الحزمة
افتح القفل للوصول البطاقات البالغ عددها 118 في هذه المجموعة.
فتح الحزمة
k this deck
30
The data below are the temperatures on randomly chosen days during a summer class and the number of absences on those days. Calculate the correlation coefficient, r.
A)0.980
B)0.890
C)0.881
D)0.819
A)0.980
B)0.890
C)0.881
D)0.819
فتح الحزمة
افتح القفل للوصول البطاقات البالغ عددها 118 في هذه المجموعة.
فتح الحزمة
k this deck
31
Given a sample with r = 0.321 and n = 30, test the significance of the correlation r using α = 0.10 and the claim ρ = 0.
= 0.10 and the claim ρ = 0. فتح الحزمة
افتح القفل للوصول البطاقات البالغ عددها 118 في هذه المجموعة.
فتح الحزمة
k this deck
32
Given a sample with r = -0.765, n = 22, and ? = 0.02, determine the critical values necessary to test the claim ? = 0.
A)
B)
C)
D)
A)
B)
C)
D)
فتح الحزمة
افتح القفل للوصول البطاقات البالغ عددها 118 في هذه المجموعة.
فتح الحزمة
k this deck
33
Given a sample with r = -0.541, n = 20, and ? = 0.01, determine the critical values necessary to test the claim ? = 0.
A)
B)
C)
D)
A)
B)
C)
D)
فتح الحزمة
افتح القفل للوصول البطاقات البالغ عددها 118 في هذه المجموعة.
فتح الحزمة
k this deck
34
Given a sample with r = 0.321, n = 30, and ? = 0.10, determine the standardized test statistic t necessary to test the claim ? = 0. Round answers to three decimal places.
A)1.793
B)3.198
C)2.354
D)2.561
A)1.793
B)3.198
C)2.354
D)2.561
فتح الحزمة
افتح القفل للوصول البطاقات البالغ عددها 118 في هذه المجموعة.
فتح الحزمة
k this deck
35
A manager wishes to determine the relationship between the number of miles (in hundreds of miles)the manager?s sales representatives travel per month and the amount of sales (in thousands of dollars)per month.
Calculate the correlation coefficient, r.
A)0.632
B)0.561
C)0.717
D)0.791
Calculate the correlation coefficient, r.
A)0.632
B)0.561
C)0.717
D)0.791
فتح الحزمة
افتح القفل للوصول البطاقات البالغ عددها 118 في هذه المجموعة.
فتح الحزمة
k this deck
36
The data below are the final exam scores of 10 randomly selected statistics students and the number of hours they studied for the exam. Calculate the correlation coefficient r.
A)0.847
B)0.991
C)0.761
D)0.654
A)0.847
B)0.991
C)0.761
D)0.654
فتح الحزمة
افتح القفل للوصول البطاقات البالغ عددها 118 في هذه المجموعة.
فتح الحزمة
k this deck
37
Given a sample with r = -0.541, n = 20, test the significance of the correlation r using α = 0.01 and the claim ρ = 0.
= 0.01 and the claim ρ = 0. فتح الحزمة
افتح القفل للوصول البطاقات البالغ عددها 118 في هذه المجموعة.
فتح الحزمة
k this deck
38
Given a sample with r = 0.321, n = 30, and ? = 0.10, determine the critical values necessary to test the claim ? = 0.
A)
B)
C)
D)
A)
B)
C)
D)
فتح الحزمة
افتح القفل للوصول البطاقات البالغ عددها 118 في هذه المجموعة.
فتح الحزمة
k this deck
39
The data below are the number of absences and the final grades of 9 randomly selected students from a statistics class. Calculate the correlation coefficient, r.
A)-0.991
B)-0.888
C)-0.918
D)-0.899
A)-0.991
B)-0.888
C)-0.918
D)-0.899
فتح الحزمة
افتح القفل للوصول البطاقات البالغ عددها 118 في هذه المجموعة.
فتح الحزمة
k this deck
40
Given a sample with r = -0.765, n = 22, and ? = 0.02, determine the standardized test statistic t necessary to test the claim ? = 0. Round answers to three decimal places.
A)-5.312
B)-4.392
C)-3.783
D)-2.653
A)-5.312
B)-4.392
C)-3.783
D)-2.653
فتح الحزمة
افتح القفل للوصول البطاقات البالغ عددها 118 في هذه المجموعة.
فتح الحزمة
k this deck
41
The data below are the number of absences and the final grades of 9 randomly selected students from a
statistics class. Test the significance of the correlation coefficient using α and the claim ρ
statistics class. Test the significance of the correlation coefficient using α
and the claim ρ فتح الحزمة
افتح القفل للوصول البطاقات البالغ عددها 118 في هذه المجموعة.
فتح الحزمة
k this deck
42
The data below are the gestation periods, in months, of randomly selected animals and their corresponding life
spans, in years. Find the equation of the regression line for the given data. 40
spans, in years. Find the equation of the regression line for the given data.
40 فتح الحزمة
افتح القفل للوصول البطاقات البالغ عددها 118 في هذه المجموعة.
فتح الحزمة
k this deck
43
Find the equation of the regression line for the given data.
A) = 2.097x - 0.552
B) = 0.522x - 2.097
C) = 2.097x + 0.552
D) = -0.552x + 2.097
A) = 2.097x - 0.552
B) = 0.522x - 2.097
C) = 2.097x + 0.552
D) = -0.552x + 2.097
فتح الحزمة
افتح القفل للوصول البطاقات البالغ عددها 118 في هذه المجموعة.
فتح الحزمة
k this deck
44
The data below are the gestation periods, in months, of randomly selected animals and their corresponding life
spans, in years. Test the significance of the correlation coefficient using α = 0.01 and the claim ρ 40
spans, in years. Test the significance of the correlation coefficient using α
= 0.01 and the claim ρ 40 فتح الحزمة
افتح القفل للوصول البطاقات البالغ عددها 118 في هذه المجموعة.
فتح الحزمة
k this deck
45
A manager wishes to determine the relationship between the number of miles (in hundreds of miles)the
managerʹs sales representatives travel per month and the amount of sales (in thousands of dollars)per month.
Test the significance of the correlation coefficient using α = 0.01 and the claim ρ
managerʹs sales representatives travel per month and the amount of sales (in thousands of dollars)per month.
Test the significance of the correlation coefficient using α
= 0.01 and the claim ρ فتح الحزمة
افتح القفل للوصول البطاقات البالغ عددها 118 في هذه المجموعة.
فتح الحزمة
k this deck
46
For the data below, test the significance of the correlation coefficient using α = 0.10 and the claim ρ
= 0.10 and the claim ρ فتح الحزمة
افتح القفل للوصول البطاقات البالغ عددها 118 في هذه المجموعة.
فتح الحزمة
k this deck
47
For the data below, test the significance of the correlation coefficient using α = 0.01 and the claim ρ
= 0.01 and the claim ρ فتح الحزمة
افتح القفل للوصول البطاقات البالغ عددها 118 في هذه المجموعة.
فتح الحزمة
k this deck
48
Find the equation of the regression line for the given data.
A) = -0.206x + 2.097
B) = 2.097x - 0.206
C) = 0.206x - 2.097
D) = -2.097x + 0.206
A) = -0.206x + 2.097
B) = 2.097x - 0.206
C) = 0.206x - 2.097
D) = -2.097x + 0.206
فتح الحزمة
افتح القفل للوصول البطاقات البالغ عددها 118 في هذه المجموعة.
فتح الحزمة
k this deck
49
Calculate the coefficient of correlation, r, letting Row 1 represent the x-values and Row 2 represent the
y-values. Now calculate the coefficient of correlation, r, letting Row 2 represent the x-values and Row 1
represent the y-values. What effect does switching the explanatory and response variables have on the
correlation coefficient?
y-values. Now calculate the coefficient of correlation, r, letting Row 2 represent the x-values and Row 1
represent the y-values. What effect does switching the explanatory and response variables have on the
correlation coefficient?
فتح الحزمة
افتح القفل للوصول البطاقات البالغ عددها 118 في هذه المجموعة.
فتح الحزمة
k this deck
50
If Data A has a correlation coefficient of r = -0.991, and Data B has a correlation coefficient of r = 0.991, which correlation is correct?
A)Data A and Data B have the same strength in linear correlation.
B)Data A has a stronger linear correlation than Data B.
C)Data A has a weaker linear correlation than Data B.
A)Data A and Data B have the same strength in linear correlation.
B)Data A has a stronger linear correlation than Data B.
C)Data A has a weaker linear correlation than Data B.
فتح الحزمة
افتح القفل للوصول البطاقات البالغ عددها 118 في هذه المجموعة.
فتح الحزمة
k this deck
51
In order for applicants to work for the foreign-service department, they must take a test in the language of the
country where they plan to work. The data below shows the relationship between the number of years that
applicants have studied a particular language and the grades they received on the proficiency exam. Test the
significance of the correlation coefficient using α = 0.10 and the claim ρ
country where they plan to work. The data below shows the relationship between the number of years that
applicants have studied a particular language and the grades they received on the proficiency exam. Test the
significance of the correlation coefficient using α
= 0.10 and the claim ρ فتح الحزمة
افتح القفل للوصول البطاقات البالغ عددها 118 في هذه المجموعة.
فتح الحزمة
k this deck
52
The data below are the final exam scores of 10 randomly selected statistics students and the number of hours they studied for the exam. Find the equation of the regression line for the given data.
A) = 5.044x + 56.113
B) = 56.113x - 5.044
C) = -56.113x - 5.044
D) = -5.044x + 56.113
A) = 5.044x + 56.113
B) = 56.113x - 5.044
C) = -56.113x - 5.044
D) = -5.044x + 56.113
فتح الحزمة
افتح القفل للوصول البطاقات البالغ عددها 118 في هذه المجموعة.
فتح الحزمة
k this deck
53
The data below are the temperatures on randomly chosen days during a summer class and the number of
absences on those days. Test the significance of the correlation coefficient using α = 0.02, and the claim ρ
absences on those days. Test the significance of the correlation coefficient using α
= 0.02, and the claim ρ فتح الحزمة
افتح القفل للوصول البطاقات البالغ عددها 118 في هذه المجموعة.
فتح الحزمة
k this deck
54
Explain the difference between ∑
فتح الحزمة
افتح القفل للوصول البطاقات البالغ عددها 118 في هذه المجموعة.
فتح الحزمة
k this deck
55
The data below are the final exam scores of 10 randomly selected statistics students and the number of hours
they studied for the exam. Test the significance of the correlation coefficient using α and the claim ρ
they studied for the exam. Test the significance of the correlation coefficient using α
and the claim ρ فتح الحزمة
افتح القفل للوصول البطاقات البالغ عددها 118 في هذه المجموعة.
فتح الحزمة
k this deck
56
Find the equation of the regression line for the given data.
A) = -1.885x + 0.758
B) = 0.758x + 1.885
C) = -0.758x - 1.885
D) = 1.885x - 0.758
A) = -1.885x + 0.758
B) = 0.758x + 1.885
C) = -0.758x - 1.885
D) = 1.885x - 0.758
فتح الحزمة
افتح القفل للوصول البطاقات البالغ عددها 118 في هذه المجموعة.
فتح الحزمة
k this deck
57
In an area of the Midwest, records were kept on the relationship between the rainfall (in inches)and the yield
of wheat (bushels per acre). Test the significance of the correlation coefficient using α = 0.01 and the claim ρ
of wheat (bushels per acre). Test the significance of the correlation coefficient using α
= 0.01 and the claim ρ فتح الحزمة
افتح القفل للوصول البطاقات البالغ عددها 118 في هذه المجموعة.
فتح الحزمة
k this deck
58
The data below are the ages and systolic blood pressures (measured in millimeters of mercury)of 9 randomly
selected adults. Test the significance of the correlation coefficient using α = 0.05 and the claim ρ
selected adults. Test the significance of the correlation coefficient using α
= 0.05 and the claim ρ فتح الحزمة
افتح القفل للوصول البطاقات البالغ عددها 118 في هذه المجموعة.
فتح الحزمة
k this deck
59
Which of the following values could not represent a correlation coefficient?
A)1.032
B)0
C)0.927
D)-1
A)1.032
B)0
C)0.927
D)-1
فتح الحزمة
افتح القفل للوصول البطاقات البالغ عددها 118 في هذه المجموعة.
فتح الحزمة
k this deck
60
The data below are the average monthly temperatures, in and the monthly natural gas consumption, in ccf,
for a household in northwestern Pennsylvania. Test the significance of the correlation coefficient using α and the claim ρ
and the monthly natural gas consumption, in ccf,for a household in northwestern Pennsylvania. Test the significance of the correlation coefficient using α
and the claim ρ فتح الحزمة
افتح القفل للوصول البطاقات البالغ عددها 118 في هذه المجموعة.
فتح الحزمة
k this deck
61
The data below are the average monthly temperatures, in and the monthly natural gas consumption, in ccf,
for a household in northwestern Pennsylvania. Find the equation of the regression line for the given data.
and the monthly natural gas consumption, in ccf,for a household in northwestern Pennsylvania. Find the equation of the regression line for the given data.
فتح الحزمة
افتح القفل للوصول البطاقات البالغ عددها 118 في هذه المجموعة.
فتح الحزمة
k this deck
62
The data below are the gestation periods, in months, of randomly selected animals and their corresponding life
spans, in years. Use the regression equation to predict the life span, y, for a gestation period of 6 months, x.
Assume the variables x and y have a significant correlation.
spans, in years. Use the regression equation to predict the life span, y, for a gestation period of 6 months, x.
Assume the variables x and y have a significant correlation.
فتح الحزمة
افتح القفل للوصول البطاقات البالغ عددها 118 في هذه المجموعة.
فتح الحزمة
k this deck
63
In order for applicants to work for the foreign-service department, they must take a test in the language of the country where they plan to work. The data below shows the relationship between the number of years that
Applicants have studied a particular language and the grades they received on the proficiency exam. Find the
Equation of the regression line for the given data.
A) = 6.910x + 46.261
B) = 6.910x - 46.261
C) = 46.261x - 6.910
D) = 46.261x + 6.910
Applicants have studied a particular language and the grades they received on the proficiency exam. Find the
Equation of the regression line for the given data.
A) = 6.910x + 46.261
B) = 6.910x - 46.261
C) = 46.261x - 6.910
D) = 46.261x + 6.910
فتح الحزمة
افتح القفل للوصول البطاقات البالغ عددها 118 في هذه المجموعة.
فتح الحزمة
k this deck
64
Given the equation of a regression line is y = -2.5x+ 5.3, what is the best predicted value for y given x = 4.9? Assume that the variables x and y have a significant correlation.
A)-6.95
B)-17.55
C)17.55
D)6.95
A)-6.95
B)-17.55
C)17.55
D)6.95
فتح الحزمة
افتح القفل للوصول البطاقات البالغ عددها 118 في هذه المجموعة.
فتح الحزمة
k this deck
65
In an area of the Midwest, records were kept on the relationship between the rainfall (in inches)and the yield of wheat (bushels per acre). Find the equation of the regression line for the given data.
A) = 4.379x + 4.267
B) = -4.379x + 4.267
C) = 4.267x + 4.379
D) = 4.267x - 4.379
A) = 4.379x + 4.267
B) = -4.379x + 4.267
C) = 4.267x + 4.379
D) = 4.267x - 4.379
فتح الحزمة
افتح القفل للوصول البطاقات البالغ عددها 118 في هذه المجموعة.
فتح الحزمة
k this deck
66
In order for applicants to work for the foreign-service department, they must take a test in the language of the country where they plan to work. The data below show the relationship between the number of years that
Applicants have studied a particular language and the grades they received on the proficiency exam. What is
The best predicted value for y given x = 5.5? Assume that the variables x and y have a significant correlation.
A)84
B)82
C)80
D)86
Applicants have studied a particular language and the grades they received on the proficiency exam. What is
The best predicted value for y given x = 5.5? Assume that the variables x and y have a significant correlation.
A)84
B)82
C)80
D)86
فتح الحزمة
افتح القفل للوصول البطاقات البالغ عددها 118 في هذه المجموعة.
فتح الحزمة
k this deck
67
Use the regression equation to predict the value of y for x = -2.8. Assume that the variables x and y have a significant correlation.
A)-6.424
B)-5.320
C)3.643
D)0.551
A)-6.424
B)-5.320
C)3.643
D)0.551
فتح الحزمة
افتح القفل للوصول البطاقات البالغ عددها 118 في هذه المجموعة.
فتح الحزمة
k this deck
68
The data below are the number of absences and the final grades of 9 randomly selected students from a statistics class. Find the equation of the regression line for the given data.
A)
= -2.755x + 96.139
B) = 96.139x - 2.755
C) = -2.755x - 96.139
D) = -96.139x + 2.755
A)
= -2.755x + 96.139
B) = 96.139x - 2.755
C) = -2.755x - 96.139
D) = -96.139x + 2.755
فتح الحزمة
افتح القفل للوصول البطاقات البالغ عددها 118 في هذه المجموعة.
فتح الحزمة
k this deck
69
The data below are the temperatures on randomly chosen days during a summer class and the number of absences on those days. Find the equation of the regression line for the given data.
A) = 0.449x - 30.27
B) = 30.27x - 0.449
C) = 0.449x + 30.27
D) = 30.27x + 0.449
A) = 0.449x - 30.27
B) = 30.27x - 0.449
C) = 0.449x + 30.27
D) = 30.27x + 0.449
فتح الحزمة
افتح القفل للوصول البطاقات البالغ عددها 118 في هذه المجموعة.
فتح الحزمة
k this deck
70
Given the equation of a regression line is y = 3.5x - 5.4, what is the best predicted value for y given x = -1.2? Assume that the variables x and y have a significant correlation.
A)-9.6
B)12.3
C)-6.9
D)-12.3
A)-9.6
B)12.3
C)-6.9
D)-12.3
فتح الحزمة
افتح القفل للوصول البطاقات البالغ عددها 118 في هذه المجموعة.
فتح الحزمة
k this deck
71
The data below are the average monthly temperatures, in and the monthly natural gas consumption, in ccf,
for a household in northwestern Pennsylvania. What is the best-predicted value for the gas consumption, y,
given x = 50°F? Assume that the variables x and y have a significant correlation.
and the monthly natural gas consumption, in ccf,for a household in northwestern Pennsylvania. What is the best-predicted value for the gas consumption, y,
given x = 50°F? Assume that the variables x and y have a significant correlation.
فتح الحزمة
افتح القفل للوصول البطاقات البالغ عددها 118 في هذه المجموعة.
فتح الحزمة
k this deck
72
The data below are the number of absences and the final grades of 9 randomly selected students from a statistics class. What is the best predicted value for y given x = 10? Assume that the variables x and y have a
Significant correlation.
A)69
B)70
C)71
D)68
Significant correlation.
A)69
B)70
C)71
D)68
فتح الحزمة
افتح القفل للوصول البطاقات البالغ عددها 118 في هذه المجموعة.
فتح الحزمة
k this deck
73
The data below are ages and systolic blood pressures (measured in millimeters of mercury)of 9 randomly selected adults. Find the equation of the regression line for the given data.
A) = 1.488x + 60.461
B) = 60.461x - 1.488
C) = 1.448x - 60.461
D) = 60.461x + 1.488
A) = 1.488x + 60.461
B) = 60.461x - 1.488
C) = 1.448x - 60.461
D) = 60.461x + 1.488
فتح الحزمة
افتح القفل للوصول البطاقات البالغ عددها 118 في هذه المجموعة.
فتح الحزمة
k this deck
74
In an area of the Midwest, records were kept on the relationship between the rainfall (in inches)and the yield of wheat (bushels per acre). Which is the best predicted value for y given x = 7.3? Assume that the variables x
And y have a significant correlation.
A)36.2
B)36.5
C)36.0
D)36.7
And y have a significant correlation.
A)36.2
B)36.5
C)36.0
D)36.7
فتح الحزمة
افتح القفل للوصول البطاقات البالغ عددها 118 في هذه المجموعة.
فتح الحزمة
k this deck
75
A manager wishes to determine the relationship between the number of miles (in hundreds of miles)the manager?s sales representatives travel per month and the amount of sales (in thousands of dollars)per month.
Find the equation of the regression line for the given data.
A) = 3.529x + 37.916
B) = 37.916x - 3.529
C) = 3.529x - 37.916
D) = 37.916x + 3.529
Find the equation of the regression line for the given data.
A) = 3.529x + 37.916
B) = 37.916x - 3.529
C) = 3.529x - 37.916
D) = 37.916x + 3.529
فتح الحزمة
افتح القفل للوصول البطاقات البالغ عددها 118 في هذه المجموعة.
فتح الحزمة
k this deck
76
The data below are the temperatures on randomly chosen days during a summer class and the number of absences on those days. What is the best predicted value for y given x = 84? Assume that the variables x and y
Have a significant correlation.
A)7
B)8
C)9
D)10
Have a significant correlation.
A)7
B)8
C)9
D)10
فتح الحزمة
افتح القفل للوصول البطاقات البالغ عددها 118 في هذه المجموعة.
فتح الحزمة
k this deck
77
The data below are the ages and systolic blood pressures (measured in millimeters of mercury)of 9 randomly selected adults. What is the best predicted value for y given x = 41? Assume that the variables x and y have a
Significant correlation.
A)121
B)123
C)119
D)117
Significant correlation.
A)121
B)123
C)119
D)117
فتح الحزمة
افتح القفل للوصول البطاقات البالغ عددها 118 في هذه المجموعة.
فتح الحزمة
k this deck
78
Use the regression equation to predict the value of y for x = -0.2. Assume that the variables x and y have a significant correlation.
A)1.135
B)0.381
C)-2.037
D)1.733
A)1.135
B)0.381
C)-2.037
D)1.733
فتح الحزمة
افتح القفل للوصول البطاقات البالغ عددها 118 في هذه المجموعة.
فتح الحزمة
k this deck
79
Given the equation of a regression line is y = 3x - 1, what is the best predicted value for y given x = 4? Assume that the variables x and y have a significant correlation.
A)11
B)13
C)1
D)6
A)11
B)13
C)1
D)6
فتح الحزمة
افتح القفل للوصول البطاقات البالغ عددها 118 في هذه المجموعة.
فتح الحزمة
k this deck
80
The data below are the final exam scores of 10 randomly selected statistics students and the number of hours they studied for the exam. What is the best predicted value for y given x = 3? Assume that the variables x and y
Have a significant correlation.
A)71
B)70
C)69
D)72
Have a significant correlation.
A)71
B)70
C)69
D)72
فتح الحزمة
افتح القفل للوصول البطاقات البالغ عددها 118 في هذه المجموعة.
فتح الحزمة
k this deck
فتح الحزمة
افتح القفل للوصول البطاقات البالغ عددها 118 في هذه المجموعة.


