Deck 14: Bivariate Statistical Analysis: Tests of Association
ملء الشاشة (f)
سؤال
سؤال
سؤال
سؤال
سؤال
سؤال
سؤال
سؤال
سؤال
سؤال
سؤال
سؤال
سؤال
سؤال
سؤال
سؤال
سؤال
سؤال
سؤال
سؤال
سؤال
سؤال
سؤال
سؤال
سؤال
سؤال
سؤال
سؤال
سؤال
سؤال
سؤال
سؤال
سؤال
سؤال
سؤال
سؤال
سؤال
سؤال
سؤال
سؤال
سؤال
The correlations table below indicates that: Correlations
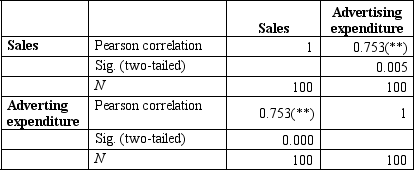 ** Correlation is significant at the 0.01 level (two-tailed).
A) about 75 per cent of variance in sales can be explained by the variance in advertising expenditure.
B) about 57 per cent of the variance in advertising expenditure can be explained by the variance in sales.
C) about 57 per cent of the variance in sales can be explained by the variance in advertising expenditure.
D) about 75 per cent of the variance in advertising expenditure can be explained by the variance in sales.
** Correlation is significant at the 0.01 level (two-tailed).A) about 75 per cent of variance in sales can be explained by the variance in advertising expenditure.
B) about 57 per cent of the variance in advertising expenditure can be explained by the variance in sales.
C) about 57 per cent of the variance in sales can be explained by the variance in advertising expenditure.
D) about 75 per cent of the variance in advertising expenditure can be explained by the variance in sales.
سؤال
سؤال
سؤال
سؤال
سؤال
The formula below is the formula for _______________________. 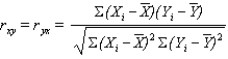
A) the standard error of the estimate
B) the standard error of the mean
C) the coefficient of determination
D) the Pearson's correlation coefficient
A) the standard error of the estimate
B) the standard error of the mean
C) the coefficient of determination
D) the Pearson's correlation coefficient
سؤال
سؤال
سؤال
سؤال
سؤال
سؤال
سؤال
سؤال
سؤال
سؤال
سؤال
In the regression equation, is the symbol for the: 
A) residual error.
B) y-intercept.
C) regression coefficient.
D) standard error of the estimate.
A) residual error.
B) y-intercept.
C) regression coefficient.
D) standard error of the estimate.
سؤال
The correlations table below indicates that: Correlations
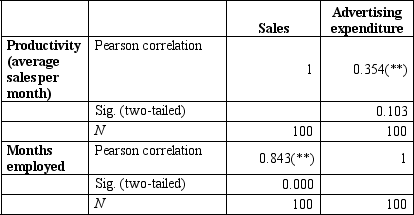 ** Correlation is significant at the 0.01 level (two-tailed).
A) about 35 per cent of variance in productivity can be explained by the variance in months employed.
B) about 71 per cent of the variance in productivity can be explained by the variance in months employed.
C) about 13 per cent of the variance in productivity can be explained by the variance in months employed.
D) there is no association between productivity and months employed.
** Correlation is significant at the 0.01 level (two-tailed).A) about 35 per cent of variance in productivity can be explained by the variance in months employed.
B) about 71 per cent of the variance in productivity can be explained by the variance in months employed.
C) about 13 per cent of the variance in productivity can be explained by the variance in months employed.
D) there is no association between productivity and months employed.
سؤال
سؤال
سؤال
سؤال
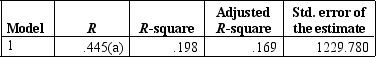
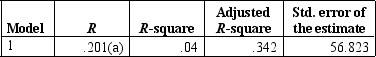
The regression output for sales and advertising spend is shown below. Model summary
 000) Coefficients(a) a Dependent variable: Sales (A a Predictors: (Constant), advertising spend
ANOVA(b)
11eb99e4_52c7_7aad_ab5d_a97cebb53082_TB8823_00 a Predictors: (Constant), advertising spend
B Dependent variable: Sales (A$'000)
Coefficients(a)
11eb99e4_52c7_7aae_ab5d_e1db6a89764e_TB8823_00 a Dependent variable: Sales (A$'000)
The above shows that:
A) approximately 45 per cent of the variance in sales can be explained by advertising spend.
B) approximately 43 per cent of the variance in Sales can be explained by advertising spend.
C) approximately 14 per cent of the variance in sales can be explained by advertising spend.
D) approximately 20 per cent of the variance in sales can be explained by advertising spend.000) The above shows that: A) approximately 45 per cent of the variance in sales can be explained by advertising spend. B) approximately 43 per cent of the variance in Sales can be explained by advertising spend. C) approximately 14 per cent of the variance in sales can be explained by advertising spend. D) approximately 20 per cent of the variance in sales can be explained by advertising spend.
000) Coefficients(a) a Dependent variable: Sales (A a Predictors: (Constant), advertising spendANOVA(b)
11eb99e4_52c7_7aad_ab5d_a97cebb53082_TB8823_00 a Predictors: (Constant), advertising spend
B Dependent variable: Sales (A$'000)
Coefficients(a)
11eb99e4_52c7_7aae_ab5d_e1db6a89764e_TB8823_00 a Dependent variable: Sales (A$'000)
The above shows that:
A) approximately 45 per cent of the variance in sales can be explained by advertising spend.
B) approximately 43 per cent of the variance in Sales can be explained by advertising spend.
C) approximately 14 per cent of the variance in sales can be explained by advertising spend.
D) approximately 20 per cent of the variance in sales can be explained by advertising spend.
" class="answers-bank-image d-block" loading="lazy" > a Predictors: (Constant), advertising spend
ANOVA(b)
11eb99e4_52c7_7aad_ab5d_a97cebb53082_TB8823_00 a Predictors: (Constant), advertising spend
B Dependent variable: Sales (A$'000)
Coefficients(a)
11eb99e4_52c7_7aae_ab5d_e1db6a89764e_TB8823_00 a Dependent variable: Sales (A$'000)
The above shows that:
A) approximately 45 per cent of the variance in sales can be explained by advertising spend.
B) approximately 43 per cent of the variance in Sales can be explained by advertising spend.
C) approximately 14 per cent of the variance in sales can be explained by advertising spend.
D) approximately 20 per cent of the variance in sales can be explained by advertising spend.000) Coefficients(a) a Dependent variable: Sales (A a Predictors: (Constant), advertising spend
ANOVA(b)
11eb99e4_52c7_7aad_ab5d_a97cebb53082_TB8823_00 a Predictors: (Constant), advertising spend
B Dependent variable: Sales (A$'000)
Coefficients(a)
11eb99e4_52c7_7aae_ab5d_e1db6a89764e_TB8823_00 a Dependent variable: Sales (A$'000)
The above shows that:
A) approximately 45 per cent of the variance in sales can be explained by advertising spend.
B) approximately 43 per cent of the variance in Sales can be explained by advertising spend.
C) approximately 14 per cent of the variance in sales can be explained by advertising spend.
D) approximately 20 per cent of the variance in sales can be explained by advertising spend.000) The above shows that: A) approximately 45 per cent of the variance in sales can be explained by advertising spend. B) approximately 43 per cent of the variance in Sales can be explained by advertising spend. C) approximately 14 per cent of the variance in sales can be explained by advertising spend. D) approximately 20 per cent of the variance in sales can be explained by advertising spend.
ANOVA(b)
11eb99e4_52c7_7aad_ab5d_a97cebb53082_TB8823_00 a Predictors: (Constant), advertising spend
B Dependent variable: Sales (A$'000)
Coefficients(a)
11eb99e4_52c7_7aae_ab5d_e1db6a89764e_TB8823_00 a Dependent variable: Sales (A$'000)
The above shows that:
A) approximately 45 per cent of the variance in sales can be explained by advertising spend.
B) approximately 43 per cent of the variance in Sales can be explained by advertising spend.
C) approximately 14 per cent of the variance in sales can be explained by advertising spend.
D) approximately 20 per cent of the variance in sales can be explained by advertising spend.
ANOVA(b)
11eb99e4_52c7_7aad_ab5d_a97cebb53082_TB8823_00 a Predictors: (Constant), advertising spend
B Dependent variable: Sales (A$'000)
Coefficients(a)
11eb99e4_52c7_7aae_ab5d_e1db6a89764e_TB8823_00 a Dependent variable: Sales (A$'000)
The above shows that:
A) approximately 45 per cent of the variance in sales can be explained by advertising spend.
B) approximately 43 per cent of the variance in Sales can be explained by advertising spend.
C) approximately 14 per cent of the variance in sales can be explained by advertising spend.
D) approximately 20 per cent of the variance in sales can be explained by advertising spend.
" class="answers-bank-image d-block" loading="lazy" > a Predictors: (Constant), advertising spend
ANOVA(b)
11eb99e4_52c7_7aad_ab5d_a97cebb53082_TB8823_00 a Predictors: (Constant), advertising spend
B Dependent variable: Sales (A$'000)
Coefficients(a)
11eb99e4_52c7_7aae_ab5d_e1db6a89764e_TB8823_00 a Dependent variable: Sales (A$'000)
The above shows that:
A) approximately 45 per cent of the variance in sales can be explained by advertising spend.
B) approximately 43 per cent of the variance in Sales can be explained by advertising spend.
C) approximately 14 per cent of the variance in sales can be explained by advertising spend.
D) approximately 20 per cent of the variance in sales can be explained by advertising spend.000) The above shows that: A) approximately 45 per cent of the variance in sales can be explained by advertising spend. B) approximately 43 per cent of the variance in Sales can be explained by advertising spend. C) approximately 14 per cent of the variance in sales can be explained by advertising spend. D) approximately 20 per cent of the variance in sales can be explained by advertising spend.
ANOVA(b)
11eb99e4_52c7_7aad_ab5d_a97cebb53082_TB8823_00 a Predictors: (Constant), advertising spend
B Dependent variable: Sales (A$'000)
Coefficients(a)
11eb99e4_52c7_7aae_ab5d_e1db6a89764e_TB8823_00 a Dependent variable: Sales (A$'000)
The above shows that:
A) approximately 45 per cent of the variance in sales can be explained by advertising spend.
B) approximately 43 per cent of the variance in Sales can be explained by advertising spend.
C) approximately 14 per cent of the variance in sales can be explained by advertising spend.
D) approximately 20 per cent of the variance in sales can be explained by advertising spend.
" class="answers-bank-image d-block" loading="lazy" > a Predictors: (Constant), advertising spend
B Dependent variable: Sales (A$'000)
Coefficients(a)
11eb99e4_52c7_7aae_ab5d_e1db6a89764e_TB8823_00 a Dependent variable: Sales (A$'000)
The above shows that:
A) approximately 45 per cent of the variance in sales can be explained by advertising spend.
B) approximately 43 per cent of the variance in Sales can be explained by advertising spend.
C) approximately 14 per cent of the variance in sales can be explained by advertising spend.
D) approximately 20 per cent of the variance in sales can be explained by advertising spend.000) Coefficients(a) a Dependent variable: Sales (A a Predictors: (Constant), advertising spend
ANOVA(b)
11eb99e4_52c7_7aad_ab5d_a97cebb53082_TB8823_00 a Predictors: (Constant), advertising spend
B Dependent variable: Sales (A$'000)
Coefficients(a)
11eb99e4_52c7_7aae_ab5d_e1db6a89764e_TB8823_00 a Dependent variable: Sales (A$'000)
The above shows that:
A) approximately 45 per cent of the variance in sales can be explained by advertising spend.
B) approximately 43 per cent of the variance in Sales can be explained by advertising spend.
C) approximately 14 per cent of the variance in sales can be explained by advertising spend.
D) approximately 20 per cent of the variance in sales can be explained by advertising spend.000) The above shows that: A) approximately 45 per cent of the variance in sales can be explained by advertising spend. B) approximately 43 per cent of the variance in Sales can be explained by advertising spend. C) approximately 14 per cent of the variance in sales can be explained by advertising spend. D) approximately 20 per cent of the variance in sales can be explained by advertising spend.
B Dependent variable: Sales (A$'000)
Coefficients(a)
11eb99e4_52c7_7aae_ab5d_e1db6a89764e_TB8823_00 a Dependent variable: Sales (A$'000)
The above shows that:
A) approximately 45 per cent of the variance in sales can be explained by advertising spend.
B) approximately 43 per cent of the variance in Sales can be explained by advertising spend.
C) approximately 14 per cent of the variance in sales can be explained by advertising spend.
D) approximately 20 per cent of the variance in sales can be explained by advertising spend.
ANOVA(b)
11eb99e4_52c7_7aad_ab5d_a97cebb53082_TB8823_00 a Predictors: (Constant), advertising spend
B Dependent variable: Sales (A$'000)
Coefficients(a)
11eb99e4_52c7_7aae_ab5d_e1db6a89764e_TB8823_00 a Dependent variable: Sales (A$'000)
The above shows that:
A) approximately 45 per cent of the variance in sales can be explained by advertising spend.
B) approximately 43 per cent of the variance in Sales can be explained by advertising spend.
C) approximately 14 per cent of the variance in sales can be explained by advertising spend.
D) approximately 20 per cent of the variance in sales can be explained by advertising spend.
" class="answers-bank-image d-block" loading="lazy" > a Predictors: (Constant), advertising spend
ANOVA(b)
11eb99e4_52c7_7aad_ab5d_a97cebb53082_TB8823_00 a Predictors: (Constant), advertising spend
B Dependent variable: Sales (A$'000)
Coefficients(a)
11eb99e4_52c7_7aae_ab5d_e1db6a89764e_TB8823_00 a Dependent variable: Sales (A$'000)
The above shows that:
A) approximately 45 per cent of the variance in sales can be explained by advertising spend.
B) approximately 43 per cent of the variance in Sales can be explained by advertising spend.
C) approximately 14 per cent of the variance in sales can be explained by advertising spend.
D) approximately 20 per cent of the variance in sales can be explained by advertising spend.000) Coefficients(a) a Dependent variable: Sales (A a Dependent variable: Sales (A$'000)
The above shows that:
A) approximately 45 per cent of the variance in sales can be explained by advertising spend.
B) approximately 43 per cent of the variance in Sales can be explained by advertising spend.
C) approximately 14 per cent of the variance in sales can be explained by advertising spend.
D) approximately 20 per cent of the variance in sales can be explained by advertising spend.000) Coefficients(a) a Dependent variable: Sales (A a Predictors: (Constant), advertising spend
ANOVA(b)
11eb99e4_52c7_7aad_ab5d_a97cebb53082_TB8823_00 a Predictors: (Constant), advertising spend
B Dependent variable: Sales (A$'000)
Coefficients(a)
11eb99e4_52c7_7aae_ab5d_e1db6a89764e_TB8823_00 a Dependent variable: Sales (A$'000)
The above shows that:
A) approximately 45 per cent of the variance in sales can be explained by advertising spend.
B) approximately 43 per cent of the variance in Sales can be explained by advertising spend.
C) approximately 14 per cent of the variance in sales can be explained by advertising spend.
D) approximately 20 per cent of the variance in sales can be explained by advertising spend.000) The above shows that: A) approximately 45 per cent of the variance in sales can be explained by advertising spend. B) approximately 43 per cent of the variance in Sales can be explained by advertising spend. C) approximately 14 per cent of the variance in sales can be explained by advertising spend. D) approximately 20 per cent of the variance in sales can be explained by advertising spend.
ANOVA(b)
11eb99e4_52c7_7aad_ab5d_a97cebb53082_TB8823_00 a Predictors: (Constant), advertising spend
B Dependent variable: Sales (A$'000)
Coefficients(a)
11eb99e4_52c7_7aae_ab5d_e1db6a89764e_TB8823_00 a Dependent variable: Sales (A$'000)
The above shows that:
A) approximately 45 per cent of the variance in sales can be explained by advertising spend.
B) approximately 43 per cent of the variance in Sales can be explained by advertising spend.
C) approximately 14 per cent of the variance in sales can be explained by advertising spend.
D) approximately 20 per cent of the variance in sales can be explained by advertising spend.
ANOVA(b)
11eb99e4_52c7_7aad_ab5d_a97cebb53082_TB8823_00 a Predictors: (Constant), advertising spend
B Dependent variable: Sales (A$'000)
Coefficients(a)
11eb99e4_52c7_7aae_ab5d_e1db6a89764e_TB8823_00 a Dependent variable: Sales (A$'000)
The above shows that:
A) approximately 45 per cent of the variance in sales can be explained by advertising spend.
B) approximately 43 per cent of the variance in Sales can be explained by advertising spend.
C) approximately 14 per cent of the variance in sales can be explained by advertising spend.
D) approximately 20 per cent of the variance in sales can be explained by advertising spend.
" class="answers-bank-image d-block" loading="lazy" > a Predictors: (Constant), advertising spend
ANOVA(b)
11eb99e4_52c7_7aad_ab5d_a97cebb53082_TB8823_00 a Predictors: (Constant), advertising spend
B Dependent variable: Sales (A$'000)
Coefficients(a)
11eb99e4_52c7_7aae_ab5d_e1db6a89764e_TB8823_00 a Dependent variable: Sales (A$'000)
The above shows that:
A) approximately 45 per cent of the variance in sales can be explained by advertising spend.
B) approximately 43 per cent of the variance in Sales can be explained by advertising spend.
C) approximately 14 per cent of the variance in sales can be explained by advertising spend.
D) approximately 20 per cent of the variance in sales can be explained by advertising spend.000) Coefficients(a) a Dependent variable: Sales (A a Predictors: (Constant), advertising spend
ANOVA(b)
11eb99e4_52c7_7aad_ab5d_a97cebb53082_TB8823_00 a Predictors: (Constant), advertising spend
B Dependent variable: Sales (A$'000)
Coefficients(a)
11eb99e4_52c7_7aae_ab5d_e1db6a89764e_TB8823_00 a Dependent variable: Sales (A$'000)
The above shows that:
A) approximately 45 per cent of the variance in sales can be explained by advertising spend.
B) approximately 43 per cent of the variance in Sales can be explained by advertising spend.
C) approximately 14 per cent of the variance in sales can be explained by advertising spend.
D) approximately 20 per cent of the variance in sales can be explained by advertising spend.000) The above shows that: A) approximately 45 per cent of the variance in sales can be explained by advertising spend. B) approximately 43 per cent of the variance in Sales can be explained by advertising spend. C) approximately 14 per cent of the variance in sales can be explained by advertising spend. D) approximately 20 per cent of the variance in sales can be explained by advertising spend.
ANOVA(b)
11eb99e4_52c7_7aad_ab5d_a97cebb53082_TB8823_00 a Predictors: (Constant), advertising spend
B Dependent variable: Sales (A$'000)
Coefficients(a)
11eb99e4_52c7_7aae_ab5d_e1db6a89764e_TB8823_00 a Dependent variable: Sales (A$'000)
The above shows that:
A) approximately 45 per cent of the variance in sales can be explained by advertising spend.
B) approximately 43 per cent of the variance in Sales can be explained by advertising spend.
C) approximately 14 per cent of the variance in sales can be explained by advertising spend.
D) approximately 20 per cent of the variance in sales can be explained by advertising spend.
ANOVA(b)
11eb99e4_52c7_7aad_ab5d_a97cebb53082_TB8823_00 a Predictors: (Constant), advertising spend
B Dependent variable: Sales (A$'000)
Coefficients(a)
11eb99e4_52c7_7aae_ab5d_e1db6a89764e_TB8823_00 a Dependent variable: Sales (A$'000)
The above shows that:
A) approximately 45 per cent of the variance in sales can be explained by advertising spend.
B) approximately 43 per cent of the variance in Sales can be explained by advertising spend.
C) approximately 14 per cent of the variance in sales can be explained by advertising spend.
D) approximately 20 per cent of the variance in sales can be explained by advertising spend.
" class="answers-bank-image d-block" loading="lazy" > a Predictors: (Constant), advertising spend
ANOVA(b)
11eb99e4_52c7_7aad_ab5d_a97cebb53082_TB8823_00 a Predictors: (Constant), advertising spend
B Dependent variable: Sales (A$'000)
Coefficients(a)
11eb99e4_52c7_7aae_ab5d_e1db6a89764e_TB8823_00 a Dependent variable: Sales (A$'000)
The above shows that:
A) approximately 45 per cent of the variance in sales can be explained by advertising spend.
B) approximately 43 per cent of the variance in Sales can be explained by advertising spend.
C) approximately 14 per cent of the variance in sales can be explained by advertising spend.
D) approximately 20 per cent of the variance in sales can be explained by advertising spend.000) The above shows that: A) approximately 45 per cent of the variance in sales can be explained by advertising spend. B) approximately 43 per cent of the variance in Sales can be explained by advertising spend. C) approximately 14 per cent of the variance in sales can be explained by advertising spend. D) approximately 20 per cent of the variance in sales can be explained by advertising spend.
ANOVA(b)
11eb99e4_52c7_7aad_ab5d_a97cebb53082_TB8823_00 a Predictors: (Constant), advertising spend
B Dependent variable: Sales (A$'000)
Coefficients(a)
11eb99e4_52c7_7aae_ab5d_e1db6a89764e_TB8823_00 a Dependent variable: Sales (A$'000)
The above shows that:
A) approximately 45 per cent of the variance in sales can be explained by advertising spend.
B) approximately 43 per cent of the variance in Sales can be explained by advertising spend.
C) approximately 14 per cent of the variance in sales can be explained by advertising spend.
D) approximately 20 per cent of the variance in sales can be explained by advertising spend.
" class="answers-bank-image d-block" loading="lazy" > a Predictors: (Constant), advertising spend
B Dependent variable: Sales (A$'000)
Coefficients(a)
11eb99e4_52c7_7aae_ab5d_e1db6a89764e_TB8823_00 a Dependent variable: Sales (A$'000)
The above shows that:
A) approximately 45 per cent of the variance in sales can be explained by advertising spend.
B) approximately 43 per cent of the variance in Sales can be explained by advertising spend.
C) approximately 14 per cent of the variance in sales can be explained by advertising spend.
D) approximately 20 per cent of the variance in sales can be explained by advertising spend.000) Coefficients(a) a Dependent variable: Sales (A a Predictors: (Constant), advertising spend
ANOVA(b)
11eb99e4_52c7_7aad_ab5d_a97cebb53082_TB8823_00 a Predictors: (Constant), advertising spend
B Dependent variable: Sales (A$'000)
Coefficients(a)
11eb99e4_52c7_7aae_ab5d_e1db6a89764e_TB8823_00 a Dependent variable: Sales (A$'000)
The above shows that:
A) approximately 45 per cent of the variance in sales can be explained by advertising spend.
B) approximately 43 per cent of the variance in Sales can be explained by advertising spend.
C) approximately 14 per cent of the variance in sales can be explained by advertising spend.
D) approximately 20 per cent of the variance in sales can be explained by advertising spend.000) The above shows that: A) approximately 45 per cent of the variance in sales can be explained by advertising spend. B) approximately 43 per cent of the variance in Sales can be explained by advertising spend. C) approximately 14 per cent of the variance in sales can be explained by advertising spend. D) approximately 20 per cent of the variance in sales can be explained by advertising spend.
B Dependent variable: Sales (A$'000)
Coefficients(a)
11eb99e4_52c7_7aae_ab5d_e1db6a89764e_TB8823_00 a Dependent variable: Sales (A$'000)
The above shows that:
A) approximately 45 per cent of the variance in sales can be explained by advertising spend.
B) approximately 43 per cent of the variance in Sales can be explained by advertising spend.
C) approximately 14 per cent of the variance in sales can be explained by advertising spend.
D) approximately 20 per cent of the variance in sales can be explained by advertising spend.
ANOVA(b)
11eb99e4_52c7_7aad_ab5d_a97cebb53082_TB8823_00 a Predictors: (Constant), advertising spend
B Dependent variable: Sales (A$'000)
Coefficients(a)
11eb99e4_52c7_7aae_ab5d_e1db6a89764e_TB8823_00 a Dependent variable: Sales (A$'000)
The above shows that:
A) approximately 45 per cent of the variance in sales can be explained by advertising spend.
B) approximately 43 per cent of the variance in Sales can be explained by advertising spend.
C) approximately 14 per cent of the variance in sales can be explained by advertising spend.
D) approximately 20 per cent of the variance in sales can be explained by advertising spend.
" class="answers-bank-image d-block" loading="lazy" > a Predictors: (Constant), advertising spend
ANOVA(b)
11eb99e4_52c7_7aad_ab5d_a97cebb53082_TB8823_00 a Predictors: (Constant), advertising spend
B Dependent variable: Sales (A$'000)
Coefficients(a)
11eb99e4_52c7_7aae_ab5d_e1db6a89764e_TB8823_00 a Dependent variable: Sales (A$'000)
The above shows that:
A) approximately 45 per cent of the variance in sales can be explained by advertising spend.
B) approximately 43 per cent of the variance in Sales can be explained by advertising spend.
C) approximately 14 per cent of the variance in sales can be explained by advertising spend.
D) approximately 20 per cent of the variance in sales can be explained by advertising spend.000) The above shows that: A) approximately 45 per cent of the variance in sales can be explained by advertising spend. B) approximately 43 per cent of the variance in Sales can be explained by advertising spend. C) approximately 14 per cent of the variance in sales can be explained by advertising spend. D) approximately 20 per cent of the variance in sales can be explained by advertising spend.
ANOVA(b)
11eb99e4_52c7_7aad_ab5d_a97cebb53082_TB8823_00 a Predictors: (Constant), advertising spend
B Dependent variable: Sales (A$'000)
Coefficients(a)
11eb99e4_52c7_7aae_ab5d_e1db6a89764e_TB8823_00 a Dependent variable: Sales (A$'000)
The above shows that:
A) approximately 45 per cent of the variance in sales can be explained by advertising spend.
B) approximately 43 per cent of the variance in Sales can be explained by advertising spend.
C) approximately 14 per cent of the variance in sales can be explained by advertising spend.
D) approximately 20 per cent of the variance in sales can be explained by advertising spend.
" class="answers-bank-image d-block" loading="lazy" > a Dependent variable: Sales (A$'000)
The above shows that:
A) approximately 45 per cent of the variance in sales can be explained by advertising spend.
B) approximately 43 per cent of the variance in Sales can be explained by advertising spend.
C) approximately 14 per cent of the variance in sales can be explained by advertising spend.
D) approximately 20 per cent of the variance in sales can be explained by advertising spend.000) Coefficients(a) a Dependent variable: Sales (A a Predictors: (Constant), advertising spend
ANOVA(b)
11eb99e4_52c7_7aad_ab5d_a97cebb53082_TB8823_00 a Predictors: (Constant), advertising spend
B Dependent variable: Sales (A$'000)
Coefficients(a)
11eb99e4_52c7_7aae_ab5d_e1db6a89764e_TB8823_00 a Dependent variable: Sales (A$'000)
The above shows that:
A) approximately 45 per cent of the variance in sales can be explained by advertising spend.
B) approximately 43 per cent of the variance in Sales can be explained by advertising spend.
C) approximately 14 per cent of the variance in sales can be explained by advertising spend.
D) approximately 20 per cent of the variance in sales can be explained by advertising spend.000) The above shows that: A) approximately 45 per cent of the variance in sales can be explained by advertising spend. B) approximately 43 per cent of the variance in Sales can be explained by advertising spend. C) approximately 14 per cent of the variance in sales can be explained by advertising spend. D) approximately 20 per cent of the variance in sales can be explained by advertising spend.
The above shows that:
A) approximately 45 per cent of the variance in sales can be explained by advertising spend.
B) approximately 43 per cent of the variance in Sales can be explained by advertising spend.
C) approximately 14 per cent of the variance in sales can be explained by advertising spend.
D) approximately 20 per cent of the variance in sales can be explained by advertising spend.
ANOVA(b)
11eb99e4_52c7_7aad_ab5d_a97cebb53082_TB8823_00 a Predictors: (Constant), advertising spend
B Dependent variable: Sales (A$'000)
Coefficients(a)
11eb99e4_52c7_7aae_ab5d_e1db6a89764e_TB8823_00 a Dependent variable: Sales (A$'000)
The above shows that:
A) approximately 45 per cent of the variance in sales can be explained by advertising spend.
B) approximately 43 per cent of the variance in Sales can be explained by advertising spend.
C) approximately 14 per cent of the variance in sales can be explained by advertising spend.
D) approximately 20 per cent of the variance in sales can be explained by advertising spend.
" class="answers-bank-image d-block" loading="lazy" > a Predictors: (Constant), advertising spend
ANOVA(b)
11eb99e4_52c7_7aad_ab5d_a97cebb53082_TB8823_00 a Predictors: (Constant), advertising spend
B Dependent variable: Sales (A$'000)
Coefficients(a)
11eb99e4_52c7_7aae_ab5d_e1db6a89764e_TB8823_00 a Dependent variable: Sales (A$'000)
The above shows that:
A) approximately 45 per cent of the variance in sales can be explained by advertising spend.
B) approximately 43 per cent of the variance in Sales can be explained by advertising spend.
C) approximately 14 per cent of the variance in sales can be explained by advertising spend.
D) approximately 20 per cent of the variance in sales can be explained by advertising spend.000) Coefficients(a) a Dependent variable: Sales (A a Predictors: (Constant), advertising spend
ANOVA(b)
11eb99e4_52c7_7aad_ab5d_a97cebb53082_TB8823_00 a Predictors: (Constant), advertising spend
B Dependent variable: Sales (A$'000)
Coefficients(a)
11eb99e4_52c7_7aae_ab5d_e1db6a89764e_TB8823_00 a Dependent variable: Sales (A$'000)
The above shows that:
A) approximately 45 per cent of the variance in sales can be explained by advertising spend.
B) approximately 43 per cent of the variance in Sales can be explained by advertising spend.
C) approximately 14 per cent of the variance in sales can be explained by advertising spend.
D) approximately 20 per cent of the variance in sales can be explained by advertising spend.000) The above shows that: A) approximately 45 per cent of the variance in sales can be explained by advertising spend. B) approximately 43 per cent of the variance in Sales can be explained by advertising spend. C) approximately 14 per cent of the variance in sales can be explained by advertising spend. D) approximately 20 per cent of the variance in sales can be explained by advertising spend.
ANOVA(b)
11eb99e4_52c7_7aad_ab5d_a97cebb53082_TB8823_00 a Predictors: (Constant), advertising spend
B Dependent variable: Sales (A$'000)
Coefficients(a)
11eb99e4_52c7_7aae_ab5d_e1db6a89764e_TB8823_00 a Dependent variable: Sales (A$'000)
The above shows that:
A) approximately 45 per cent of the variance in sales can be explained by advertising spend.
B) approximately 43 per cent of the variance in Sales can be explained by advertising spend.
C) approximately 14 per cent of the variance in sales can be explained by advertising spend.
D) approximately 20 per cent of the variance in sales can be explained by advertising spend.
ANOVA(b)
11eb99e4_52c7_7aad_ab5d_a97cebb53082_TB8823_00 a Predictors: (Constant), advertising spend
B Dependent variable: Sales (A$'000)
Coefficients(a)
11eb99e4_52c7_7aae_ab5d_e1db6a89764e_TB8823_00 a Dependent variable: Sales (A$'000)
The above shows that:
A) approximately 45 per cent of the variance in sales can be explained by advertising spend.
B) approximately 43 per cent of the variance in Sales can be explained by advertising spend.
C) approximately 14 per cent of the variance in sales can be explained by advertising spend.
D) approximately 20 per cent of the variance in sales can be explained by advertising spend.
" class="answers-bank-image d-block" loading="lazy" > a Predictors: (Constant), advertising spend
ANOVA(b)
11eb99e4_52c7_7aad_ab5d_a97cebb53082_TB8823_00 a Predictors: (Constant), advertising spend
B Dependent variable: Sales (A$'000)
Coefficients(a)
11eb99e4_52c7_7aae_ab5d_e1db6a89764e_TB8823_00 a Dependent variable: Sales (A$'000)
The above shows that:
A) approximately 45 per cent of the variance in sales can be explained by advertising spend.
B) approximately 43 per cent of the variance in Sales can be explained by advertising spend.
C) approximately 14 per cent of the variance in sales can be explained by advertising spend.
D) approximately 20 per cent of the variance in sales can be explained by advertising spend.000) The above shows that: A) approximately 45 per cent of the variance in sales can be explained by advertising spend. B) approximately 43 per cent of the variance in Sales can be explained by advertising spend. C) approximately 14 per cent of the variance in sales can be explained by advertising spend. D) approximately 20 per cent of the variance in sales can be explained by advertising spend.
ANOVA(b)
11eb99e4_52c7_7aad_ab5d_a97cebb53082_TB8823_00 a Predictors: (Constant), advertising spend
B Dependent variable: Sales (A$'000)
Coefficients(a)
11eb99e4_52c7_7aae_ab5d_e1db6a89764e_TB8823_00 a Dependent variable: Sales (A$'000)
The above shows that:
A) approximately 45 per cent of the variance in sales can be explained by advertising spend.
B) approximately 43 per cent of the variance in Sales can be explained by advertising spend.
C) approximately 14 per cent of the variance in sales can be explained by advertising spend.
D) approximately 20 per cent of the variance in sales can be explained by advertising spend.
" class="answers-bank-image d-block" loading="lazy" > a Predictors: (Constant), advertising spend
B Dependent variable: Sales (A$'000)
Coefficients(a)
11eb99e4_52c7_7aae_ab5d_e1db6a89764e_TB8823_00 a Dependent variable: Sales (A$'000)
The above shows that:
A) approximately 45 per cent of the variance in sales can be explained by advertising spend.
B) approximately 43 per cent of the variance in Sales can be explained by advertising spend.
C) approximately 14 per cent of the variance in sales can be explained by advertising spend.
D) approximately 20 per cent of the variance in sales can be explained by advertising spend.000) Coefficients(a) a Dependent variable: Sales (A a Predictors: (Constant), advertising spend
ANOVA(b)
11eb99e4_52c7_7aad_ab5d_a97cebb53082_TB8823_00 a Predictors: (Constant), advertising spend
B Dependent variable: Sales (A$'000)
Coefficients(a)
11eb99e4_52c7_7aae_ab5d_e1db6a89764e_TB8823_00 a Dependent variable: Sales (A$'000)
The above shows that:
A) approximately 45 per cent of the variance in sales can be explained by advertising spend.
B) approximately 43 per cent of the variance in Sales can be explained by advertising spend.
C) approximately 14 per cent of the variance in sales can be explained by advertising spend.
D) approximately 20 per cent of the variance in sales can be explained by advertising spend.000) The above shows that: A) approximately 45 per cent of the variance in sales can be explained by advertising spend. B) approximately 43 per cent of the variance in Sales can be explained by advertising spend. C) approximately 14 per cent of the variance in sales can be explained by advertising spend. D) approximately 20 per cent of the variance in sales can be explained by advertising spend.
B Dependent variable: Sales (A$'000)
Coefficients(a)
11eb99e4_52c7_7aae_ab5d_e1db6a89764e_TB8823_00 a Dependent variable: Sales (A$'000)
The above shows that:
A) approximately 45 per cent of the variance in sales can be explained by advertising spend.
B) approximately 43 per cent of the variance in Sales can be explained by advertising spend.
C) approximately 14 per cent of the variance in sales can be explained by advertising spend.
D) approximately 20 per cent of the variance in sales can be explained by advertising spend.
ANOVA(b)
11eb99e4_52c7_7aad_ab5d_a97cebb53082_TB8823_00 a Predictors: (Constant), advertising spend
B Dependent variable: Sales (A$'000)
Coefficients(a)
11eb99e4_52c7_7aae_ab5d_e1db6a89764e_TB8823_00 a Dependent variable: Sales (A$'000)
The above shows that:
A) approximately 45 per cent of the variance in sales can be explained by advertising spend.
B) approximately 43 per cent of the variance in Sales can be explained by advertising spend.
C) approximately 14 per cent of the variance in sales can be explained by advertising spend.
D) approximately 20 per cent of the variance in sales can be explained by advertising spend.
" class="answers-bank-image d-block" loading="lazy" > a Predictors: (Constant), advertising spend
ANOVA(b)
11eb99e4_52c7_7aad_ab5d_a97cebb53082_TB8823_00 a Predictors: (Constant), advertising spend
B Dependent variable: Sales (A$'000)
Coefficients(a)
11eb99e4_52c7_7aae_ab5d_e1db6a89764e_TB8823_00 a Dependent variable: Sales (A$'000)
The above shows that:
A) approximately 45 per cent of the variance in sales can be explained by advertising spend.
B) approximately 43 per cent of the variance in Sales can be explained by advertising spend.
C) approximately 14 per cent of the variance in sales can be explained by advertising spend.
D) approximately 20 per cent of the variance in sales can be explained by advertising spend.
سؤال
سؤال
سؤال
سؤال
The regression outputs for sales and number of salespeople are shown below. Model summary
 000) Coefficients(a) a Dependent variable: Sales (A a Predictors: (Constant), number of salespeople
ANOVA(b)
11eb99e4_52c6_b757_ab5d_4f32ec741319_TB8823_00 a Predictors: (Constant), number of salespeople
B Dependent variable: Sales (A$'000)
Coefficients(a)
11eb99e4_52c6_b758_ab5d_6d4af4bd58fe_TB8823_00 a Dependent variable: Sales (A$'000)
The above shows that:
A) for every one-unit increase in number of salespeople, average sales will increase by approximately 73 units
B) the regression results suggested a good model fit
C) the observed results occurred as a result of sampling error
D) the regression coefficient is significant000) The above shows that: A) for every one-unit increase in number of salespeople, average sales will increase by approximately 73 units B) the regression results suggested a good model fit C) the observed results occurred as a result of sampling error D) the regression coefficient is significant
000) Coefficients(a) a Dependent variable: Sales (A a Predictors: (Constant), number of salespeopleANOVA(b)
11eb99e4_52c6_b757_ab5d_4f32ec741319_TB8823_00 a Predictors: (Constant), number of salespeople
B Dependent variable: Sales (A$'000)
Coefficients(a)
11eb99e4_52c6_b758_ab5d_6d4af4bd58fe_TB8823_00 a Dependent variable: Sales (A$'000)
The above shows that:
A) for every one-unit increase in number of salespeople, average sales will increase by approximately 73 units
B) the regression results suggested a good model fit
C) the observed results occurred as a result of sampling error
D) the regression coefficient is significant
" class="answers-bank-image d-block" loading="lazy" > a Predictors: (Constant), number of salespeople
ANOVA(b)
11eb99e4_52c6_b757_ab5d_4f32ec741319_TB8823_00 a Predictors: (Constant), number of salespeople
B Dependent variable: Sales (A$'000)
Coefficients(a)
11eb99e4_52c6_b758_ab5d_6d4af4bd58fe_TB8823_00 a Dependent variable: Sales (A$'000)
The above shows that:
A) for every one-unit increase in number of salespeople, average sales will increase by approximately 73 units
B) the regression results suggested a good model fit
C) the observed results occurred as a result of sampling error
D) the regression coefficient is significant000) Coefficients(a) a Dependent variable: Sales (A a Predictors: (Constant), number of salespeople
ANOVA(b)
11eb99e4_52c6_b757_ab5d_4f32ec741319_TB8823_00 a Predictors: (Constant), number of salespeople
B Dependent variable: Sales (A$'000)
Coefficients(a)
11eb99e4_52c6_b758_ab5d_6d4af4bd58fe_TB8823_00 a Dependent variable: Sales (A$'000)
The above shows that:
A) for every one-unit increase in number of salespeople, average sales will increase by approximately 73 units
B) the regression results suggested a good model fit
C) the observed results occurred as a result of sampling error
D) the regression coefficient is significant000) The above shows that: A) for every one-unit increase in number of salespeople, average sales will increase by approximately 73 units B) the regression results suggested a good model fit C) the observed results occurred as a result of sampling error D) the regression coefficient is significant
ANOVA(b)
11eb99e4_52c6_b757_ab5d_4f32ec741319_TB8823_00 a Predictors: (Constant), number of salespeople
B Dependent variable: Sales (A$'000)
Coefficients(a)
11eb99e4_52c6_b758_ab5d_6d4af4bd58fe_TB8823_00 a Dependent variable: Sales (A$'000)
The above shows that:
A) for every one-unit increase in number of salespeople, average sales will increase by approximately 73 units
B) the regression results suggested a good model fit
C) the observed results occurred as a result of sampling error
D) the regression coefficient is significant
ANOVA(b)
11eb99e4_52c6_b757_ab5d_4f32ec741319_TB8823_00 a Predictors: (Constant), number of salespeople
B Dependent variable: Sales (A$'000)
Coefficients(a)
11eb99e4_52c6_b758_ab5d_6d4af4bd58fe_TB8823_00 a Dependent variable: Sales (A$'000)
The above shows that:
A) for every one-unit increase in number of salespeople, average sales will increase by approximately 73 units
B) the regression results suggested a good model fit
C) the observed results occurred as a result of sampling error
D) the regression coefficient is significant
" class="answers-bank-image d-block" loading="lazy" > a Predictors: (Constant), number of salespeople
ANOVA(b)
11eb99e4_52c6_b757_ab5d_4f32ec741319_TB8823_00 a Predictors: (Constant), number of salespeople
B Dependent variable: Sales (A$'000)
Coefficients(a)
11eb99e4_52c6_b758_ab5d_6d4af4bd58fe_TB8823_00 a Dependent variable: Sales (A$'000)
The above shows that:
A) for every one-unit increase in number of salespeople, average sales will increase by approximately 73 units
B) the regression results suggested a good model fit
C) the observed results occurred as a result of sampling error
D) the regression coefficient is significant000) The above shows that: A) for every one-unit increase in number of salespeople, average sales will increase by approximately 73 units B) the regression results suggested a good model fit C) the observed results occurred as a result of sampling error D) the regression coefficient is significant
ANOVA(b)
11eb99e4_52c6_b757_ab5d_4f32ec741319_TB8823_00 a Predictors: (Constant), number of salespeople
B Dependent variable: Sales (A$'000)
Coefficients(a)
11eb99e4_52c6_b758_ab5d_6d4af4bd58fe_TB8823_00 a Dependent variable: Sales (A$'000)
The above shows that:
A) for every one-unit increase in number of salespeople, average sales will increase by approximately 73 units
B) the regression results suggested a good model fit
C) the observed results occurred as a result of sampling error
D) the regression coefficient is significant
" class="answers-bank-image d-block" loading="lazy" > a Predictors: (Constant), number of salespeople
B Dependent variable: Sales (A$'000)
Coefficients(a)
11eb99e4_52c6_b758_ab5d_6d4af4bd58fe_TB8823_00 a Dependent variable: Sales (A$'000)
The above shows that:
A) for every one-unit increase in number of salespeople, average sales will increase by approximately 73 units
B) the regression results suggested a good model fit
C) the observed results occurred as a result of sampling error
D) the regression coefficient is significant000) Coefficients(a) a Dependent variable: Sales (A a Predictors: (Constant), number of salespeople
ANOVA(b)
11eb99e4_52c6_b757_ab5d_4f32ec741319_TB8823_00 a Predictors: (Constant), number of salespeople
B Dependent variable: Sales (A$'000)
Coefficients(a)
11eb99e4_52c6_b758_ab5d_6d4af4bd58fe_TB8823_00 a Dependent variable: Sales (A$'000)
The above shows that:
A) for every one-unit increase in number of salespeople, average sales will increase by approximately 73 units
B) the regression results suggested a good model fit
C) the observed results occurred as a result of sampling error
D) the regression coefficient is significant000) The above shows that: A) for every one-unit increase in number of salespeople, average sales will increase by approximately 73 units B) the regression results suggested a good model fit C) the observed results occurred as a result of sampling error D) the regression coefficient is significant
B Dependent variable: Sales (A$'000)
Coefficients(a)
11eb99e4_52c6_b758_ab5d_6d4af4bd58fe_TB8823_00 a Dependent variable: Sales (A$'000)
The above shows that:
A) for every one-unit increase in number of salespeople, average sales will increase by approximately 73 units
B) the regression results suggested a good model fit
C) the observed results occurred as a result of sampling error
D) the regression coefficient is significant
ANOVA(b)
11eb99e4_52c6_b757_ab5d_4f32ec741319_TB8823_00 a Predictors: (Constant), number of salespeople
B Dependent variable: Sales (A$'000)
Coefficients(a)
11eb99e4_52c6_b758_ab5d_6d4af4bd58fe_TB8823_00 a Dependent variable: Sales (A$'000)
The above shows that:
A) for every one-unit increase in number of salespeople, average sales will increase by approximately 73 units
B) the regression results suggested a good model fit
C) the observed results occurred as a result of sampling error
D) the regression coefficient is significant
" class="answers-bank-image d-block" loading="lazy" > a Predictors: (Constant), number of salespeople
ANOVA(b)
11eb99e4_52c6_b757_ab5d_4f32ec741319_TB8823_00 a Predictors: (Constant), number of salespeople
B Dependent variable: Sales (A$'000)
Coefficients(a)
11eb99e4_52c6_b758_ab5d_6d4af4bd58fe_TB8823_00 a Dependent variable: Sales (A$'000)
The above shows that:
A) for every one-unit increase in number of salespeople, average sales will increase by approximately 73 units
B) the regression results suggested a good model fit
C) the observed results occurred as a result of sampling error
D) the regression coefficient is significant000) Coefficients(a) a Dependent variable: Sales (A a Dependent variable: Sales (A$'000)
The above shows that:
A) for every one-unit increase in number of salespeople, average sales will increase by approximately 73 units
B) the regression results suggested a good model fit
C) the observed results occurred as a result of sampling error
D) the regression coefficient is significant000) Coefficients(a) a Dependent variable: Sales (A a Predictors: (Constant), number of salespeople
ANOVA(b)
11eb99e4_52c6_b757_ab5d_4f32ec741319_TB8823_00 a Predictors: (Constant), number of salespeople
B Dependent variable: Sales (A$'000)
Coefficients(a)
11eb99e4_52c6_b758_ab5d_6d4af4bd58fe_TB8823_00 a Dependent variable: Sales (A$'000)
The above shows that:
A) for every one-unit increase in number of salespeople, average sales will increase by approximately 73 units
B) the regression results suggested a good model fit
C) the observed results occurred as a result of sampling error
D) the regression coefficient is significant000) The above shows that: A) for every one-unit increase in number of salespeople, average sales will increase by approximately 73 units B) the regression results suggested a good model fit C) the observed results occurred as a result of sampling error D) the regression coefficient is significant
ANOVA(b)
11eb99e4_52c6_b757_ab5d_4f32ec741319_TB8823_00 a Predictors: (Constant), number of salespeople
B Dependent variable: Sales (A$'000)
Coefficients(a)
11eb99e4_52c6_b758_ab5d_6d4af4bd58fe_TB8823_00 a Dependent variable: Sales (A$'000)
The above shows that:
A) for every one-unit increase in number of salespeople, average sales will increase by approximately 73 units
B) the regression results suggested a good model fit
C) the observed results occurred as a result of sampling error
D) the regression coefficient is significant
The above shows that:
A) for every one-unit increase in number of salespeople, average sales will increase by approximately 73 units
B) the regression results suggested a good model fit
C) the observed results occurred as a result of sampling error
D) the regression coefficient is significant
ANOVA(b)
11eb99e4_52c6_b757_ab5d_4f32ec741319_TB8823_00 a Predictors: (Constant), number of salespeople
B Dependent variable: Sales (A$'000)
Coefficients(a)
11eb99e4_52c6_b758_ab5d_6d4af4bd58fe_TB8823_00 a Dependent variable: Sales (A$'000)
The above shows that:
A) for every one-unit increase in number of salespeople, average sales will increase by approximately 73 units
B) the regression results suggested a good model fit
C) the observed results occurred as a result of sampling error
D) the regression coefficient is significant
" class="answers-bank-image d-block" loading="lazy" > a Predictors: (Constant), number of salespeople
ANOVA(b)
11eb99e4_52c6_b757_ab5d_4f32ec741319_TB8823_00 a Predictors: (Constant), number of salespeople
B Dependent variable: Sales (A$'000)
Coefficients(a)
11eb99e4_52c6_b758_ab5d_6d4af4bd58fe_TB8823_00 a Dependent variable: Sales (A$'000)
The above shows that:
A) for every one-unit increase in number of salespeople, average sales will increase by approximately 73 units
B) the regression results suggested a good model fit
C) the observed results occurred as a result of sampling error
D) the regression coefficient is significant000) Coefficients(a) a Dependent variable: Sales (A a Predictors: (Constant), number of salespeople
ANOVA(b)
11eb99e4_52c6_b757_ab5d_4f32ec741319_TB8823_00 a Predictors: (Constant), number of salespeople
B Dependent variable: Sales (A$'000)
Coefficients(a)
11eb99e4_52c6_b758_ab5d_6d4af4bd58fe_TB8823_00 a Dependent variable: Sales (A$'000)
The above shows that:
A) for every one-unit increase in number of salespeople, average sales will increase by approximately 73 units
B) the regression results suggested a good model fit
C) the observed results occurred as a result of sampling error
D) the regression coefficient is significant000) The above shows that: A) for every one-unit increase in number of salespeople, average sales will increase by approximately 73 units B) the regression results suggested a good model fit C) the observed results occurred as a result of sampling error D) the regression coefficient is significant
ANOVA(b)
11eb99e4_52c6_b757_ab5d_4f32ec741319_TB8823_00 a Predictors: (Constant), number of salespeople
B Dependent variable: Sales (A$'000)
Coefficients(a)
11eb99e4_52c6_b758_ab5d_6d4af4bd58fe_TB8823_00 a Dependent variable: Sales (A$'000)
The above shows that:
A) for every one-unit increase in number of salespeople, average sales will increase by approximately 73 units
B) the regression results suggested a good model fit
C) the observed results occurred as a result of sampling error
D) the regression coefficient is significant
ANOVA(b)
11eb99e4_52c6_b757_ab5d_4f32ec741319_TB8823_00 a Predictors: (Constant), number of salespeople
B Dependent variable: Sales (A$'000)
Coefficients(a)
11eb99e4_52c6_b758_ab5d_6d4af4bd58fe_TB8823_00 a Dependent variable: Sales (A$'000)
The above shows that:
A) for every one-unit increase in number of salespeople, average sales will increase by approximately 73 units
B) the regression results suggested a good model fit
C) the observed results occurred as a result of sampling error
D) the regression coefficient is significant
" class="answers-bank-image d-block" loading="lazy" > a Predictors: (Constant), number of salespeople
ANOVA(b)
11eb99e4_52c6_b757_ab5d_4f32ec741319_TB8823_00 a Predictors: (Constant), number of salespeople
B Dependent variable: Sales (A$'000)
Coefficients(a)
11eb99e4_52c6_b758_ab5d_6d4af4bd58fe_TB8823_00 a Dependent variable: Sales (A$'000)
The above shows that:
A) for every one-unit increase in number of salespeople, average sales will increase by approximately 73 units
B) the regression results suggested a good model fit
C) the observed results occurred as a result of sampling error
D) the regression coefficient is significant000) The above shows that: A) for every one-unit increase in number of salespeople, average sales will increase by approximately 73 units B) the regression results suggested a good model fit C) the observed results occurred as a result of sampling error D) the regression coefficient is significant
ANOVA(b)
11eb99e4_52c6_b757_ab5d_4f32ec741319_TB8823_00 a Predictors: (Constant), number of salespeople
B Dependent variable: Sales (A$'000)
Coefficients(a)
11eb99e4_52c6_b758_ab5d_6d4af4bd58fe_TB8823_00 a Dependent variable: Sales (A$'000)
The above shows that:
A) for every one-unit increase in number of salespeople, average sales will increase by approximately 73 units
B) the regression results suggested a good model fit
C) the observed results occurred as a result of sampling error
D) the regression coefficient is significant
" class="answers-bank-image d-block" loading="lazy" > a Predictors: (Constant), number of salespeople
B Dependent variable: Sales (A$'000)
Coefficients(a)
11eb99e4_52c6_b758_ab5d_6d4af4bd58fe_TB8823_00 a Dependent variable: Sales (A$'000)
The above shows that:
A) for every one-unit increase in number of salespeople, average sales will increase by approximately 73 units
B) the regression results suggested a good model fit
C) the observed results occurred as a result of sampling error
D) the regression coefficient is significant000) Coefficients(a) a Dependent variable: Sales (A a Predictors: (Constant), number of salespeople
ANOVA(b)
11eb99e4_52c6_b757_ab5d_4f32ec741319_TB8823_00 a Predictors: (Constant), number of salespeople
B Dependent variable: Sales (A$'000)
Coefficients(a)
11eb99e4_52c6_b758_ab5d_6d4af4bd58fe_TB8823_00 a Dependent variable: Sales (A$'000)
The above shows that:
A) for every one-unit increase in number of salespeople, average sales will increase by approximately 73 units
B) the regression results suggested a good model fit
C) the observed results occurred as a result of sampling error
D) the regression coefficient is significant000) The above shows that: A) for every one-unit increase in number of salespeople, average sales will increase by approximately 73 units B) the regression results suggested a good model fit C) the observed results occurred as a result of sampling error D) the regression coefficient is significant
B Dependent variable: Sales (A$'000)
Coefficients(a)
11eb99e4_52c6_b758_ab5d_6d4af4bd58fe_TB8823_00 a Dependent variable: Sales (A$'000)
The above shows that:
A) for every one-unit increase in number of salespeople, average sales will increase by approximately 73 units
B) the regression results suggested a good model fit
C) the observed results occurred as a result of sampling error
D) the regression coefficient is significant
ANOVA(b)
11eb99e4_52c6_b757_ab5d_4f32ec741319_TB8823_00 a Predictors: (Constant), number of salespeople
B Dependent variable: Sales (A$'000)
Coefficients(a)
11eb99e4_52c6_b758_ab5d_6d4af4bd58fe_TB8823_00 a Dependent variable: Sales (A$'000)
The above shows that:
A) for every one-unit increase in number of salespeople, average sales will increase by approximately 73 units
B) the regression results suggested a good model fit
C) the observed results occurred as a result of sampling error
D) the regression coefficient is significant
" class="answers-bank-image d-block" loading="lazy" > a Predictors: (Constant), number of salespeople
ANOVA(b)
11eb99e4_52c6_b757_ab5d_4f32ec741319_TB8823_00 a Predictors: (Constant), number of salespeople
B Dependent variable: Sales (A$'000)
Coefficients(a)
11eb99e4_52c6_b758_ab5d_6d4af4bd58fe_TB8823_00 a Dependent variable: Sales (A$'000)
The above shows that:
A) for every one-unit increase in number of salespeople, average sales will increase by approximately 73 units
B) the regression results suggested a good model fit
C) the observed results occurred as a result of sampling error
D) the regression coefficient is significant000) The above shows that: A) for every one-unit increase in number of salespeople, average sales will increase by approximately 73 units B) the regression results suggested a good model fit C) the observed results occurred as a result of sampling error D) the regression coefficient is significant
ANOVA(b)
11eb99e4_52c6_b757_ab5d_4f32ec741319_TB8823_00 a Predictors: (Constant), number of salespeople
B Dependent variable: Sales (A$'000)
Coefficients(a)
11eb99e4_52c6_b758_ab5d_6d4af4bd58fe_TB8823_00 a Dependent variable: Sales (A$'000)
The above shows that:
A) for every one-unit increase in number of salespeople, average sales will increase by approximately 73 units
B) the regression results suggested a good model fit
C) the observed results occurred as a result of sampling error
D) the regression coefficient is significant
" class="answers-bank-image d-block" loading="lazy" > a Dependent variable: Sales (A$'000)
The above shows that:
A) for every one-unit increase in number of salespeople, average sales will increase by approximately 73 units
B) the regression results suggested a good model fit
C) the observed results occurred as a result of sampling error
D) the regression coefficient is significant000) Coefficients(a) a Dependent variable: Sales (A a Predictors: (Constant), number of salespeople
ANOVA(b)
11eb99e4_52c6_b757_ab5d_4f32ec741319_TB8823_00 a Predictors: (Constant), number of salespeople
B Dependent variable: Sales (A$'000)
Coefficients(a)
11eb99e4_52c6_b758_ab5d_6d4af4bd58fe_TB8823_00 a Dependent variable: Sales (A$'000)
The above shows that:
A) for every one-unit increase in number of salespeople, average sales will increase by approximately 73 units
B) the regression results suggested a good model fit
C) the observed results occurred as a result of sampling error
D) the regression coefficient is significant000) The above shows that: A) for every one-unit increase in number of salespeople, average sales will increase by approximately 73 units B) the regression results suggested a good model fit C) the observed results occurred as a result of sampling error D) the regression coefficient is significant
The above shows that:
A) for every one-unit increase in number of salespeople, average sales will increase by approximately 73 units
B) the regression results suggested a good model fit
C) the observed results occurred as a result of sampling error
D) the regression coefficient is significant
ANOVA(b)
11eb99e4_52c6_b757_ab5d_4f32ec741319_TB8823_00 a Predictors: (Constant), number of salespeople
B Dependent variable: Sales (A$'000)
Coefficients(a)
11eb99e4_52c6_b758_ab5d_6d4af4bd58fe_TB8823_00 a Dependent variable: Sales (A$'000)
The above shows that:
A) for every one-unit increase in number of salespeople, average sales will increase by approximately 73 units
B) the regression results suggested a good model fit
C) the observed results occurred as a result of sampling error
D) the regression coefficient is significant
" class="answers-bank-image d-block" loading="lazy" > a Predictors: (Constant), number of salespeople
ANOVA(b)
11eb99e4_52c6_b757_ab5d_4f32ec741319_TB8823_00 a Predictors: (Constant), number of salespeople
B Dependent variable: Sales (A$'000)
Coefficients(a)
11eb99e4_52c6_b758_ab5d_6d4af4bd58fe_TB8823_00 a Dependent variable: Sales (A$'000)
The above shows that:
A) for every one-unit increase in number of salespeople, average sales will increase by approximately 73 units
B) the regression results suggested a good model fit
C) the observed results occurred as a result of sampling error
D) the regression coefficient is significant000) Coefficients(a) a Dependent variable: Sales (A a Predictors: (Constant), number of salespeople
ANOVA(b)
11eb99e4_52c6_b757_ab5d_4f32ec741319_TB8823_00 a Predictors: (Constant), number of salespeople
B Dependent variable: Sales (A$'000)
Coefficients(a)
11eb99e4_52c6_b758_ab5d_6d4af4bd58fe_TB8823_00 a Dependent variable: Sales (A$'000)
The above shows that:
A) for every one-unit increase in number of salespeople, average sales will increase by approximately 73 units
B) the regression results suggested a good model fit
C) the observed results occurred as a result of sampling error
D) the regression coefficient is significant000) The above shows that: A) for every one-unit increase in number of salespeople, average sales will increase by approximately 73 units B) the regression results suggested a good model fit C) the observed results occurred as a result of sampling error D) the regression coefficient is significant
ANOVA(b)
11eb99e4_52c6_b757_ab5d_4f32ec741319_TB8823_00 a Predictors: (Constant), number of salespeople
B Dependent variable: Sales (A$'000)
Coefficients(a)
11eb99e4_52c6_b758_ab5d_6d4af4bd58fe_TB8823_00 a Dependent variable: Sales (A$'000)
The above shows that:
A) for every one-unit increase in number of salespeople, average sales will increase by approximately 73 units
B) the regression results suggested a good model fit
C) the observed results occurred as a result of sampling error
D) the regression coefficient is significant
ANOVA(b)
11eb99e4_52c6_b757_ab5d_4f32ec741319_TB8823_00 a Predictors: (Constant), number of salespeople
B Dependent variable: Sales (A$'000)
Coefficients(a)
11eb99e4_52c6_b758_ab5d_6d4af4bd58fe_TB8823_00 a Dependent variable: Sales (A$'000)
The above shows that:
A) for every one-unit increase in number of salespeople, average sales will increase by approximately 73 units
B) the regression results suggested a good model fit
C) the observed results occurred as a result of sampling error
D) the regression coefficient is significant
" class="answers-bank-image d-block" loading="lazy" > a Predictors: (Constant), number of salespeople
ANOVA(b)
11eb99e4_52c6_b757_ab5d_4f32ec741319_TB8823_00 a Predictors: (Constant), number of salespeople
B Dependent variable: Sales (A$'000)
Coefficients(a)
11eb99e4_52c6_b758_ab5d_6d4af4bd58fe_TB8823_00 a Dependent variable: Sales (A$'000)
The above shows that:
A) for every one-unit increase in number of salespeople, average sales will increase by approximately 73 units
B) the regression results suggested a good model fit
C) the observed results occurred as a result of sampling error
D) the regression coefficient is significant000) The above shows that: A) for every one-unit increase in number of salespeople, average sales will increase by approximately 73 units B) the regression results suggested a good model fit C) the observed results occurred as a result of sampling error D) the regression coefficient is significant
ANOVA(b)
11eb99e4_52c6_b757_ab5d_4f32ec741319_TB8823_00 a Predictors: (Constant), number of salespeople
B Dependent variable: Sales (A$'000)
Coefficients(a)
11eb99e4_52c6_b758_ab5d_6d4af4bd58fe_TB8823_00 a Dependent variable: Sales (A$'000)
The above shows that:
A) for every one-unit increase in number of salespeople, average sales will increase by approximately 73 units
B) the regression results suggested a good model fit
C) the observed results occurred as a result of sampling error
D) the regression coefficient is significant
" class="answers-bank-image d-block" loading="lazy" > a Predictors: (Constant), number of salespeople
B Dependent variable: Sales (A$'000)
Coefficients(a)
11eb99e4_52c6_b758_ab5d_6d4af4bd58fe_TB8823_00 a Dependent variable: Sales (A$'000)
The above shows that:
A) for every one-unit increase in number of salespeople, average sales will increase by approximately 73 units
B) the regression results suggested a good model fit
C) the observed results occurred as a result of sampling error
D) the regression coefficient is significant000) Coefficients(a) a Dependent variable: Sales (A a Predictors: (Constant), number of salespeople
ANOVA(b)
11eb99e4_52c6_b757_ab5d_4f32ec741319_TB8823_00 a Predictors: (Constant), number of salespeople
B Dependent variable: Sales (A$'000)
Coefficients(a)
11eb99e4_52c6_b758_ab5d_6d4af4bd58fe_TB8823_00 a Dependent variable: Sales (A$'000)
The above shows that:
A) for every one-unit increase in number of salespeople, average sales will increase by approximately 73 units
B) the regression results suggested a good model fit
C) the observed results occurred as a result of sampling error
D) the regression coefficient is significant000) The above shows that: A) for every one-unit increase in number of salespeople, average sales will increase by approximately 73 units B) the regression results suggested a good model fit C) the observed results occurred as a result of sampling error D) the regression coefficient is significant
B Dependent variable: Sales (A$'000)
Coefficients(a)
11eb99e4_52c6_b758_ab5d_6d4af4bd58fe_TB8823_00 a Dependent variable: Sales (A$'000)
The above shows that:
A) for every one-unit increase in number of salespeople, average sales will increase by approximately 73 units
B) the regression results suggested a good model fit
C) the observed results occurred as a result of sampling error
D) the regression coefficient is significant
ANOVA(b)
11eb99e4_52c6_b757_ab5d_4f32ec741319_TB8823_00 a Predictors: (Constant), number of salespeople
B Dependent variable: Sales (A$'000)
Coefficients(a)
11eb99e4_52c6_b758_ab5d_6d4af4bd58fe_TB8823_00 a Dependent variable: Sales (A$'000)
The above shows that:
A) for every one-unit increase in number of salespeople, average sales will increase by approximately 73 units
B) the regression results suggested a good model fit
C) the observed results occurred as a result of sampling error
D) the regression coefficient is significant
" class="answers-bank-image d-block" loading="lazy" > a Predictors: (Constant), number of salespeople
ANOVA(b)
11eb99e4_52c6_b757_ab5d_4f32ec741319_TB8823_00 a Predictors: (Constant), number of salespeople
B Dependent variable: Sales (A$'000)
Coefficients(a)
11eb99e4_52c6_b758_ab5d_6d4af4bd58fe_TB8823_00 a Dependent variable: Sales (A$'000)
The above shows that:
A) for every one-unit increase in number of salespeople, average sales will increase by approximately 73 units
B) the regression results suggested a good model fit
C) the observed results occurred as a result of sampling error
D) the regression coefficient is significant
سؤال
سؤال
The regression output for sales and number of salespeople are shown below. Model summary
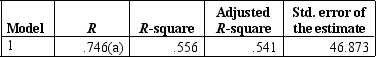 000) Coefficients(a) a Dependent variable: Sales (A a Predictors: (Constant), number of salespeople
ANOVA(b)
11eb99e4_52c7_057a_ab5d_81b00be8a5a3_TB8823_00 a Predictors: (Constant), number of salespeople
B Dependent Variable: Sales (A$'000)
Coefficients(a)
11eb99e4_52c7_2c8b_ab5d_25dc8efbd7a3_TB8823_00 a Dependent variable: Sales (A$'000)
The above shows that for every one-unit increase in number of salespeople, average sales will increase by approximately:
A) 36 units.
B) 73 units.
C) 75 units.
D) 108 units.000) The above shows that for every one-unit increase in number of salespeople, average sales will increase by approximately: A) 36 units. B) 73 units. C) 75 units. D) 108 units.
000) Coefficients(a) a Dependent variable: Sales (A a Predictors: (Constant), number of salespeopleANOVA(b)
11eb99e4_52c7_057a_ab5d_81b00be8a5a3_TB8823_00 a Predictors: (Constant), number of salespeople
B Dependent Variable: Sales (A$'000)
Coefficients(a)
11eb99e4_52c7_2c8b_ab5d_25dc8efbd7a3_TB8823_00 a Dependent variable: Sales (A$'000)
The above shows that for every one-unit increase in number of salespeople, average sales will increase by approximately:
A) 36 units.
B) 73 units.
C) 75 units.
D) 108 units.
" class="answers-bank-image d-block" loading="lazy" > a Predictors: (Constant), number of salespeople
ANOVA(b)
11eb99e4_52c7_057a_ab5d_81b00be8a5a3_TB8823_00 a Predictors: (Constant), number of salespeople
B Dependent Variable: Sales (A$'000)
Coefficients(a)
11eb99e4_52c7_2c8b_ab5d_25dc8efbd7a3_TB8823_00 a Dependent variable: Sales (A$'000)
The above shows that for every one-unit increase in number of salespeople, average sales will increase by approximately:
A) 36 units.
B) 73 units.
C) 75 units.
D) 108 units.000) Coefficients(a) a Dependent variable: Sales (A a Predictors: (Constant), number of salespeople
ANOVA(b)
11eb99e4_52c7_057a_ab5d_81b00be8a5a3_TB8823_00 a Predictors: (Constant), number of salespeople
B Dependent Variable: Sales (A$'000)
Coefficients(a)
11eb99e4_52c7_2c8b_ab5d_25dc8efbd7a3_TB8823_00 a Dependent variable: Sales (A$'000)
The above shows that for every one-unit increase in number of salespeople, average sales will increase by approximately:
A) 36 units.
B) 73 units.
C) 75 units.
D) 108 units.000) The above shows that for every one-unit increase in number of salespeople, average sales will increase by approximately: A) 36 units. B) 73 units. C) 75 units. D) 108 units.
ANOVA(b)
11eb99e4_52c7_057a_ab5d_81b00be8a5a3_TB8823_00 a Predictors: (Constant), number of salespeople
B Dependent Variable: Sales (A$'000)
Coefficients(a)
11eb99e4_52c7_2c8b_ab5d_25dc8efbd7a3_TB8823_00 a Dependent variable: Sales (A$'000)
The above shows that for every one-unit increase in number of salespeople, average sales will increase by approximately:
A) 36 units.
B) 73 units.
C) 75 units.
D) 108 units.
ANOVA(b)
11eb99e4_52c7_057a_ab5d_81b00be8a5a3_TB8823_00 a Predictors: (Constant), number of salespeople
B Dependent Variable: Sales (A$'000)
Coefficients(a)
11eb99e4_52c7_2c8b_ab5d_25dc8efbd7a3_TB8823_00 a Dependent variable: Sales (A$'000)
The above shows that for every one-unit increase in number of salespeople, average sales will increase by approximately:
A) 36 units.
B) 73 units.
C) 75 units.
D) 108 units.
" class="answers-bank-image d-block" loading="lazy" > a Predictors: (Constant), number of salespeople
ANOVA(b)
11eb99e4_52c7_057a_ab5d_81b00be8a5a3_TB8823_00 a Predictors: (Constant), number of salespeople
B Dependent Variable: Sales (A$'000)
Coefficients(a)
11eb99e4_52c7_2c8b_ab5d_25dc8efbd7a3_TB8823_00 a Dependent variable: Sales (A$'000)
The above shows that for every one-unit increase in number of salespeople, average sales will increase by approximately:
A) 36 units.
B) 73 units.
C) 75 units.
D) 108 units.000) The above shows that for every one-unit increase in number of salespeople, average sales will increase by approximately: A) 36 units. B) 73 units. C) 75 units. D) 108 units.
ANOVA(b)
11eb99e4_52c7_057a_ab5d_81b00be8a5a3_TB8823_00 a Predictors: (Constant), number of salespeople
B Dependent Variable: Sales (A$'000)
Coefficients(a)
11eb99e4_52c7_2c8b_ab5d_25dc8efbd7a3_TB8823_00 a Dependent variable: Sales (A$'000)
The above shows that for every one-unit increase in number of salespeople, average sales will increase by approximately:
A) 36 units.
B) 73 units.
C) 75 units.
D) 108 units.
" class="answers-bank-image d-block" loading="lazy" > a Predictors: (Constant), number of salespeople
B Dependent Variable: Sales (A$'000)
Coefficients(a)
11eb99e4_52c7_2c8b_ab5d_25dc8efbd7a3_TB8823_00 a Dependent variable: Sales (A$'000)
The above shows that for every one-unit increase in number of salespeople, average sales will increase by approximately:
A) 36 units.
B) 73 units.
C) 75 units.
D) 108 units.000) Coefficients(a) a Dependent variable: Sales (A a Predictors: (Constant), number of salespeople
ANOVA(b)
11eb99e4_52c7_057a_ab5d_81b00be8a5a3_TB8823_00 a Predictors: (Constant), number of salespeople
B Dependent Variable: Sales (A$'000)
Coefficients(a)
11eb99e4_52c7_2c8b_ab5d_25dc8efbd7a3_TB8823_00 a Dependent variable: Sales (A$'000)
The above shows that for every one-unit increase in number of salespeople, average sales will increase by approximately:
A) 36 units.
B) 73 units.
C) 75 units.
D) 108 units.000) The above shows that for every one-unit increase in number of salespeople, average sales will increase by approximately: A) 36 units. B) 73 units. C) 75 units. D) 108 units.
B Dependent Variable: Sales (A$'000)
Coefficients(a)
11eb99e4_52c7_2c8b_ab5d_25dc8efbd7a3_TB8823_00 a Dependent variable: Sales (A$'000)
The above shows that for every one-unit increase in number of salespeople, average sales will increase by approximately:
A) 36 units.
B) 73 units.
C) 75 units.
D) 108 units.
ANOVA(b)
11eb99e4_52c7_057a_ab5d_81b00be8a5a3_TB8823_00 a Predictors: (Constant), number of salespeople
B Dependent Variable: Sales (A$'000)
Coefficients(a)
11eb99e4_52c7_2c8b_ab5d_25dc8efbd7a3_TB8823_00 a Dependent variable: Sales (A$'000)
The above shows that for every one-unit increase in number of salespeople, average sales will increase by approximately:
A) 36 units.
B) 73 units.
C) 75 units.
D) 108 units.
" class="answers-bank-image d-block" loading="lazy" > a Predictors: (Constant), number of salespeople
ANOVA(b)
11eb99e4_52c7_057a_ab5d_81b00be8a5a3_TB8823_00 a Predictors: (Constant), number of salespeople
B Dependent Variable: Sales (A$'000)
Coefficients(a)
11eb99e4_52c7_2c8b_ab5d_25dc8efbd7a3_TB8823_00 a Dependent variable: Sales (A$'000)
The above shows that for every one-unit increase in number of salespeople, average sales will increase by approximately:
A) 36 units.
B) 73 units.
C) 75 units.
D) 108 units.000) Coefficients(a) a Dependent variable: Sales (A a Dependent variable: Sales (A$'000)
The above shows that for every one-unit increase in number of salespeople, average sales will increase by approximately:
A) 36 units.
B) 73 units.
C) 75 units.
D) 108 units.000) Coefficients(a) a Dependent variable: Sales (A a Predictors: (Constant), number of salespeople
ANOVA(b)
11eb99e4_52c7_057a_ab5d_81b00be8a5a3_TB8823_00 a Predictors: (Constant), number of salespeople
B Dependent Variable: Sales (A$'000)
Coefficients(a)
11eb99e4_52c7_2c8b_ab5d_25dc8efbd7a3_TB8823_00 a Dependent variable: Sales (A$'000)
The above shows that for every one-unit increase in number of salespeople, average sales will increase by approximately:
A) 36 units.
B) 73 units.
C) 75 units.
D) 108 units.000) The above shows that for every one-unit increase in number of salespeople, average sales will increase by approximately: A) 36 units. B) 73 units. C) 75 units. D) 108 units.
ANOVA(b)
11eb99e4_52c7_057a_ab5d_81b00be8a5a3_TB8823_00 a Predictors: (Constant), number of salespeople
B Dependent Variable: Sales (A$'000)
Coefficients(a)
11eb99e4_52c7_2c8b_ab5d_25dc8efbd7a3_TB8823_00 a Dependent variable: Sales (A$'000)
The above shows that for every one-unit increase in number of salespeople, average sales will increase by approximately:
A) 36 units.
B) 73 units.
C) 75 units.
D) 108 units.
The above shows that for every one-unit increase in number of salespeople, average sales will increase by approximately:
A) 36 units.
B) 73 units.
C) 75 units.
D) 108 units.
ANOVA(b)
11eb99e4_52c7_057a_ab5d_81b00be8a5a3_TB8823_00 a Predictors: (Constant), number of salespeople
B Dependent Variable: Sales (A$'000)
Coefficients(a)
11eb99e4_52c7_2c8b_ab5d_25dc8efbd7a3_TB8823_00 a Dependent variable: Sales (A$'000)
The above shows that for every one-unit increase in number of salespeople, average sales will increase by approximately:
A) 36 units.
B) 73 units.
C) 75 units.
D) 108 units.
" class="answers-bank-image d-block" loading="lazy" > a Predictors: (Constant), number of salespeople
ANOVA(b)
11eb99e4_52c7_057a_ab5d_81b00be8a5a3_TB8823_00 a Predictors: (Constant), number of salespeople
B Dependent Variable: Sales (A$'000)
Coefficients(a)
11eb99e4_52c7_2c8b_ab5d_25dc8efbd7a3_TB8823_00 a Dependent variable: Sales (A$'000)
The above shows that for every one-unit increase in number of salespeople, average sales will increase by approximately:
A) 36 units.
B) 73 units.
C) 75 units.
D) 108 units.000) Coefficients(a) a Dependent variable: Sales (A a Predictors: (Constant), number of salespeople
ANOVA(b)
11eb99e4_52c7_057a_ab5d_81b00be8a5a3_TB8823_00 a Predictors: (Constant), number of salespeople
B Dependent Variable: Sales (A$'000)
Coefficients(a)
11eb99e4_52c7_2c8b_ab5d_25dc8efbd7a3_TB8823_00 a Dependent variable: Sales (A$'000)
The above shows that for every one-unit increase in number of salespeople, average sales will increase by approximately:
A) 36 units.
B) 73 units.
C) 75 units.
D) 108 units.000) The above shows that for every one-unit increase in number of salespeople, average sales will increase by approximately: A) 36 units. B) 73 units. C) 75 units. D) 108 units.
ANOVA(b)
11eb99e4_52c7_057a_ab5d_81b00be8a5a3_TB8823_00 a Predictors: (Constant), number of salespeople
B Dependent Variable: Sales (A$'000)
Coefficients(a)
11eb99e4_52c7_2c8b_ab5d_25dc8efbd7a3_TB8823_00 a Dependent variable: Sales (A$'000)
The above shows that for every one-unit increase in number of salespeople, average sales will increase by approximately:
A) 36 units.
B) 73 units.
C) 75 units.
D) 108 units.
ANOVA(b)
11eb99e4_52c7_057a_ab5d_81b00be8a5a3_TB8823_00 a Predictors: (Constant), number of salespeople
B Dependent Variable: Sales (A$'000)
Coefficients(a)
11eb99e4_52c7_2c8b_ab5d_25dc8efbd7a3_TB8823_00 a Dependent variable: Sales (A$'000)
The above shows that for every one-unit increase in number of salespeople, average sales will increase by approximately:
A) 36 units.
B) 73 units.
C) 75 units.
D) 108 units.
" class="answers-bank-image d-block" loading="lazy" > a Predictors: (Constant), number of salespeople
ANOVA(b)
11eb99e4_52c7_057a_ab5d_81b00be8a5a3_TB8823_00 a Predictors: (Constant), number of salespeople
B Dependent Variable: Sales (A$'000)
Coefficients(a)
11eb99e4_52c7_2c8b_ab5d_25dc8efbd7a3_TB8823_00 a Dependent variable: Sales (A$'000)
The above shows that for every one-unit increase in number of salespeople, average sales will increase by approximately:
A) 36 units.
B) 73 units.
C) 75 units.
D) 108 units.000) The above shows that for every one-unit increase in number of salespeople, average sales will increase by approximately: A) 36 units. B) 73 units. C) 75 units. D) 108 units.
ANOVA(b)
11eb99e4_52c7_057a_ab5d_81b00be8a5a3_TB8823_00 a Predictors: (Constant), number of salespeople
B Dependent Variable: Sales (A$'000)
Coefficients(a)
11eb99e4_52c7_2c8b_ab5d_25dc8efbd7a3_TB8823_00 a Dependent variable: Sales (A$'000)
The above shows that for every one-unit increase in number of salespeople, average sales will increase by approximately:
A) 36 units.
B) 73 units.
C) 75 units.
D) 108 units.
" class="answers-bank-image d-block" loading="lazy" > a Predictors: (Constant), number of salespeople
B Dependent Variable: Sales (A$'000)
Coefficients(a)
11eb99e4_52c7_2c8b_ab5d_25dc8efbd7a3_TB8823_00 a Dependent variable: Sales (A$'000)
The above shows that for every one-unit increase in number of salespeople, average sales will increase by approximately:
A) 36 units.
B) 73 units.
C) 75 units.
D) 108 units.000) Coefficients(a) a Dependent variable: Sales (A a Predictors: (Constant), number of salespeople
ANOVA(b)
11eb99e4_52c7_057a_ab5d_81b00be8a5a3_TB8823_00 a Predictors: (Constant), number of salespeople
B Dependent Variable: Sales (A$'000)
Coefficients(a)
11eb99e4_52c7_2c8b_ab5d_25dc8efbd7a3_TB8823_00 a Dependent variable: Sales (A$'000)
The above shows that for every one-unit increase in number of salespeople, average sales will increase by approximately:
A) 36 units.
B) 73 units.
C) 75 units.
D) 108 units.000) The above shows that for every one-unit increase in number of salespeople, average sales will increase by approximately: A) 36 units. B) 73 units. C) 75 units. D) 108 units.
B Dependent Variable: Sales (A$'000)
Coefficients(a)
11eb99e4_52c7_2c8b_ab5d_25dc8efbd7a3_TB8823_00 a Dependent variable: Sales (A$'000)
The above shows that for every one-unit increase in number of salespeople, average sales will increase by approximately:
A) 36 units.
B) 73 units.
C) 75 units.
D) 108 units.
ANOVA(b)
11eb99e4_52c7_057a_ab5d_81b00be8a5a3_TB8823_00 a Predictors: (Constant), number of salespeople
B Dependent Variable: Sales (A$'000)
Coefficients(a)
11eb99e4_52c7_2c8b_ab5d_25dc8efbd7a3_TB8823_00 a Dependent variable: Sales (A$'000)
The above shows that for every one-unit increase in number of salespeople, average sales will increase by approximately:
A) 36 units.
B) 73 units.
C) 75 units.
D) 108 units.
" class="answers-bank-image d-block" loading="lazy" > a Predictors: (Constant), number of salespeople
ANOVA(b)
11eb99e4_52c7_057a_ab5d_81b00be8a5a3_TB8823_00 a Predictors: (Constant), number of salespeople
B Dependent Variable: Sales (A$'000)
Coefficients(a)
11eb99e4_52c7_2c8b_ab5d_25dc8efbd7a3_TB8823_00 a Dependent variable: Sales (A$'000)
The above shows that for every one-unit increase in number of salespeople, average sales will increase by approximately:
A) 36 units.
B) 73 units.
C) 75 units.
D) 108 units.000) The above shows that for every one-unit increase in number of salespeople, average sales will increase by approximately: A) 36 units. B) 73 units. C) 75 units. D) 108 units.
ANOVA(b)
11eb99e4_52c7_057a_ab5d_81b00be8a5a3_TB8823_00 a Predictors: (Constant), number of salespeople
B Dependent Variable: Sales (A$'000)
Coefficients(a)
11eb99e4_52c7_2c8b_ab5d_25dc8efbd7a3_TB8823_00 a Dependent variable: Sales (A$'000)
The above shows that for every one-unit increase in number of salespeople, average sales will increase by approximately:
A) 36 units.
B) 73 units.
C) 75 units.
D) 108 units.
" class="answers-bank-image d-block" loading="lazy" > a Dependent variable: Sales (A$'000)
The above shows that for every one-unit increase in number of salespeople, average sales will increase by approximately:
A) 36 units.
B) 73 units.
C) 75 units.
D) 108 units.000) Coefficients(a) a Dependent variable: Sales (A a Predictors: (Constant), number of salespeople
ANOVA(b)
11eb99e4_52c7_057a_ab5d_81b00be8a5a3_TB8823_00 a Predictors: (Constant), number of salespeople
B Dependent Variable: Sales (A$'000)
Coefficients(a)
11eb99e4_52c7_2c8b_ab5d_25dc8efbd7a3_TB8823_00 a Dependent variable: Sales (A$'000)
The above shows that for every one-unit increase in number of salespeople, average sales will increase by approximately:
A) 36 units.
B) 73 units.
C) 75 units.
D) 108 units.000) The above shows that for every one-unit increase in number of salespeople, average sales will increase by approximately: A) 36 units. B) 73 units. C) 75 units. D) 108 units.
The above shows that for every one-unit increase in number of salespeople, average sales will increase by approximately:
A) 36 units.
B) 73 units.
C) 75 units.
D) 108 units.
ANOVA(b)
11eb99e4_52c7_057a_ab5d_81b00be8a5a3_TB8823_00 a Predictors: (Constant), number of salespeople
B Dependent Variable: Sales (A$'000)
Coefficients(a)
11eb99e4_52c7_2c8b_ab5d_25dc8efbd7a3_TB8823_00 a Dependent variable: Sales (A$'000)
The above shows that for every one-unit increase in number of salespeople, average sales will increase by approximately:
A) 36 units.
B) 73 units.
C) 75 units.
D) 108 units.
" class="answers-bank-image d-block" loading="lazy" > a Predictors: (Constant), number of salespeople
ANOVA(b)
11eb99e4_52c7_057a_ab5d_81b00be8a5a3_TB8823_00 a Predictors: (Constant), number of salespeople
B Dependent Variable: Sales (A$'000)
Coefficients(a)
11eb99e4_52c7_2c8b_ab5d_25dc8efbd7a3_TB8823_00 a Dependent variable: Sales (A$'000)
The above shows that for every one-unit increase in number of salespeople, average sales will increase by approximately:
A) 36 units.
B) 73 units.
C) 75 units.
D) 108 units.000) Coefficients(a) a Dependent variable: Sales (A a Predictors: (Constant), number of salespeople
ANOVA(b)
11eb99e4_52c7_057a_ab5d_81b00be8a5a3_TB8823_00 a Predictors: (Constant), number of salespeople
B Dependent Variable: Sales (A$'000)
Coefficients(a)
11eb99e4_52c7_2c8b_ab5d_25dc8efbd7a3_TB8823_00 a Dependent variable: Sales (A$'000)
The above shows that for every one-unit increase in number of salespeople, average sales will increase by approximately:
A) 36 units.
B) 73 units.
C) 75 units.
D) 108 units.000) The above shows that for every one-unit increase in number of salespeople, average sales will increase by approximately: A) 36 units. B) 73 units. C) 75 units. D) 108 units.
ANOVA(b)
11eb99e4_52c7_057a_ab5d_81b00be8a5a3_TB8823_00 a Predictors: (Constant), number of salespeople
B Dependent Variable: Sales (A$'000)
Coefficients(a)
11eb99e4_52c7_2c8b_ab5d_25dc8efbd7a3_TB8823_00 a Dependent variable: Sales (A$'000)
The above shows that for every one-unit increase in number of salespeople, average sales will increase by approximately:
A) 36 units.
B) 73 units.
C) 75 units.
D) 108 units.
ANOVA(b)
11eb99e4_52c7_057a_ab5d_81b00be8a5a3_TB8823_00 a Predictors: (Constant), number of salespeople
B Dependent Variable: Sales (A$'000)
Coefficients(a)
11eb99e4_52c7_2c8b_ab5d_25dc8efbd7a3_TB8823_00 a Dependent variable: Sales (A$'000)
The above shows that for every one-unit increase in number of salespeople, average sales will increase by approximately:
A) 36 units.
B) 73 units.
C) 75 units.
D) 108 units.
" class="answers-bank-image d-block" loading="lazy" > a Predictors: (Constant), number of salespeople
ANOVA(b)
11eb99e4_52c7_057a_ab5d_81b00be8a5a3_TB8823_00 a Predictors: (Constant), number of salespeople
B Dependent Variable: Sales (A$'000)
Coefficients(a)
11eb99e4_52c7_2c8b_ab5d_25dc8efbd7a3_TB8823_00 a Dependent variable: Sales (A$'000)
The above shows that for every one-unit increase in number of salespeople, average sales will increase by approximately:
A) 36 units.
B) 73 units.
C) 75 units.
D) 108 units.000) The above shows that for every one-unit increase in number of salespeople, average sales will increase by approximately: A) 36 units. B) 73 units. C) 75 units. D) 108 units.
ANOVA(b)
11eb99e4_52c7_057a_ab5d_81b00be8a5a3_TB8823_00 a Predictors: (Constant), number of salespeople
B Dependent Variable: Sales (A$'000)
Coefficients(a)
11eb99e4_52c7_2c8b_ab5d_25dc8efbd7a3_TB8823_00 a Dependent variable: Sales (A$'000)
The above shows that for every one-unit increase in number of salespeople, average sales will increase by approximately:
A) 36 units.
B) 73 units.
C) 75 units.
D) 108 units.
" class="answers-bank-image d-block" loading="lazy" > a Predictors: (Constant), number of salespeople
B Dependent Variable: Sales (A$'000)
Coefficients(a)
11eb99e4_52c7_2c8b_ab5d_25dc8efbd7a3_TB8823_00 a Dependent variable: Sales (A$'000)
The above shows that for every one-unit increase in number of salespeople, average sales will increase by approximately:
A) 36 units.
B) 73 units.
C) 75 units.
D) 108 units.000) Coefficients(a) a Dependent variable: Sales (A a Predictors: (Constant), number of salespeople
ANOVA(b)
11eb99e4_52c7_057a_ab5d_81b00be8a5a3_TB8823_00 a Predictors: (Constant), number of salespeople
B Dependent Variable: Sales (A$'000)
Coefficients(a)
11eb99e4_52c7_2c8b_ab5d_25dc8efbd7a3_TB8823_00 a Dependent variable: Sales (A$'000)
The above shows that for every one-unit increase in number of salespeople, average sales will increase by approximately:
A) 36 units.
B) 73 units.
C) 75 units.
D) 108 units.000) The above shows that for every one-unit increase in number of salespeople, average sales will increase by approximately: A) 36 units. B) 73 units. C) 75 units. D) 108 units.
B Dependent Variable: Sales (A$'000)
Coefficients(a)
11eb99e4_52c7_2c8b_ab5d_25dc8efbd7a3_TB8823_00 a Dependent variable: Sales (A$'000)
The above shows that for every one-unit increase in number of salespeople, average sales will increase by approximately:
A) 36 units.
B) 73 units.
C) 75 units.
D) 108 units.
ANOVA(b)
11eb99e4_52c7_057a_ab5d_81b00be8a5a3_TB8823_00 a Predictors: (Constant), number of salespeople
B Dependent Variable: Sales (A$'000)
Coefficients(a)
11eb99e4_52c7_2c8b_ab5d_25dc8efbd7a3_TB8823_00 a Dependent variable: Sales (A$'000)
The above shows that for every one-unit increase in number of salespeople, average sales will increase by approximately:
A) 36 units.
B) 73 units.
C) 75 units.
D) 108 units.
" class="answers-bank-image d-block" loading="lazy" > a Predictors: (Constant), number of salespeople
ANOVA(b)
11eb99e4_52c7_057a_ab5d_81b00be8a5a3_TB8823_00 a Predictors: (Constant), number of salespeople
B Dependent Variable: Sales (A$'000)
Coefficients(a)
11eb99e4_52c7_2c8b_ab5d_25dc8efbd7a3_TB8823_00 a Dependent variable: Sales (A$'000)
The above shows that for every one-unit increase in number of salespeople, average sales will increase by approximately:
A) 36 units.
B) 73 units.
C) 75 units.
D) 108 units.

فتح الحزمة
قم بالتسجيل لفتح البطاقات في هذه المجموعة!
Unlock Deck
Unlock Deck
1/68
العب
ملء الشاشة (f)
Deck 14: Bivariate Statistical Analysis: Tests of Association
1
Bivariate regression can be applied on two metric variables.
True
2
The mathematical symbol Y is commonly used for the independent variable, and X typically denotes the dependent variable.
False
3
The statistical significance of a correlation can be tested using the t-test.
True
4
In correlation analysis, if associated values of the two variables differ from their means in the same direction, their covariance will be negative.
فتح الحزمة
افتح القفل للوصول البطاقات البالغ عددها 68 في هذه المجموعة.
فتح الحزمة
k this deck
5
'Test of association' is a general term that refers to a number of bivariate statistical techniques used to measure whether or not two variables are associated with each other.
فتح الحزمة
افتح القفل للوصول البطاقات البالغ عددها 68 في هذه المجموعة.
فتح الحزمة
k this deck
6
In situations in which the data are ordinal, the Pearson correlation technique may be used.
فتح الحزمة
افتح القفل للوصول البطاقات البالغ عددها 68 في هذه المجموعة.
فتح الحزمة
k this deck
7
Regression is a statistical technique for measuring the curvilinear association between a dependent and independent variable.
فتح الحزمة
افتح القفل للوصول البطاقات البالغ عددها 68 في هذه المجموعة.
فتح الحزمة
k this deck
8
In correlation analysis, the alternative hypothesis is typically stated as ρ ≠ 1.
فتح الحزمة
افتح القفل للوصول البطاقات البالغ عددها 68 في هذه المجموعة.
فتح الحزمة
k this deck
9
If r = 0, it indicates that the two variables under study are interdependent.
فتح الحزمة
افتح القفل للوصول البطاقات البالغ عددها 68 في هذه المجموعة.
فتح الحزمة
k this deck
10
The Pearson's correlation coefficient is a standardised measure of effect size.
فتح الحزمة
افتح القفل للوصول البطاقات البالغ عددها 68 في هذه المجموعة.
فتح الحزمة
k this deck
11
The coefficient of determination measures the part of the total variance of Y that is accounted for by knowing the value of X.
فتح الحزمة
افتح القفل للوصول البطاقات البالغ عددها 68 في هذه المجموعة.
فتح الحزمة
k this deck
12
Correlation and regression analysis can be used to test for simple associations between two nominal variables.
فتح الحزمة
افتح القفل للوصول البطاقات البالغ عددها 68 في هذه المجموعة.
فتح الحزمة
k this deck
13
The Chi-square test is typically used for nominal variables which are dichotomous in nature.
فتح الحزمة
افتح القفل للوصول البطاقات البالغ عددها 68 في هذه المجموعة.
فتح الحزمة
k this deck
14
In correlation analysis, the null hypothesis is typically stated as ρ = 0.
فتح الحزمة
افتح القفل للوصول البطاقات البالغ عددها 68 في هذه المجموعة.
فتح الحزمة
k this deck
15
The Pearson correlation analysis is a statistical procedure that tests for differences between two interval variables.
فتح الحزمة
افتح القفل للوصول البطاقات البالغ عددها 68 في هذه المجموعة.
فتح الحزمة
k this deck
16
If the value of r is +1.0, there is no relationship between the two variables under study.
فتح الحزمة
افتح القفل للوصول البطاقات البالغ عددها 68 في هذه المجموعة.
فتح الحزمة
k this deck
17
If the value of r = 0, there is a perfect positive relationship between the two variables under study.
فتح الحزمة
افتح القفل للوصول البطاقات البالغ عددها 68 في هذه المجموعة.
فتح الحزمة
k this deck
18
A correlation analysis can be used to ascertain whether or not gender is related to brand awareness.
فتح الحزمة
افتح القفل للوصول البطاقات البالغ عددها 68 في هذه المجموعة.
فتح الحزمة
k this deck
19
The Pearson's correlation coefficient is a statistical measure of causality between two variables.
فتح الحزمة
افتح القفل للوصول البطاقات البالغ عددها 68 في هذه المجموعة.
فتح الحزمة
k this deck
20
In a regression equation, the slope of the line is the change in Y that occurs due to a corresponding change of one unit of X.
فتح الحزمة
افتح القفل للوصول البطاقات البالغ عددها 68 في هذه المجموعة.
فتح الحزمة
k this deck
21
A correlation matrix can quickly give the researcher an overview of the direction, strength and statistical significance of each paired relationship.
فتح الحزمة
افتح القفل للوصول البطاقات البالغ عددها 68 في هذه المجموعة.
فتح الحزمة
k this deck
22
To compute the Chi-square value for the contingency table, the researcher must first identify an expected distribution for that table.
فتح الحزمة
افتح القفل للوصول البطاقات البالغ عددها 68 في هذه المجموعة.
فتح الحزمة
k this deck
23
To calculate the expected frequencies for the cells in a cross tabulation, the actual observed numbers of respondents in each individual cell is required.
فتح الحزمة
افتح القفل للوصول البطاقات البالغ عددها 68 في هذه المجموعة.
فتح الحزمة
k this deck
24
The Chi-square test analyses the significance of the data in an R x C contingency table, in which R stands for row and C stands for column.
فتح الحزمة
افتح القفل للوصول البطاقات البالغ عددها 68 في هذه المجموعة.
فتح الحزمة
k this deck
25
All of the following statistical tests can be used to test for associations between variables, except:
A) Spearman's rank correlation.
B) regression analysis.
C) Chi-square test.
D) ANOVA.
A) Spearman's rank correlation.
B) regression analysis.
C) Chi-square test.
D) ANOVA.
فتح الحزمة
افتح القفل للوصول البطاقات البالغ عددها 68 في هذه المجموعة.
فتح الحزمة
k this deck
26
Which type of statistical test is appropriate for testing whether or not there is an association between two ordinal variables?
A) Chi-square test
B) Spearman's rank correlation
C) Regression analysis
D) Paired-samples t-test
A) Chi-square test
B) Spearman's rank correlation
C) Regression analysis
D) Paired-samples t-test
فتح الحزمة
افتح القفل للوصول البطاقات البالغ عددها 68 في هذه المجموعة.
فتح الحزمة
k this deck
27
A researcher would like to test whether or not gender (that is, male or female) is related to brand awareness (that is, aware or unaware). Which of the following statistical tests would you suggest?
A) Spearman's rank correlation
B) Independent samples t-test
C) Chi-square test
D) Regression analysis
A) Spearman's rank correlation
B) Independent samples t-test
C) Chi-square test
D) Regression analysis
فتح الحزمة
افتح القفل للوصول البطاقات البالغ عددها 68 في هذه المجموعة.
فتح الحزمة
k this deck
28
One of the simplest techniques for describing sets of relationships between two interval variables is the cross-tabulation.
فتح الحزمة
افتح القفل للوصول البطاقات البالغ عددها 68 في هذه المجموعة.
فتح الحزمة
k this deck
29
All of the following statements about the Correlation Coefficient are true, except:
A) It provides direction of association.
B) It provides strength of association.
C) It provides statistical significance of association.
D) It provides the variance in associations.
A) It provides direction of association.
B) It provides strength of association.
C) It provides statistical significance of association.
D) It provides the variance in associations.
فتح الحزمة
افتح القفل للوصول البطاقات البالغ عددها 68 في هذه المجموعة.
فتح الحزمة
k this deck
30
In regression analysis, the error of a predicted score is found by subtracting the predicted value of Y from the actual value of Y.
فتح الحزمة
افتح القفل للوصول البطاقات البالغ عددها 68 في هذه المجموعة.
فتح الحزمة
k this deck
31
An F-test can be applied to a regression to determine the residual error.
فتح الحزمة
افتح القفل للوصول البطاقات البالغ عددها 68 في هذه المجموعة.
فتح الحزمة
k this deck
32
A Spearman's rank-order correlation coefficient examines the relationship between two ordinal variables.
فتح الحزمة
افتح القفل للوصول البطاقات البالغ عددها 68 في هذه المجموعة.
فتح الحزمة
k this deck
33
If there is no relationship between two variables, then the Pearson's correlation coefficient between them will be:
A) +1.0.
B) -1.0.
C) +0.50.
D) 0.
A) +1.0.
B) -1.0.
C) +0.50.
D) 0.
فتح الحزمة
افتح القفل للوصول البطاقات البالغ عددها 68 في هذه المجموعة.
فتح الحزمة
k this deck
34
When testing for association between two variables, it is possible that they can be statistically significant but not appear to be meaningfully associated.
فتح الحزمة
افتح القفل للوصول البطاقات البالغ عددها 68 في هذه المجموعة.
فتح الحزمة
k this deck
35
Bivariate linear regression investigates the relationship between a dependent variable and two independent variables.
فتح الحزمة
افتح القفل للوصول البطاقات البالغ عددها 68 في هذه المجموعة.
فتح الحزمة
k this deck
36
The Chi-square test tests the goodness of fit of the observed distribution with the expected distribution.
فتح الحزمة
افتح القفل للوصول البطاقات البالغ عددها 68 في هذه المجموعة.
فتح الحزمة
k this deck
37
To use the Chi-square test, both variables in a 2 x 2 contingency table must be measured on a ratio or interval scale.
فتح الحزمة
افتح القفل للوصول البطاقات البالغ عددها 68 في هذه المجموعة.
فتح الحزمة
k this deck
38
The appropriate statistical test to use to calculate the association between two nominal variables is:
A) Spearman's rank correlation
B) regression analysis.
C) Chi-square test.
D) correlation analysis.
A) Spearman's rank correlation
B) regression analysis.
C) Chi-square test.
D) correlation analysis.
فتح الحزمة
افتح القفل للوصول البطاقات البالغ عددها 68 في هذه المجموعة.
فتح الحزمة
k this deck
39
The least-squares regression line minimises the sum of the squared deviations of the actual values from the predicted values in the regression line.
فتح الحزمة
افتح القفل للوصول البطاقات البالغ عددها 68 في هذه المجموعة.
فتح الحزمة
k this deck
40
A researcher would like to predict sales volume against advertising dollar expenditure. Which of the following statistical tests would you suggest?
A) Spearman's rank correlation
B) Correlation analysis
C) Chi-square analysis
D) Regression analysis
A) Spearman's rank correlation
B) Correlation analysis
C) Chi-square analysis
D) Regression analysis
فتح الحزمة
افتح القفل للوصول البطاقات البالغ عددها 68 في هذه المجموعة.
فتح الحزمة
k this deck
41
The correlations table below indicates that: Correlations
** Correlation is significant at the 0.01 level (two-tailed).
A) about 75 per cent of variance in sales can be explained by the variance in advertising expenditure.
B) about 57 per cent of the variance in advertising expenditure can be explained by the variance in sales.
C) about 57 per cent of the variance in sales can be explained by the variance in advertising expenditure.
D) about 75 per cent of the variance in advertising expenditure can be explained by the variance in sales.
** Correlation is significant at the 0.01 level (two-tailed).A) about 75 per cent of variance in sales can be explained by the variance in advertising expenditure.
B) about 57 per cent of the variance in advertising expenditure can be explained by the variance in sales.
C) about 57 per cent of the variance in sales can be explained by the variance in advertising expenditure.
D) about 75 per cent of the variance in advertising expenditure can be explained by the variance in sales.
فتح الحزمة
افتح القفل للوصول البطاقات البالغ عددها 68 في هذه المجموعة.
فتح الحزمة
k this deck
42
To determine the proportion of variance in the dependent variable that is explained by the independent variable, which of the following needs to be derived?
A) The Pearson's correlation coefficient
B) The regression coefficient
C) The residual error
D) The coefficient of determination
A) The Pearson's correlation coefficient
B) The regression coefficient
C) The residual error
D) The coefficient of determination
فتح الحزمة
افتح القفل للوصول البطاقات البالغ عددها 68 في هذه المجموعة.
فتح الحزمة
k this deck
43
The coefficient of determination, r², ranges from:
A) zero to +1.0.
B) -1.0 to zero.
C) -1.0 to +1.0.
D) -2.0 to +2.0.
A) zero to +1.0.
B) -1.0 to zero.
C) -1.0 to +1.0.
D) -2.0 to +2.0.
فتح الحزمة
افتح القفل للوصول البطاقات البالغ عددها 68 في هذه المجموعة.
فتح الحزمة
k this deck
44
In a regression equation, if the average value of X is 4.6, the average value of Y is 2.3, and the slope is -1.2, then the y-intercept is approximately:
A) 5.70.
B) 0.42.
C) 7.82.
D) 3.22.
A) 5.70.
B) 0.42.
C) 7.82.
D) 3.22.
فتح الحزمة
افتح القفل للوصول البطاقات البالغ عددها 68 في هذه المجموعة.
فتح الحزمة
k this deck
45
If the correlation between X and Y is -0.42, approximately what percentage of the variance in Y can be explained by X?
A) 18 per cent
B) 42 per cent
C) 21 per cent
D) 84 per cent
A) 18 per cent
B) 42 per cent
C) 21 per cent
D) 84 per cent
فتح الحزمة
افتح القفل للوصول البطاقات البالغ عددها 68 في هذه المجموعة.
فتح الحزمة
k this deck
46
The formula below is the formula for _______________________.
A) the standard error of the estimate
B) the standard error of the mean
C) the coefficient of determination
D) the Pearson's correlation coefficient
A) the standard error of the estimate
B) the standard error of the mean
C) the coefficient of determination
D) the Pearson's correlation coefficient
فتح الحزمة
افتح القفل للوصول البطاقات البالغ عددها 68 في هذه المجموعة.
فتح الحزمة
k this deck
47
In correlation analysis, the strength of the association between the variables under investigation is determined by:
A) how close the coefficient is to zero.
B) how close the significance value is to 1.
C) how close the coefficient is to ±1.
D) whether the coefficient is positive or negative.
A) how close the coefficient is to zero.
B) how close the significance value is to 1.
C) how close the coefficient is to ±1.
D) whether the coefficient is positive or negative.
فتح الحزمة
افتح القفل للوصول البطاقات البالغ عددها 68 في هذه المجموعة.
فتح الحزمة
k this deck
48
Which of the following statements is true?
A) Causation always exists when there is a high correlation between the variables.
B) Variables can be statistically related even if they are not causally related.
C) Regression can be used to measure the linear association between two nominal variables.
D) When the correlation between two variables is 0, it implies a perfect positive association.
فتح الحزمة
افتح القفل للوصول البطاقات البالغ عددها 68 في هذه المجموعة.
فتح الحزمة
k this deck
49
If the relationship between two variables is such that both variables are caused by a third variable, then the original relationship between the first two variables is said to be:
A) strong.
B) weak.
C) neutral.
D) spurious.
A) strong.
B) weak.
C) neutral.
D) spurious.
فتح الحزمة
افتح القفل للوصول البطاقات البالغ عددها 68 في هذه المجموعة.
فتح الحزمة
k this deck
50
In regression analysis, the deviation not explained by the regression is known as the:
A) sampling error.
B) residual error.
C) total error.
D) standardised error.
A) sampling error.
B) residual error.
C) total error.
D) standardised error.
فتح الحزمة
افتح القفل للوصول البطاقات البالغ عددها 68 في هذه المجموعة.
فتح الحزمة
k this deck
51
Suppose that two groups of consumers (for example, males and females) are asked to rank, in order of preference, the brands of a product class (for example, microwave meals). Which statistical test would be appropriate to determine the agreement between the two groups?
A) Correlation analysis
B) Chi-square analysis
C) Spearman's correlation
D) Independent samples t-test
A) Correlation analysis
B) Chi-square analysis
C) Spearman's correlation
D) Independent samples t-test
فتح الحزمة
افتح القفل للوصول البطاقات البالغ عددها 68 في هذه المجموعة.
فتح الحزمة
k this deck
52
What is the most common cut-off significance value for accepting or rejecting hypothesis?
A) .05
B) .15
C) .20
D) .25
A) .05
B) .15
C) .20
D) .25
فتح الحزمة
افتح القفل للوصول البطاقات البالغ عددها 68 في هذه المجموعة.
فتح الحزمة
k this deck
53
When examining regression results, how well the model fits the data is determined by consulting the:
A) R-square.
B) F statistic.
C) standardised coefficient.
D) calculated t-value.
A) R-square.
B) F statistic.
C) standardised coefficient.
D) calculated t-value.
فتح الحزمة
افتح القفل للوصول البطاقات البالغ عددها 68 في هذه المجموعة.
فتح الحزمة
k this deck
54
In the regression equation, is the:
A) residual error.
B) independent variable.
C) regression coefficient.
D) standardised coefficient.
A) residual error.
B) independent variable.
C) regression coefficient.
D) standardised coefficient.
فتح الحزمة
افتح القفل للوصول البطاقات البالغ عددها 68 في هذه المجموعة.
فتح الحزمة
k this deck
55
When the correlation between two variables is -0.32 and its associated significance level (p-value) is 0.0352, it is implied that:
A) there is no relationship between the variables.
B) there is a weak inverse relationship between the variables.
C) there is a moderate inverse relationship between the variables.
D) there is a strong inverse relationship between the variables.
A) there is no relationship between the variables.
B) there is a weak inverse relationship between the variables.
C) there is a moderate inverse relationship between the variables.
D) there is a strong inverse relationship between the variables.
فتح الحزمة
افتح القفل للوصول البطاقات البالغ عددها 68 في هذه المجموعة.
فتح الحزمة
k this deck
56
When the correlation between two variables is +0.52 and its associated significance level (p-value) is 0.153, it is implied that:
A) there is no relationship between the variables.
B) there is a weak positive relationship between the variables.
C) there is a moderate positive relationship between the variables.
D) there is a strong positive relationship between the variables.
A) there is no relationship between the variables.
B) there is a weak positive relationship between the variables.
C) there is a moderate positive relationship between the variables.
D) there is a strong positive relationship between the variables.
فتح الحزمة
افتح القفل للوصول البطاقات البالغ عددها 68 في هذه المجموعة.
فتح الحزمة
k this deck
57
In the regression equation, is the symbol for the:
A) residual error.
B) y-intercept.
C) regression coefficient.
D) standard error of the estimate.
A) residual error.
B) y-intercept.
C) regression coefficient.
D) standard error of the estimate.
فتح الحزمة
افتح القفل للوصول البطاقات البالغ عددها 68 في هذه المجموعة.
فتح الحزمة
k this deck
58
The correlations table below indicates that: Correlations
** Correlation is significant at the 0.01 level (two-tailed).
A) about 35 per cent of variance in productivity can be explained by the variance in months employed.
B) about 71 per cent of the variance in productivity can be explained by the variance in months employed.
C) about 13 per cent of the variance in productivity can be explained by the variance in months employed.
D) there is no association between productivity and months employed.
** Correlation is significant at the 0.01 level (two-tailed).A) about 35 per cent of variance in productivity can be explained by the variance in months employed.
B) about 71 per cent of the variance in productivity can be explained by the variance in months employed.
C) about 13 per cent of the variance in productivity can be explained by the variance in months employed.
D) there is no association between productivity and months employed.
فتح الحزمة
افتح القفل للوصول البطاقات البالغ عددها 68 في هذه المجموعة.
فتح الحزمة
k this deck
59
Which of the following is not true for regression?
A) It determines the direction of association.
B) It determines the strength of association.
C) It predicts value of one variable based on the value of another variable.
D) It determines the variance in the direction of the relationship between three or more variables.
A) It determines the direction of association.
B) It determines the strength of association.
C) It predicts value of one variable based on the value of another variable.
D) It determines the variance in the direction of the relationship between three or more variables.
فتح الحزمة
افتح القفل للوصول البطاقات البالغ عددها 68 في هذه المجموعة.
فتح الحزمة
k this deck
60
Under which of the following condition should the researcher examine the data for problem?
A) When a regression returns a standardized β coefficient less than 1 or greater than 1
B) When a regression returns a standardized β coefficient less than 2 or greater than 2
C) When a regression returns a standardized β coefficient less than 5 or greater than 5
D) When a regression returns a standardized β coefficient less than 10 or greater than 10
فتح الحزمة
افتح القفل للوصول البطاقات البالغ عددها 68 في هذه المجموعة.
فتح الحزمة
k this deck
61
Two groups of students - those looking to study science degrees and those looking to study business degrees - are asked to rank, in order of preference, the universities they are applying for. The researcher then wants to determine the correlation between the two groups. Which statistical test is most appropriate?
A) Pearson's correlation coefficient
B) Chi-square test
C) Spearman's rank-order correlation coefficient
D) Independent samples t-test
A) Pearson's correlation coefficient
B) Chi-square test
C) Spearman's rank-order correlation coefficient
D) Independent samples t-test
فتح الحزمة
افتح القفل للوصول البطاقات البالغ عددها 68 في هذه المجموعة.
فتح الحزمة
k this deck
62
The regression output for sales and advertising spend is shown below. Model summary
a Predictors: (Constant), advertising spend
ANOVA(b)
11eb99e4_52c7_7aad_ab5d_a97cebb53082_TB8823_00 a Predictors: (Constant), advertising spend
B Dependent variable: Sales (A$'000)
Coefficients(a)
11eb99e4_52c7_7aae_ab5d_e1db6a89764e_TB8823_00 a Dependent variable: Sales (A$'000)
The above shows that:
A) approximately 45 per cent of the variance in sales can be explained by advertising spend.
B) approximately 43 per cent of the variance in Sales can be explained by advertising spend.
C) approximately 14 per cent of the variance in sales can be explained by advertising spend.
D) approximately 20 per cent of the variance in sales can be explained by advertising spend.000) Coefficients(a) a Dependent variable: Sales (A a Predictors: (Constant), advertising spend
ANOVA(b)
11eb99e4_52c7_7aad_ab5d_a97cebb53082_TB8823_00 a Predictors: (Constant), advertising spend
B Dependent variable: Sales (A$'000)
Coefficients(a)
11eb99e4_52c7_7aae_ab5d_e1db6a89764e_TB8823_00 a Dependent variable: Sales (A$'000)
The above shows that:
A) approximately 45 per cent of the variance in sales can be explained by advertising spend.
B) approximately 43 per cent of the variance in Sales can be explained by advertising spend.
C) approximately 14 per cent of the variance in sales can be explained by advertising spend.
D) approximately 20 per cent of the variance in sales can be explained by advertising spend.000) The above shows that: A) approximately 45 per cent of the variance in sales can be explained by advertising spend. B) approximately 43 per cent of the variance in Sales can be explained by advertising spend. C) approximately 14 per cent of the variance in sales can be explained by advertising spend. D) approximately 20 per cent of the variance in sales can be explained by advertising spend. " class="answers-bank-image d-block" loading="lazy" > a Predictors: (Constant), advertising spend
B Dependent variable: Sales (A$'000)
Coefficients(a)
11eb99e4_52c7_7aae_ab5d_e1db6a89764e_TB8823_00 a Dependent variable: Sales (A$'000)
The above shows that:
A) approximately 45 per cent of the variance in sales can be explained by advertising spend.
B) approximately 43 per cent of the variance in Sales can be explained by advertising spend.
C) approximately 14 per cent of the variance in sales can be explained by advertising spend.
D) approximately 20 per cent of the variance in sales can be explained by advertising spend.000) Coefficients(a) a Dependent variable: Sales (A a Predictors: (Constant), advertising spend
ANOVA(b)
11eb99e4_52c7_7aad_ab5d_a97cebb53082_TB8823_00 a Predictors: (Constant), advertising spend
B Dependent variable: Sales (A$'000)
Coefficients(a)
11eb99e4_52c7_7aae_ab5d_e1db6a89764e_TB8823_00 a Dependent variable: Sales (A$'000)
The above shows that:
A) approximately 45 per cent of the variance in sales can be explained by advertising spend.
B) approximately 43 per cent of the variance in Sales can be explained by advertising spend.
C) approximately 14 per cent of the variance in sales can be explained by advertising spend.
D) approximately 20 per cent of the variance in sales can be explained by advertising spend.000) The above shows that: A) approximately 45 per cent of the variance in sales can be explained by advertising spend. B) approximately 43 per cent of the variance in Sales can be explained by advertising spend. C) approximately 14 per cent of the variance in sales can be explained by advertising spend. D) approximately 20 per cent of the variance in sales can be explained by advertising spend. " class="answers-bank-image d-block" loading="lazy" > a Predictors: (Constant), advertising spend
ANOVA(b)
11eb99e4_52c7_7aad_ab5d_a97cebb53082_TB8823_00 a Predictors: (Constant), advertising spend
B Dependent variable: Sales (A$'000)
Coefficients(a)
11eb99e4_52c7_7aae_ab5d_e1db6a89764e_TB8823_00 a Dependent variable: Sales (A$'000)
The above shows that:
A) approximately 45 per cent of the variance in sales can be explained by advertising spend.
B) approximately 43 per cent of the variance in Sales can be explained by advertising spend.
C) approximately 14 per cent of the variance in sales can be explained by advertising spend.
D) approximately 20 per cent of the variance in sales can be explained by advertising spend.000) Coefficients(a) a Dependent variable: Sales (A a Dependent variable: Sales (A$'000)
The above shows that:
A) approximately 45 per cent of the variance in sales can be explained by advertising spend.
B) approximately 43 per cent of the variance in Sales can be explained by advertising spend.
C) approximately 14 per cent of the variance in sales can be explained by advertising spend.
D) approximately 20 per cent of the variance in sales can be explained by advertising spend.000) Coefficients(a) a Dependent variable: Sales (A a Predictors: (Constant), advertising spend
ANOVA(b)
11eb99e4_52c7_7aad_ab5d_a97cebb53082_TB8823_00 a Predictors: (Constant), advertising spend
B Dependent variable: Sales (A$'000)
Coefficients(a)
11eb99e4_52c7_7aae_ab5d_e1db6a89764e_TB8823_00 a Dependent variable: Sales (A$'000)
The above shows that:
A) approximately 45 per cent of the variance in sales can be explained by advertising spend.
B) approximately 43 per cent of the variance in Sales can be explained by advertising spend.
C) approximately 14 per cent of the variance in sales can be explained by advertising spend.
D) approximately 20 per cent of the variance in sales can be explained by advertising spend.000) The above shows that: A) approximately 45 per cent of the variance in sales can be explained by advertising spend. B) approximately 43 per cent of the variance in Sales can be explained by advertising spend. C) approximately 14 per cent of the variance in sales can be explained by advertising spend. D) approximately 20 per cent of the variance in sales can be explained by advertising spend. " class="answers-bank-image d-block" loading="lazy" > a Predictors: (Constant), advertising spend
ANOVA(b)
11eb99e4_52c7_7aad_ab5d_a97cebb53082_TB8823_00 a Predictors: (Constant), advertising spend
B Dependent variable: Sales (A$'000)
Coefficients(a)
11eb99e4_52c7_7aae_ab5d_e1db6a89764e_TB8823_00 a Dependent variable: Sales (A$'000)
The above shows that:
A) approximately 45 per cent of the variance in sales can be explained by advertising spend.
B) approximately 43 per cent of the variance in Sales can be explained by advertising spend.
C) approximately 14 per cent of the variance in sales can be explained by advertising spend.
D) approximately 20 per cent of the variance in sales can be explained by advertising spend.000) Coefficients(a) a Dependent variable: Sales (A a Predictors: (Constant), advertising spend
ANOVA(b)
11eb99e4_52c7_7aad_ab5d_a97cebb53082_TB8823_00 a Predictors: (Constant), advertising spend
B Dependent variable: Sales (A$'000)
Coefficients(a)
11eb99e4_52c7_7aae_ab5d_e1db6a89764e_TB8823_00 a Dependent variable: Sales (A$'000)
The above shows that:
A) approximately 45 per cent of the variance in sales can be explained by advertising spend.
B) approximately 43 per cent of the variance in Sales can be explained by advertising spend.
C) approximately 14 per cent of the variance in sales can be explained by advertising spend.
D) approximately 20 per cent of the variance in sales can be explained by advertising spend.000) The above shows that: A) approximately 45 per cent of the variance in sales can be explained by advertising spend. B) approximately 43 per cent of the variance in Sales can be explained by advertising spend. C) approximately 14 per cent of the variance in sales can be explained by advertising spend. D) approximately 20 per cent of the variance in sales can be explained by advertising spend. " class="answers-bank-image d-block" loading="lazy" > a Predictors: (Constant), advertising spend
ANOVA(b)
11eb99e4_52c7_7aad_ab5d_a97cebb53082_TB8823_00 a Predictors: (Constant), advertising spend
B Dependent variable: Sales (A$'000)
Coefficients(a)
11eb99e4_52c7_7aae_ab5d_e1db6a89764e_TB8823_00 a Dependent variable: Sales (A$'000)
The above shows that:
A) approximately 45 per cent of the variance in sales can be explained by advertising spend.
B) approximately 43 per cent of the variance in Sales can be explained by advertising spend.
C) approximately 14 per cent of the variance in sales can be explained by advertising spend.
D) approximately 20 per cent of the variance in sales can be explained by advertising spend.000) The above shows that: A) approximately 45 per cent of the variance in sales can be explained by advertising spend. B) approximately 43 per cent of the variance in Sales can be explained by advertising spend. C) approximately 14 per cent of the variance in sales can be explained by advertising spend. D) approximately 20 per cent of the variance in sales can be explained by advertising spend. " class="answers-bank-image d-block" loading="lazy" > a Predictors: (Constant), advertising spend
B Dependent variable: Sales (A$'000)
Coefficients(a)
11eb99e4_52c7_7aae_ab5d_e1db6a89764e_TB8823_00 a Dependent variable: Sales (A$'000)
The above shows that:
A) approximately 45 per cent of the variance in sales can be explained by advertising spend.
B) approximately 43 per cent of the variance in Sales can be explained by advertising spend.
C) approximately 14 per cent of the variance in sales can be explained by advertising spend.
D) approximately 20 per cent of the variance in sales can be explained by advertising spend.000) Coefficients(a) a Dependent variable: Sales (A a Predictors: (Constant), advertising spend
ANOVA(b)
11eb99e4_52c7_7aad_ab5d_a97cebb53082_TB8823_00 a Predictors: (Constant), advertising spend
B Dependent variable: Sales (A$'000)
Coefficients(a)
11eb99e4_52c7_7aae_ab5d_e1db6a89764e_TB8823_00 a Dependent variable: Sales (A$'000)
The above shows that:
A) approximately 45 per cent of the variance in sales can be explained by advertising spend.
B) approximately 43 per cent of the variance in Sales can be explained by advertising spend.
C) approximately 14 per cent of the variance in sales can be explained by advertising spend.
D) approximately 20 per cent of the variance in sales can be explained by advertising spend.000) The above shows that: A) approximately 45 per cent of the variance in sales can be explained by advertising spend. B) approximately 43 per cent of the variance in Sales can be explained by advertising spend. C) approximately 14 per cent of the variance in sales can be explained by advertising spend. D) approximately 20 per cent of the variance in sales can be explained by advertising spend. " class="answers-bank-image d-block" loading="lazy" > a Predictors: (Constant), advertising spend
ANOVA(b)
11eb99e4_52c7_7aad_ab5d_a97cebb53082_TB8823_00 a Predictors: (Constant), advertising spend
B Dependent variable: Sales (A$'000)
Coefficients(a)
11eb99e4_52c7_7aae_ab5d_e1db6a89764e_TB8823_00 a Dependent variable: Sales (A$'000)
The above shows that:
A) approximately 45 per cent of the variance in sales can be explained by advertising spend.
B) approximately 43 per cent of the variance in Sales can be explained by advertising spend.
C) approximately 14 per cent of the variance in sales can be explained by advertising spend.
D) approximately 20 per cent of the variance in sales can be explained by advertising spend.000) The above shows that: A) approximately 45 per cent of the variance in sales can be explained by advertising spend. B) approximately 43 per cent of the variance in Sales can be explained by advertising spend. C) approximately 14 per cent of the variance in sales can be explained by advertising spend. D) approximately 20 per cent of the variance in sales can be explained by advertising spend. " class="answers-bank-image d-block" loading="lazy" > a Dependent variable: Sales (A$'000)
The above shows that:
A) approximately 45 per cent of the variance in sales can be explained by advertising spend.
B) approximately 43 per cent of the variance in Sales can be explained by advertising spend.
C) approximately 14 per cent of the variance in sales can be explained by advertising spend.
D) approximately 20 per cent of the variance in sales can be explained by advertising spend.000) Coefficients(a) a Dependent variable: Sales (A a Predictors: (Constant), advertising spend
ANOVA(b)
11eb99e4_52c7_7aad_ab5d_a97cebb53082_TB8823_00 a Predictors: (Constant), advertising spend
B Dependent variable: Sales (A$'000)
Coefficients(a)
11eb99e4_52c7_7aae_ab5d_e1db6a89764e_TB8823_00 a Dependent variable: Sales (A$'000)
The above shows that:
A) approximately 45 per cent of the variance in sales can be explained by advertising spend.
B) approximately 43 per cent of the variance in Sales can be explained by advertising spend.
C) approximately 14 per cent of the variance in sales can be explained by advertising spend.
D) approximately 20 per cent of the variance in sales can be explained by advertising spend.000) The above shows that: A) approximately 45 per cent of the variance in sales can be explained by advertising spend. B) approximately 43 per cent of the variance in Sales can be explained by advertising spend. C) approximately 14 per cent of the variance in sales can be explained by advertising spend. D) approximately 20 per cent of the variance in sales can be explained by advertising spend. " class="answers-bank-image d-block" loading="lazy" > a Predictors: (Constant), advertising spend
ANOVA(b)
11eb99e4_52c7_7aad_ab5d_a97cebb53082_TB8823_00 a Predictors: (Constant), advertising spend
B Dependent variable: Sales (A$'000)
Coefficients(a)
11eb99e4_52c7_7aae_ab5d_e1db6a89764e_TB8823_00 a Dependent variable: Sales (A$'000)
The above shows that:
A) approximately 45 per cent of the variance in sales can be explained by advertising spend.
B) approximately 43 per cent of the variance in Sales can be explained by advertising spend.
C) approximately 14 per cent of the variance in sales can be explained by advertising spend.
D) approximately 20 per cent of the variance in sales can be explained by advertising spend.000) Coefficients(a) a Dependent variable: Sales (A a Predictors: (Constant), advertising spend
ANOVA(b)
11eb99e4_52c7_7aad_ab5d_a97cebb53082_TB8823_00 a Predictors: (Constant), advertising spend
B Dependent variable: Sales (A$'000)
Coefficients(a)
11eb99e4_52c7_7aae_ab5d_e1db6a89764e_TB8823_00 a Dependent variable: Sales (A$'000)
The above shows that:
A) approximately 45 per cent of the variance in sales can be explained by advertising spend.
B) approximately 43 per cent of the variance in Sales can be explained by advertising spend.
C) approximately 14 per cent of the variance in sales can be explained by advertising spend.
D) approximately 20 per cent of the variance in sales can be explained by advertising spend.000) The above shows that: A) approximately 45 per cent of the variance in sales can be explained by advertising spend. B) approximately 43 per cent of the variance in Sales can be explained by advertising spend. C) approximately 14 per cent of the variance in sales can be explained by advertising spend. D) approximately 20 per cent of the variance in sales can be explained by advertising spend. " class="answers-bank-image d-block" loading="lazy" > a Predictors: (Constant), advertising spend
ANOVA(b)
11eb99e4_52c7_7aad_ab5d_a97cebb53082_TB8823_00 a Predictors: (Constant), advertising spend
B Dependent variable: Sales (A$'000)
Coefficients(a)
11eb99e4_52c7_7aae_ab5d_e1db6a89764e_TB8823_00 a Dependent variable: Sales (A$'000)
The above shows that:
A) approximately 45 per cent of the variance in sales can be explained by advertising spend.
B) approximately 43 per cent of the variance in Sales can be explained by advertising spend.
C) approximately 14 per cent of the variance in sales can be explained by advertising spend.
D) approximately 20 per cent of the variance in sales can be explained by advertising spend.000) The above shows that: A) approximately 45 per cent of the variance in sales can be explained by advertising spend. B) approximately 43 per cent of the variance in Sales can be explained by advertising spend. C) approximately 14 per cent of the variance in sales can be explained by advertising spend. D) approximately 20 per cent of the variance in sales can be explained by advertising spend. " class="answers-bank-image d-block" loading="lazy" > a Predictors: (Constant), advertising spend
B Dependent variable: Sales (A$'000)
Coefficients(a)
11eb99e4_52c7_7aae_ab5d_e1db6a89764e_TB8823_00 a Dependent variable: Sales (A$'000)
The above shows that:
A) approximately 45 per cent of the variance in sales can be explained by advertising spend.
B) approximately 43 per cent of the variance in Sales can be explained by advertising spend.
C) approximately 14 per cent of the variance in sales can be explained by advertising spend.
D) approximately 20 per cent of the variance in sales can be explained by advertising spend.000) Coefficients(a) a Dependent variable: Sales (A a Predictors: (Constant), advertising spend
ANOVA(b)
11eb99e4_52c7_7aad_ab5d_a97cebb53082_TB8823_00 a Predictors: (Constant), advertising spend
B Dependent variable: Sales (A$'000)
Coefficients(a)
11eb99e4_52c7_7aae_ab5d_e1db6a89764e_TB8823_00 a Dependent variable: Sales (A$'000)
The above shows that:
A) approximately 45 per cent of the variance in sales can be explained by advertising spend.
B) approximately 43 per cent of the variance in Sales can be explained by advertising spend.
C) approximately 14 per cent of the variance in sales can be explained by advertising spend.
D) approximately 20 per cent of the variance in sales can be explained by advertising spend.000) The above shows that: A) approximately 45 per cent of the variance in sales can be explained by advertising spend. B) approximately 43 per cent of the variance in Sales can be explained by advertising spend. C) approximately 14 per cent of the variance in sales can be explained by advertising spend. D) approximately 20 per cent of the variance in sales can be explained by advertising spend. " class="answers-bank-image d-block" loading="lazy" > a Predictors: (Constant), advertising spend
ANOVA(b)
11eb99e4_52c7_7aad_ab5d_a97cebb53082_TB8823_00 a Predictors: (Constant), advertising spend
B Dependent variable: Sales (A$'000)
Coefficients(a)
11eb99e4_52c7_7aae_ab5d_e1db6a89764e_TB8823_00 a Dependent variable: Sales (A$'000)
The above shows that:
A) approximately 45 per cent of the variance in sales can be explained by advertising spend.
B) approximately 43 per cent of the variance in Sales can be explained by advertising spend.
C) approximately 14 per cent of the variance in sales can be explained by advertising spend.
D) approximately 20 per cent of the variance in sales can be explained by advertising spend.
a Predictors: (Constant), advertising spendANOVA(b)
11eb99e4_52c7_7aad_ab5d_a97cebb53082_TB8823_00 a Predictors: (Constant), advertising spend
B Dependent variable: Sales (A$'000)
Coefficients(a)
11eb99e4_52c7_7aae_ab5d_e1db6a89764e_TB8823_00 a Dependent variable: Sales (A$'000)
The above shows that:
A) approximately 45 per cent of the variance in sales can be explained by advertising spend.
B) approximately 43 per cent of the variance in Sales can be explained by advertising spend.
C) approximately 14 per cent of the variance in sales can be explained by advertising spend.
D) approximately 20 per cent of the variance in sales can be explained by advertising spend.
ANOVA(b)
11eb99e4_52c7_7aad_ab5d_a97cebb53082_TB8823_00 a Predictors: (Constant), advertising spend
B Dependent variable: Sales (A$'000)
Coefficients(a)
11eb99e4_52c7_7aae_ab5d_e1db6a89764e_TB8823_00 a Dependent variable: Sales (A$'000)
The above shows that:
A) approximately 45 per cent of the variance in sales can be explained by advertising spend.
B) approximately 43 per cent of the variance in Sales can be explained by advertising spend.
C) approximately 14 per cent of the variance in sales can be explained by advertising spend.
D) approximately 20 per cent of the variance in sales can be explained by advertising spend.
ANOVA(b)
11eb99e4_52c7_7aad_ab5d_a97cebb53082_TB8823_00 a Predictors: (Constant), advertising spend
B Dependent variable: Sales (A$'000)
Coefficients(a)
11eb99e4_52c7_7aae_ab5d_e1db6a89764e_TB8823_00 a Dependent variable: Sales (A$'000)
The above shows that:
A) approximately 45 per cent of the variance in sales can be explained by advertising spend.
B) approximately 43 per cent of the variance in Sales can be explained by advertising spend.
C) approximately 14 per cent of the variance in sales can be explained by advertising spend.
D) approximately 20 per cent of the variance in sales can be explained by advertising spend.
ANOVA(b)
11eb99e4_52c7_7aad_ab5d_a97cebb53082_TB8823_00 a Predictors: (Constant), advertising spend
B Dependent variable: Sales (A$'000)
Coefficients(a)
11eb99e4_52c7_7aae_ab5d_e1db6a89764e_TB8823_00 a Dependent variable: Sales (A$'000)
The above shows that:
A) approximately 45 per cent of the variance in sales can be explained by advertising spend.
B) approximately 43 per cent of the variance in Sales can be explained by advertising spend.
C) approximately 14 per cent of the variance in sales can be explained by advertising spend.
D) approximately 20 per cent of the variance in sales can be explained by advertising spend.
ANOVA(b)
11eb99e4_52c7_7aad_ab5d_a97cebb53082_TB8823_00 a Predictors: (Constant), advertising spend
B Dependent variable: Sales (A$'000)
Coefficients(a)
11eb99e4_52c7_7aae_ab5d_e1db6a89764e_TB8823_00 a Dependent variable: Sales (A$'000)
The above shows that:
A) approximately 45 per cent of the variance in sales can be explained by advertising spend.
B) approximately 43 per cent of the variance in Sales can be explained by advertising spend.
C) approximately 14 per cent of the variance in sales can be explained by advertising spend.
D) approximately 20 per cent of the variance in sales can be explained by advertising spend.
ANOVA(b)
11eb99e4_52c7_7aad_ab5d_a97cebb53082_TB8823_00 a Predictors: (Constant), advertising spend
B Dependent variable: Sales (A$'000)
Coefficients(a)
11eb99e4_52c7_7aae_ab5d_e1db6a89764e_TB8823_00 a Dependent variable: Sales (A$'000)
The above shows that:
A) approximately 45 per cent of the variance in sales can be explained by advertising spend.
B) approximately 43 per cent of the variance in Sales can be explained by advertising spend.
C) approximately 14 per cent of the variance in sales can be explained by advertising spend.
D) approximately 20 per cent of the variance in sales can be explained by advertising spend.
ANOVA(b)
11eb99e4_52c7_7aad_ab5d_a97cebb53082_TB8823_00 a Predictors: (Constant), advertising spend
B Dependent variable: Sales (A$'000)
Coefficients(a)
11eb99e4_52c7_7aae_ab5d_e1db6a89764e_TB8823_00 a Dependent variable: Sales (A$'000)
The above shows that:
A) approximately 45 per cent of the variance in sales can be explained by advertising spend.
B) approximately 43 per cent of the variance in Sales can be explained by advertising spend.
C) approximately 14 per cent of the variance in sales can be explained by advertising spend.
D) approximately 20 per cent of the variance in sales can be explained by advertising spend.
ANOVA(b)
11eb99e4_52c7_7aad_ab5d_a97cebb53082_TB8823_00 a Predictors: (Constant), advertising spend
B Dependent variable: Sales (A$'000)
Coefficients(a)
11eb99e4_52c7_7aae_ab5d_e1db6a89764e_TB8823_00 a Dependent variable: Sales (A$'000)
The above shows that:
A) approximately 45 per cent of the variance in sales can be explained by advertising spend.
B) approximately 43 per cent of the variance in Sales can be explained by advertising spend.
C) approximately 14 per cent of the variance in sales can be explained by advertising spend.
D) approximately 20 per cent of the variance in sales can be explained by advertising spend.
ANOVA(b)
11eb99e4_52c7_7aad_ab5d_a97cebb53082_TB8823_00 a Predictors: (Constant), advertising spend
B Dependent variable: Sales (A$'000)
Coefficients(a)
11eb99e4_52c7_7aae_ab5d_e1db6a89764e_TB8823_00 a Dependent variable: Sales (A$'000)
The above shows that:
A) approximately 45 per cent of the variance in sales can be explained by advertising spend.
B) approximately 43 per cent of the variance in Sales can be explained by advertising spend.
C) approximately 14 per cent of the variance in sales can be explained by advertising spend.
D) approximately 20 per cent of the variance in sales can be explained by advertising spend.
فتح الحزمة
افتح القفل للوصول البطاقات البالغ عددها 68 في هذه المجموعة.
فتح الحزمة
k this deck
63
The Chi-square test involves comparing ________ frequencies with the ________ frequencies.
A) observed; actual
B) expected; predicted
C) expected; forecast
D) observed; expected
A) observed; actual
B) expected; predicted
C) expected; forecast
D) observed; expected
فتح الحزمة
افتح القفل للوصول البطاقات البالغ عددها 68 في هذه المجموعة.
فتح الحزمة
k this deck
64
In a regression equation, if the average value of Y is 15.6, the average value of X is 5.3, and the y-intercept is 8.5, then the slope is approximately:
A) 1.13.
B) 1.21.
C) 4.55.
D) 1.34.
A) 1.13.
B) 1.21.
C) 4.55.
D) 1.34.
فتح الحزمة
افتح القفل للوصول البطاقات البالغ عددها 68 في هذه المجموعة.
فتح الحزمة
k this deck
65
A research hypothesis states that male university students are more likely to study STEM courses than female university students. Thus, the researcher would like test to see if an association exists between gender and area of study. Which statistical test is most appropriate?
A) Pearson's correlation coefficient
B) Chi-square test
C) Spearman's rank-order correlation coefficient
D) Independent samples t-test
A) Pearson's correlation coefficient
B) Chi-square test
C) Spearman's rank-order correlation coefficient
D) Independent samples t-test
فتح الحزمة
افتح القفل للوصول البطاقات البالغ عددها 68 في هذه المجموعة.
فتح الحزمة
k this deck
66
The regression outputs for sales and number of salespeople are shown below. Model summary
a Predictors: (Constant), number of salespeople
ANOVA(b)
11eb99e4_52c6_b757_ab5d_4f32ec741319_TB8823_00 a Predictors: (Constant), number of salespeople
B Dependent variable: Sales (A$'000)
Coefficients(a)
11eb99e4_52c6_b758_ab5d_6d4af4bd58fe_TB8823_00 a Dependent variable: Sales (A$'000)
The above shows that:
A) for every one-unit increase in number of salespeople, average sales will increase by approximately 73 units
B) the regression results suggested a good model fit
C) the observed results occurred as a result of sampling error
D) the regression coefficient is significant000) Coefficients(a) a Dependent variable: Sales (A a Predictors: (Constant), number of salespeople
ANOVA(b)
11eb99e4_52c6_b757_ab5d_4f32ec741319_TB8823_00 a Predictors: (Constant), number of salespeople
B Dependent variable: Sales (A$'000)
Coefficients(a)
11eb99e4_52c6_b758_ab5d_6d4af4bd58fe_TB8823_00 a Dependent variable: Sales (A$'000)
The above shows that:
A) for every one-unit increase in number of salespeople, average sales will increase by approximately 73 units
B) the regression results suggested a good model fit
C) the observed results occurred as a result of sampling error
D) the regression coefficient is significant000) The above shows that: A) for every one-unit increase in number of salespeople, average sales will increase by approximately 73 units B) the regression results suggested a good model fit C) the observed results occurred as a result of sampling error D) the regression coefficient is significant " class="answers-bank-image d-block" loading="lazy" > a Predictors: (Constant), number of salespeople
B Dependent variable: Sales (A$'000)
Coefficients(a)
11eb99e4_52c6_b758_ab5d_6d4af4bd58fe_TB8823_00 a Dependent variable: Sales (A$'000)
The above shows that:
A) for every one-unit increase in number of salespeople, average sales will increase by approximately 73 units
B) the regression results suggested a good model fit
C) the observed results occurred as a result of sampling error
D) the regression coefficient is significant000) Coefficients(a) a Dependent variable: Sales (A a Predictors: (Constant), number of salespeople
ANOVA(b)
11eb99e4_52c6_b757_ab5d_4f32ec741319_TB8823_00 a Predictors: (Constant), number of salespeople
B Dependent variable: Sales (A$'000)
Coefficients(a)
11eb99e4_52c6_b758_ab5d_6d4af4bd58fe_TB8823_00 a Dependent variable: Sales (A$'000)
The above shows that:
A) for every one-unit increase in number of salespeople, average sales will increase by approximately 73 units
B) the regression results suggested a good model fit
C) the observed results occurred as a result of sampling error
D) the regression coefficient is significant000) The above shows that: A) for every one-unit increase in number of salespeople, average sales will increase by approximately 73 units B) the regression results suggested a good model fit C) the observed results occurred as a result of sampling error D) the regression coefficient is significant " class="answers-bank-image d-block" loading="lazy" > a Predictors: (Constant), number of salespeople
ANOVA(b)
11eb99e4_52c6_b757_ab5d_4f32ec741319_TB8823_00 a Predictors: (Constant), number of salespeople
B Dependent variable: Sales (A$'000)
Coefficients(a)
11eb99e4_52c6_b758_ab5d_6d4af4bd58fe_TB8823_00 a Dependent variable: Sales (A$'000)
The above shows that:
A) for every one-unit increase in number of salespeople, average sales will increase by approximately 73 units
B) the regression results suggested a good model fit
C) the observed results occurred as a result of sampling error
D) the regression coefficient is significant000) Coefficients(a) a Dependent variable: Sales (A a Dependent variable: Sales (A$'000)
The above shows that:
A) for every one-unit increase in number of salespeople, average sales will increase by approximately 73 units
B) the regression results suggested a good model fit
C) the observed results occurred as a result of sampling error
D) the regression coefficient is significant000) Coefficients(a) a Dependent variable: Sales (A a Predictors: (Constant), number of salespeople
ANOVA(b)
11eb99e4_52c6_b757_ab5d_4f32ec741319_TB8823_00 a Predictors: (Constant), number of salespeople
B Dependent variable: Sales (A$'000)
Coefficients(a)
11eb99e4_52c6_b758_ab5d_6d4af4bd58fe_TB8823_00 a Dependent variable: Sales (A$'000)
The above shows that:
A) for every one-unit increase in number of salespeople, average sales will increase by approximately 73 units
B) the regression results suggested a good model fit
C) the observed results occurred as a result of sampling error
D) the regression coefficient is significant000) The above shows that: A) for every one-unit increase in number of salespeople, average sales will increase by approximately 73 units B) the regression results suggested a good model fit C) the observed results occurred as a result of sampling error D) the regression coefficient is significant " class="answers-bank-image d-block" loading="lazy" > a Predictors: (Constant), number of salespeople
ANOVA(b)
11eb99e4_52c6_b757_ab5d_4f32ec741319_TB8823_00 a Predictors: (Constant), number of salespeople
B Dependent variable: Sales (A$'000)
Coefficients(a)
11eb99e4_52c6_b758_ab5d_6d4af4bd58fe_TB8823_00 a Dependent variable: Sales (A$'000)
The above shows that:
A) for every one-unit increase in number of salespeople, average sales will increase by approximately 73 units
B) the regression results suggested a good model fit
C) the observed results occurred as a result of sampling error
D) the regression coefficient is significant000) Coefficients(a) a Dependent variable: Sales (A a Predictors: (Constant), number of salespeople
ANOVA(b)
11eb99e4_52c6_b757_ab5d_4f32ec741319_TB8823_00 a Predictors: (Constant), number of salespeople
B Dependent variable: Sales (A$'000)
Coefficients(a)
11eb99e4_52c6_b758_ab5d_6d4af4bd58fe_TB8823_00 a Dependent variable: Sales (A$'000)
The above shows that:
A) for every one-unit increase in number of salespeople, average sales will increase by approximately 73 units
B) the regression results suggested a good model fit
C) the observed results occurred as a result of sampling error
D) the regression coefficient is significant000) The above shows that: A) for every one-unit increase in number of salespeople, average sales will increase by approximately 73 units B) the regression results suggested a good model fit C) the observed results occurred as a result of sampling error D) the regression coefficient is significant " class="answers-bank-image d-block" loading="lazy" > a Predictors: (Constant), number of salespeople
ANOVA(b)
11eb99e4_52c6_b757_ab5d_4f32ec741319_TB8823_00 a Predictors: (Constant), number of salespeople
B Dependent variable: Sales (A$'000)
Coefficients(a)
11eb99e4_52c6_b758_ab5d_6d4af4bd58fe_TB8823_00 a Dependent variable: Sales (A$'000)
The above shows that:
A) for every one-unit increase in number of salespeople, average sales will increase by approximately 73 units
B) the regression results suggested a good model fit
C) the observed results occurred as a result of sampling error
D) the regression coefficient is significant000) The above shows that: A) for every one-unit increase in number of salespeople, average sales will increase by approximately 73 units B) the regression results suggested a good model fit C) the observed results occurred as a result of sampling error D) the regression coefficient is significant " class="answers-bank-image d-block" loading="lazy" > a Predictors: (Constant), number of salespeople
B Dependent variable: Sales (A$'000)
Coefficients(a)
11eb99e4_52c6_b758_ab5d_6d4af4bd58fe_TB8823_00 a Dependent variable: Sales (A$'000)
The above shows that:
A) for every one-unit increase in number of salespeople, average sales will increase by approximately 73 units
B) the regression results suggested a good model fit
C) the observed results occurred as a result of sampling error
D) the regression coefficient is significant000) Coefficients(a) a Dependent variable: Sales (A a Predictors: (Constant), number of salespeople
ANOVA(b)
11eb99e4_52c6_b757_ab5d_4f32ec741319_TB8823_00 a Predictors: (Constant), number of salespeople
B Dependent variable: Sales (A$'000)
Coefficients(a)
11eb99e4_52c6_b758_ab5d_6d4af4bd58fe_TB8823_00 a Dependent variable: Sales (A$'000)
The above shows that:
A) for every one-unit increase in number of salespeople, average sales will increase by approximately 73 units
B) the regression results suggested a good model fit
C) the observed results occurred as a result of sampling error
D) the regression coefficient is significant000) The above shows that: A) for every one-unit increase in number of salespeople, average sales will increase by approximately 73 units B) the regression results suggested a good model fit C) the observed results occurred as a result of sampling error D) the regression coefficient is significant " class="answers-bank-image d-block" loading="lazy" > a Predictors: (Constant), number of salespeople
ANOVA(b)
11eb99e4_52c6_b757_ab5d_4f32ec741319_TB8823_00 a Predictors: (Constant), number of salespeople
B Dependent variable: Sales (A$'000)
Coefficients(a)
11eb99e4_52c6_b758_ab5d_6d4af4bd58fe_TB8823_00 a Dependent variable: Sales (A$'000)
The above shows that:
A) for every one-unit increase in number of salespeople, average sales will increase by approximately 73 units
B) the regression results suggested a good model fit
C) the observed results occurred as a result of sampling error
D) the regression coefficient is significant000) The above shows that: A) for every one-unit increase in number of salespeople, average sales will increase by approximately 73 units B) the regression results suggested a good model fit C) the observed results occurred as a result of sampling error D) the regression coefficient is significant " class="answers-bank-image d-block" loading="lazy" > a Dependent variable: Sales (A$'000)
The above shows that:
A) for every one-unit increase in number of salespeople, average sales will increase by approximately 73 units
B) the regression results suggested a good model fit
C) the observed results occurred as a result of sampling error
D) the regression coefficient is significant000) Coefficients(a) a Dependent variable: Sales (A a Predictors: (Constant), number of salespeople
ANOVA(b)
11eb99e4_52c6_b757_ab5d_4f32ec741319_TB8823_00 a Predictors: (Constant), number of salespeople
B Dependent variable: Sales (A$'000)
Coefficients(a)
11eb99e4_52c6_b758_ab5d_6d4af4bd58fe_TB8823_00 a Dependent variable: Sales (A$'000)
The above shows that:
A) for every one-unit increase in number of salespeople, average sales will increase by approximately 73 units
B) the regression results suggested a good model fit
C) the observed results occurred as a result of sampling error
D) the regression coefficient is significant000) The above shows that: A) for every one-unit increase in number of salespeople, average sales will increase by approximately 73 units B) the regression results suggested a good model fit C) the observed results occurred as a result of sampling error D) the regression coefficient is significant " class="answers-bank-image d-block" loading="lazy" > a Predictors: (Constant), number of salespeople
ANOVA(b)
11eb99e4_52c6_b757_ab5d_4f32ec741319_TB8823_00 a Predictors: (Constant), number of salespeople
B Dependent variable: Sales (A$'000)
Coefficients(a)
11eb99e4_52c6_b758_ab5d_6d4af4bd58fe_TB8823_00 a Dependent variable: Sales (A$'000)
The above shows that:
A) for every one-unit increase in number of salespeople, average sales will increase by approximately 73 units
B) the regression results suggested a good model fit
C) the observed results occurred as a result of sampling error
D) the regression coefficient is significant000) Coefficients(a) a Dependent variable: Sales (A a Predictors: (Constant), number of salespeople
ANOVA(b)
11eb99e4_52c6_b757_ab5d_4f32ec741319_TB8823_00 a Predictors: (Constant), number of salespeople
B Dependent variable: Sales (A$'000)
Coefficients(a)
11eb99e4_52c6_b758_ab5d_6d4af4bd58fe_TB8823_00 a Dependent variable: Sales (A$'000)
The above shows that:
A) for every one-unit increase in number of salespeople, average sales will increase by approximately 73 units
B) the regression results suggested a good model fit
C) the observed results occurred as a result of sampling error
D) the regression coefficient is significant000) The above shows that: A) for every one-unit increase in number of salespeople, average sales will increase by approximately 73 units B) the regression results suggested a good model fit C) the observed results occurred as a result of sampling error D) the regression coefficient is significant " class="answers-bank-image d-block" loading="lazy" > a Predictors: (Constant), number of salespeople
ANOVA(b)
11eb99e4_52c6_b757_ab5d_4f32ec741319_TB8823_00 a Predictors: (Constant), number of salespeople
B Dependent variable: Sales (A$'000)
Coefficients(a)
11eb99e4_52c6_b758_ab5d_6d4af4bd58fe_TB8823_00 a Dependent variable: Sales (A$'000)
The above shows that:
A) for every one-unit increase in number of salespeople, average sales will increase by approximately 73 units
B) the regression results suggested a good model fit
C) the observed results occurred as a result of sampling error
D) the regression coefficient is significant000) The above shows that: A) for every one-unit increase in number of salespeople, average sales will increase by approximately 73 units B) the regression results suggested a good model fit C) the observed results occurred as a result of sampling error D) the regression coefficient is significant " class="answers-bank-image d-block" loading="lazy" > a Predictors: (Constant), number of salespeople
B Dependent variable: Sales (A$'000)
Coefficients(a)
11eb99e4_52c6_b758_ab5d_6d4af4bd58fe_TB8823_00 a Dependent variable: Sales (A$'000)
The above shows that:
A) for every one-unit increase in number of salespeople, average sales will increase by approximately 73 units
B) the regression results suggested a good model fit
C) the observed results occurred as a result of sampling error
D) the regression coefficient is significant000) Coefficients(a) a Dependent variable: Sales (A a Predictors: (Constant), number of salespeople
ANOVA(b)
11eb99e4_52c6_b757_ab5d_4f32ec741319_TB8823_00 a Predictors: (Constant), number of salespeople
B Dependent variable: Sales (A$'000)
Coefficients(a)
11eb99e4_52c6_b758_ab5d_6d4af4bd58fe_TB8823_00 a Dependent variable: Sales (A$'000)
The above shows that:
A) for every one-unit increase in number of salespeople, average sales will increase by approximately 73 units
B) the regression results suggested a good model fit
C) the observed results occurred as a result of sampling error
D) the regression coefficient is significant000) The above shows that: A) for every one-unit increase in number of salespeople, average sales will increase by approximately 73 units B) the regression results suggested a good model fit C) the observed results occurred as a result of sampling error D) the regression coefficient is significant " class="answers-bank-image d-block" loading="lazy" > a Predictors: (Constant), number of salespeople
ANOVA(b)
11eb99e4_52c6_b757_ab5d_4f32ec741319_TB8823_00 a Predictors: (Constant), number of salespeople
B Dependent variable: Sales (A$'000)
Coefficients(a)
11eb99e4_52c6_b758_ab5d_6d4af4bd58fe_TB8823_00 a Dependent variable: Sales (A$'000)
The above shows that:
A) for every one-unit increase in number of salespeople, average sales will increase by approximately 73 units
B) the regression results suggested a good model fit
C) the observed results occurred as a result of sampling error
D) the regression coefficient is significant
a Predictors: (Constant), number of salespeopleANOVA(b)
11eb99e4_52c6_b757_ab5d_4f32ec741319_TB8823_00 a Predictors: (Constant), number of salespeople
B Dependent variable: Sales (A$'000)
Coefficients(a)
11eb99e4_52c6_b758_ab5d_6d4af4bd58fe_TB8823_00 a Dependent variable: Sales (A$'000)
The above shows that:
A) for every one-unit increase in number of salespeople, average sales will increase by approximately 73 units
B) the regression results suggested a good model fit
C) the observed results occurred as a result of sampling error
D) the regression coefficient is significant
ANOVA(b)
11eb99e4_52c6_b757_ab5d_4f32ec741319_TB8823_00 a Predictors: (Constant), number of salespeople
B Dependent variable: Sales (A$'000)
Coefficients(a)
11eb99e4_52c6_b758_ab5d_6d4af4bd58fe_TB8823_00 a Dependent variable: Sales (A$'000)
The above shows that:
A) for every one-unit increase in number of salespeople, average sales will increase by approximately 73 units
B) the regression results suggested a good model fit
C) the observed results occurred as a result of sampling error
D) the regression coefficient is significant
ANOVA(b)
11eb99e4_52c6_b757_ab5d_4f32ec741319_TB8823_00 a Predictors: (Constant), number of salespeople
B Dependent variable: Sales (A$'000)
Coefficients(a)
11eb99e4_52c6_b758_ab5d_6d4af4bd58fe_TB8823_00 a Dependent variable: Sales (A$'000)
The above shows that:
A) for every one-unit increase in number of salespeople, average sales will increase by approximately 73 units
B) the regression results suggested a good model fit
C) the observed results occurred as a result of sampling error
D) the regression coefficient is significant
The above shows that:
A) for every one-unit increase in number of salespeople, average sales will increase by approximately 73 units
B) the regression results suggested a good model fit
C) the observed results occurred as a result of sampling error
D) the regression coefficient is significant
ANOVA(b)
11eb99e4_52c6_b757_ab5d_4f32ec741319_TB8823_00 a Predictors: (Constant), number of salespeople
B Dependent variable: Sales (A$'000)
Coefficients(a)
11eb99e4_52c6_b758_ab5d_6d4af4bd58fe_TB8823_00 a Dependent variable: Sales (A$'000)
The above shows that:
A) for every one-unit increase in number of salespeople, average sales will increase by approximately 73 units
B) the regression results suggested a good model fit
C) the observed results occurred as a result of sampling error
D) the regression coefficient is significant
ANOVA(b)
11eb99e4_52c6_b757_ab5d_4f32ec741319_TB8823_00 a Predictors: (Constant), number of salespeople
B Dependent variable: Sales (A$'000)
Coefficients(a)
11eb99e4_52c6_b758_ab5d_6d4af4bd58fe_TB8823_00 a Dependent variable: Sales (A$'000)
The above shows that:
A) for every one-unit increase in number of salespeople, average sales will increase by approximately 73 units
B) the regression results suggested a good model fit
C) the observed results occurred as a result of sampling error
D) the regression coefficient is significant
ANOVA(b)
11eb99e4_52c6_b757_ab5d_4f32ec741319_TB8823_00 a Predictors: (Constant), number of salespeople
B Dependent variable: Sales (A$'000)
Coefficients(a)
11eb99e4_52c6_b758_ab5d_6d4af4bd58fe_TB8823_00 a Dependent variable: Sales (A$'000)
The above shows that:
A) for every one-unit increase in number of salespeople, average sales will increase by approximately 73 units
B) the regression results suggested a good model fit
C) the observed results occurred as a result of sampling error
D) the regression coefficient is significant
The above shows that:
A) for every one-unit increase in number of salespeople, average sales will increase by approximately 73 units
B) the regression results suggested a good model fit
C) the observed results occurred as a result of sampling error
D) the regression coefficient is significant
ANOVA(b)
11eb99e4_52c6_b757_ab5d_4f32ec741319_TB8823_00 a Predictors: (Constant), number of salespeople
B Dependent variable: Sales (A$'000)
Coefficients(a)
11eb99e4_52c6_b758_ab5d_6d4af4bd58fe_TB8823_00 a Dependent variable: Sales (A$'000)
The above shows that:
A) for every one-unit increase in number of salespeople, average sales will increase by approximately 73 units
B) the regression results suggested a good model fit
C) the observed results occurred as a result of sampling error
D) the regression coefficient is significant
ANOVA(b)
11eb99e4_52c6_b757_ab5d_4f32ec741319_TB8823_00 a Predictors: (Constant), number of salespeople
B Dependent variable: Sales (A$'000)
Coefficients(a)
11eb99e4_52c6_b758_ab5d_6d4af4bd58fe_TB8823_00 a Dependent variable: Sales (A$'000)
The above shows that:
A) for every one-unit increase in number of salespeople, average sales will increase by approximately 73 units
B) the regression results suggested a good model fit
C) the observed results occurred as a result of sampling error
D) the regression coefficient is significant
ANOVA(b)
11eb99e4_52c6_b757_ab5d_4f32ec741319_TB8823_00 a Predictors: (Constant), number of salespeople
B Dependent variable: Sales (A$'000)
Coefficients(a)
11eb99e4_52c6_b758_ab5d_6d4af4bd58fe_TB8823_00 a Dependent variable: Sales (A$'000)
The above shows that:
A) for every one-unit increase in number of salespeople, average sales will increase by approximately 73 units
B) the regression results suggested a good model fit
C) the observed results occurred as a result of sampling error
D) the regression coefficient is significant
فتح الحزمة
افتح القفل للوصول البطاقات البالغ عددها 68 في هذه المجموعة.
فتح الحزمة
k this deck
67
A Spearman's rank-order correlation coefficient is a technique used when determining the correlation between two _______ scaled variables.
A) nominal
B) interval
C) ordinal
D) ratio
A) nominal
B) interval
C) ordinal
D) ratio
فتح الحزمة
افتح القفل للوصول البطاقات البالغ عددها 68 في هذه المجموعة.
فتح الحزمة
k this deck
68
The regression output for sales and number of salespeople are shown below. Model summary
a Predictors: (Constant), number of salespeople
ANOVA(b)
11eb99e4_52c7_057a_ab5d_81b00be8a5a3_TB8823_00 a Predictors: (Constant), number of salespeople
B Dependent Variable: Sales (A$'000)
Coefficients(a)
11eb99e4_52c7_2c8b_ab5d_25dc8efbd7a3_TB8823_00 a Dependent variable: Sales (A$'000)
The above shows that for every one-unit increase in number of salespeople, average sales will increase by approximately:
A) 36 units.
B) 73 units.
C) 75 units.
D) 108 units.000) Coefficients(a) a Dependent variable: Sales (A a Predictors: (Constant), number of salespeople
ANOVA(b)
11eb99e4_52c7_057a_ab5d_81b00be8a5a3_TB8823_00 a Predictors: (Constant), number of salespeople
B Dependent Variable: Sales (A$'000)
Coefficients(a)
11eb99e4_52c7_2c8b_ab5d_25dc8efbd7a3_TB8823_00 a Dependent variable: Sales (A$'000)
The above shows that for every one-unit increase in number of salespeople, average sales will increase by approximately:
A) 36 units.
B) 73 units.
C) 75 units.
D) 108 units.000) The above shows that for every one-unit increase in number of salespeople, average sales will increase by approximately: A) 36 units. B) 73 units. C) 75 units. D) 108 units. " class="answers-bank-image d-block" loading="lazy" > a Predictors: (Constant), number of salespeople
B Dependent Variable: Sales (A$'000)
Coefficients(a)
11eb99e4_52c7_2c8b_ab5d_25dc8efbd7a3_TB8823_00 a Dependent variable: Sales (A$'000)
The above shows that for every one-unit increase in number of salespeople, average sales will increase by approximately:
A) 36 units.
B) 73 units.
C) 75 units.
D) 108 units.000) Coefficients(a) a Dependent variable: Sales (A a Predictors: (Constant), number of salespeople
ANOVA(b)
11eb99e4_52c7_057a_ab5d_81b00be8a5a3_TB8823_00 a Predictors: (Constant), number of salespeople
B Dependent Variable: Sales (A$'000)
Coefficients(a)
11eb99e4_52c7_2c8b_ab5d_25dc8efbd7a3_TB8823_00 a Dependent variable: Sales (A$'000)
The above shows that for every one-unit increase in number of salespeople, average sales will increase by approximately:
A) 36 units.
B) 73 units.
C) 75 units.
D) 108 units.000) The above shows that for every one-unit increase in number of salespeople, average sales will increase by approximately: A) 36 units. B) 73 units. C) 75 units. D) 108 units. " class="answers-bank-image d-block" loading="lazy" > a Predictors: (Constant), number of salespeople
ANOVA(b)
11eb99e4_52c7_057a_ab5d_81b00be8a5a3_TB8823_00 a Predictors: (Constant), number of salespeople
B Dependent Variable: Sales (A$'000)
Coefficients(a)
11eb99e4_52c7_2c8b_ab5d_25dc8efbd7a3_TB8823_00 a Dependent variable: Sales (A$'000)
The above shows that for every one-unit increase in number of salespeople, average sales will increase by approximately:
A) 36 units.
B) 73 units.
C) 75 units.
D) 108 units.000) Coefficients(a) a Dependent variable: Sales (A a Dependent variable: Sales (A$'000)
The above shows that for every one-unit increase in number of salespeople, average sales will increase by approximately:
A) 36 units.
B) 73 units.
C) 75 units.
D) 108 units.000) Coefficients(a) a Dependent variable: Sales (A a Predictors: (Constant), number of salespeople
ANOVA(b)
11eb99e4_52c7_057a_ab5d_81b00be8a5a3_TB8823_00 a Predictors: (Constant), number of salespeople
B Dependent Variable: Sales (A$'000)
Coefficients(a)
11eb99e4_52c7_2c8b_ab5d_25dc8efbd7a3_TB8823_00 a Dependent variable: Sales (A$'000)
The above shows that for every one-unit increase in number of salespeople, average sales will increase by approximately:
A) 36 units.
B) 73 units.
C) 75 units.
D) 108 units.000) The above shows that for every one-unit increase in number of salespeople, average sales will increase by approximately: A) 36 units. B) 73 units. C) 75 units. D) 108 units. " class="answers-bank-image d-block" loading="lazy" > a Predictors: (Constant), number of salespeople
ANOVA(b)
11eb99e4_52c7_057a_ab5d_81b00be8a5a3_TB8823_00 a Predictors: (Constant), number of salespeople
B Dependent Variable: Sales (A$'000)
Coefficients(a)
11eb99e4_52c7_2c8b_ab5d_25dc8efbd7a3_TB8823_00 a Dependent variable: Sales (A$'000)
The above shows that for every one-unit increase in number of salespeople, average sales will increase by approximately:
A) 36 units.
B) 73 units.
C) 75 units.
D) 108 units.000) Coefficients(a) a Dependent variable: Sales (A a Predictors: (Constant), number of salespeople
ANOVA(b)
11eb99e4_52c7_057a_ab5d_81b00be8a5a3_TB8823_00 a Predictors: (Constant), number of salespeople
B Dependent Variable: Sales (A$'000)
Coefficients(a)
11eb99e4_52c7_2c8b_ab5d_25dc8efbd7a3_TB8823_00 a Dependent variable: Sales (A$'000)
The above shows that for every one-unit increase in number of salespeople, average sales will increase by approximately:
A) 36 units.
B) 73 units.
C) 75 units.
D) 108 units.000) The above shows that for every one-unit increase in number of salespeople, average sales will increase by approximately: A) 36 units. B) 73 units. C) 75 units. D) 108 units. " class="answers-bank-image d-block" loading="lazy" > a Predictors: (Constant), number of salespeople
ANOVA(b)
11eb99e4_52c7_057a_ab5d_81b00be8a5a3_TB8823_00 a Predictors: (Constant), number of salespeople
B Dependent Variable: Sales (A$'000)
Coefficients(a)
11eb99e4_52c7_2c8b_ab5d_25dc8efbd7a3_TB8823_00 a Dependent variable: Sales (A$'000)
The above shows that for every one-unit increase in number of salespeople, average sales will increase by approximately:
A) 36 units.
B) 73 units.
C) 75 units.
D) 108 units.000) The above shows that for every one-unit increase in number of salespeople, average sales will increase by approximately: A) 36 units. B) 73 units. C) 75 units. D) 108 units. " class="answers-bank-image d-block" loading="lazy" > a Predictors: (Constant), number of salespeople
B Dependent Variable: Sales (A$'000)
Coefficients(a)
11eb99e4_52c7_2c8b_ab5d_25dc8efbd7a3_TB8823_00 a Dependent variable: Sales (A$'000)
The above shows that for every one-unit increase in number of salespeople, average sales will increase by approximately:
A) 36 units.
B) 73 units.
C) 75 units.
D) 108 units.000) Coefficients(a) a Dependent variable: Sales (A a Predictors: (Constant), number of salespeople
ANOVA(b)
11eb99e4_52c7_057a_ab5d_81b00be8a5a3_TB8823_00 a Predictors: (Constant), number of salespeople
B Dependent Variable: Sales (A$'000)
Coefficients(a)
11eb99e4_52c7_2c8b_ab5d_25dc8efbd7a3_TB8823_00 a Dependent variable: Sales (A$'000)
The above shows that for every one-unit increase in number of salespeople, average sales will increase by approximately:
A) 36 units.
B) 73 units.
C) 75 units.
D) 108 units.000) The above shows that for every one-unit increase in number of salespeople, average sales will increase by approximately: A) 36 units. B) 73 units. C) 75 units. D) 108 units. " class="answers-bank-image d-block" loading="lazy" > a Predictors: (Constant), number of salespeople
ANOVA(b)
11eb99e4_52c7_057a_ab5d_81b00be8a5a3_TB8823_00 a Predictors: (Constant), number of salespeople
B Dependent Variable: Sales (A$'000)
Coefficients(a)
11eb99e4_52c7_2c8b_ab5d_25dc8efbd7a3_TB8823_00 a Dependent variable: Sales (A$'000)
The above shows that for every one-unit increase in number of salespeople, average sales will increase by approximately:
A) 36 units.
B) 73 units.
C) 75 units.
D) 108 units.000) The above shows that for every one-unit increase in number of salespeople, average sales will increase by approximately: A) 36 units. B) 73 units. C) 75 units. D) 108 units. " class="answers-bank-image d-block" loading="lazy" > a Dependent variable: Sales (A$'000)
The above shows that for every one-unit increase in number of salespeople, average sales will increase by approximately:
A) 36 units.
B) 73 units.
C) 75 units.
D) 108 units.000) Coefficients(a) a Dependent variable: Sales (A a Predictors: (Constant), number of salespeople
ANOVA(b)
11eb99e4_52c7_057a_ab5d_81b00be8a5a3_TB8823_00 a Predictors: (Constant), number of salespeople
B Dependent Variable: Sales (A$'000)
Coefficients(a)
11eb99e4_52c7_2c8b_ab5d_25dc8efbd7a3_TB8823_00 a Dependent variable: Sales (A$'000)
The above shows that for every one-unit increase in number of salespeople, average sales will increase by approximately:
A) 36 units.
B) 73 units.
C) 75 units.
D) 108 units.000) The above shows that for every one-unit increase in number of salespeople, average sales will increase by approximately: A) 36 units. B) 73 units. C) 75 units. D) 108 units. " class="answers-bank-image d-block" loading="lazy" > a Predictors: (Constant), number of salespeople
ANOVA(b)
11eb99e4_52c7_057a_ab5d_81b00be8a5a3_TB8823_00 a Predictors: (Constant), number of salespeople
B Dependent Variable: Sales (A$'000)
Coefficients(a)
11eb99e4_52c7_2c8b_ab5d_25dc8efbd7a3_TB8823_00 a Dependent variable: Sales (A$'000)
The above shows that for every one-unit increase in number of salespeople, average sales will increase by approximately:
A) 36 units.
B) 73 units.
C) 75 units.
D) 108 units.000) Coefficients(a) a Dependent variable: Sales (A a Predictors: (Constant), number of salespeople
ANOVA(b)
11eb99e4_52c7_057a_ab5d_81b00be8a5a3_TB8823_00 a Predictors: (Constant), number of salespeople
B Dependent Variable: Sales (A$'000)
Coefficients(a)
11eb99e4_52c7_2c8b_ab5d_25dc8efbd7a3_TB8823_00 a Dependent variable: Sales (A$'000)
The above shows that for every one-unit increase in number of salespeople, average sales will increase by approximately:
A) 36 units.
B) 73 units.
C) 75 units.
D) 108 units.000) The above shows that for every one-unit increase in number of salespeople, average sales will increase by approximately: A) 36 units. B) 73 units. C) 75 units. D) 108 units. " class="answers-bank-image d-block" loading="lazy" > a Predictors: (Constant), number of salespeople
ANOVA(b)
11eb99e4_52c7_057a_ab5d_81b00be8a5a3_TB8823_00 a Predictors: (Constant), number of salespeople
B Dependent Variable: Sales (A$'000)
Coefficients(a)
11eb99e4_52c7_2c8b_ab5d_25dc8efbd7a3_TB8823_00 a Dependent variable: Sales (A$'000)
The above shows that for every one-unit increase in number of salespeople, average sales will increase by approximately:
A) 36 units.
B) 73 units.
C) 75 units.
D) 108 units.000) The above shows that for every one-unit increase in number of salespeople, average sales will increase by approximately: A) 36 units. B) 73 units. C) 75 units. D) 108 units. " class="answers-bank-image d-block" loading="lazy" > a Predictors: (Constant), number of salespeople
B Dependent Variable: Sales (A$'000)
Coefficients(a)
11eb99e4_52c7_2c8b_ab5d_25dc8efbd7a3_TB8823_00 a Dependent variable: Sales (A$'000)
The above shows that for every one-unit increase in number of salespeople, average sales will increase by approximately:
A) 36 units.
B) 73 units.
C) 75 units.
D) 108 units.000) Coefficients(a) a Dependent variable: Sales (A a Predictors: (Constant), number of salespeople
ANOVA(b)
11eb99e4_52c7_057a_ab5d_81b00be8a5a3_TB8823_00 a Predictors: (Constant), number of salespeople
B Dependent Variable: Sales (A$'000)
Coefficients(a)
11eb99e4_52c7_2c8b_ab5d_25dc8efbd7a3_TB8823_00 a Dependent variable: Sales (A$'000)
The above shows that for every one-unit increase in number of salespeople, average sales will increase by approximately:
A) 36 units.
B) 73 units.
C) 75 units.
D) 108 units.000) The above shows that for every one-unit increase in number of salespeople, average sales will increase by approximately: A) 36 units. B) 73 units. C) 75 units. D) 108 units. " class="answers-bank-image d-block" loading="lazy" > a Predictors: (Constant), number of salespeople
ANOVA(b)
11eb99e4_52c7_057a_ab5d_81b00be8a5a3_TB8823_00 a Predictors: (Constant), number of salespeople
B Dependent Variable: Sales (A$'000)
Coefficients(a)
11eb99e4_52c7_2c8b_ab5d_25dc8efbd7a3_TB8823_00 a Dependent variable: Sales (A$'000)
The above shows that for every one-unit increase in number of salespeople, average sales will increase by approximately:
A) 36 units.
B) 73 units.
C) 75 units.
D) 108 units.
a Predictors: (Constant), number of salespeopleANOVA(b)
11eb99e4_52c7_057a_ab5d_81b00be8a5a3_TB8823_00 a Predictors: (Constant), number of salespeople
B Dependent Variable: Sales (A$'000)
Coefficients(a)
11eb99e4_52c7_2c8b_ab5d_25dc8efbd7a3_TB8823_00 a Dependent variable: Sales (A$'000)
The above shows that for every one-unit increase in number of salespeople, average sales will increase by approximately:
A) 36 units.
B) 73 units.
C) 75 units.
D) 108 units.
ANOVA(b)
11eb99e4_52c7_057a_ab5d_81b00be8a5a3_TB8823_00 a Predictors: (Constant), number of salespeople
B Dependent Variable: Sales (A$'000)
Coefficients(a)
11eb99e4_52c7_2c8b_ab5d_25dc8efbd7a3_TB8823_00 a Dependent variable: Sales (A$'000)
The above shows that for every one-unit increase in number of salespeople, average sales will increase by approximately:
A) 36 units.
B) 73 units.
C) 75 units.
D) 108 units.
ANOVA(b)
11eb99e4_52c7_057a_ab5d_81b00be8a5a3_TB8823_00 a Predictors: (Constant), number of salespeople
B Dependent Variable: Sales (A$'000)
Coefficients(a)
11eb99e4_52c7_2c8b_ab5d_25dc8efbd7a3_TB8823_00 a Dependent variable: Sales (A$'000)
The above shows that for every one-unit increase in number of salespeople, average sales will increase by approximately:
A) 36 units.
B) 73 units.
C) 75 units.
D) 108 units.
The above shows that for every one-unit increase in number of salespeople, average sales will increase by approximately:
A) 36 units.
B) 73 units.
C) 75 units.
D) 108 units.
ANOVA(b)
11eb99e4_52c7_057a_ab5d_81b00be8a5a3_TB8823_00 a Predictors: (Constant), number of salespeople
B Dependent Variable: Sales (A$'000)
Coefficients(a)
11eb99e4_52c7_2c8b_ab5d_25dc8efbd7a3_TB8823_00 a Dependent variable: Sales (A$'000)
The above shows that for every one-unit increase in number of salespeople, average sales will increase by approximately:
A) 36 units.
B) 73 units.
C) 75 units.
D) 108 units.
ANOVA(b)
11eb99e4_52c7_057a_ab5d_81b00be8a5a3_TB8823_00 a Predictors: (Constant), number of salespeople
B Dependent Variable: Sales (A$'000)
Coefficients(a)
11eb99e4_52c7_2c8b_ab5d_25dc8efbd7a3_TB8823_00 a Dependent variable: Sales (A$'000)
The above shows that for every one-unit increase in number of salespeople, average sales will increase by approximately:
A) 36 units.
B) 73 units.
C) 75 units.
D) 108 units.
ANOVA(b)
11eb99e4_52c7_057a_ab5d_81b00be8a5a3_TB8823_00 a Predictors: (Constant), number of salespeople
B Dependent Variable: Sales (A$'000)
Coefficients(a)
11eb99e4_52c7_2c8b_ab5d_25dc8efbd7a3_TB8823_00 a Dependent variable: Sales (A$'000)
The above shows that for every one-unit increase in number of salespeople, average sales will increase by approximately:
A) 36 units.
B) 73 units.
C) 75 units.
D) 108 units.
The above shows that for every one-unit increase in number of salespeople, average sales will increase by approximately:
A) 36 units.
B) 73 units.
C) 75 units.
D) 108 units.
ANOVA(b)
11eb99e4_52c7_057a_ab5d_81b00be8a5a3_TB8823_00 a Predictors: (Constant), number of salespeople
B Dependent Variable: Sales (A$'000)
Coefficients(a)
11eb99e4_52c7_2c8b_ab5d_25dc8efbd7a3_TB8823_00 a Dependent variable: Sales (A$'000)
The above shows that for every one-unit increase in number of salespeople, average sales will increase by approximately:
A) 36 units.
B) 73 units.
C) 75 units.
D) 108 units.
ANOVA(b)
11eb99e4_52c7_057a_ab5d_81b00be8a5a3_TB8823_00 a Predictors: (Constant), number of salespeople
B Dependent Variable: Sales (A$'000)
Coefficients(a)
11eb99e4_52c7_2c8b_ab5d_25dc8efbd7a3_TB8823_00 a Dependent variable: Sales (A$'000)
The above shows that for every one-unit increase in number of salespeople, average sales will increase by approximately:
A) 36 units.
B) 73 units.
C) 75 units.
D) 108 units.
ANOVA(b)
11eb99e4_52c7_057a_ab5d_81b00be8a5a3_TB8823_00 a Predictors: (Constant), number of salespeople
B Dependent Variable: Sales (A$'000)
Coefficients(a)
11eb99e4_52c7_2c8b_ab5d_25dc8efbd7a3_TB8823_00 a Dependent variable: Sales (A$'000)
The above shows that for every one-unit increase in number of salespeople, average sales will increase by approximately:
A) 36 units.
B) 73 units.
C) 75 units.
D) 108 units.
فتح الحزمة
افتح القفل للوصول البطاقات البالغ عددها 68 في هذه المجموعة.
فتح الحزمة
k this deck
فتح الحزمة
افتح القفل للوصول البطاقات البالغ عددها 68 في هذه المجموعة.


