Deck 3: Graphical Methods for Describing Data
ملء الشاشة (f)
سؤال
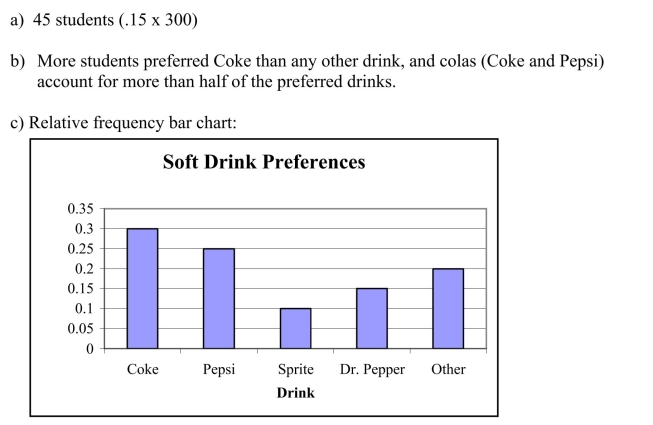
The pie chart below summarizes the results of a survey of 300 randomly selected students at a particular high school.The investigators asked about soft drink preferences at a local high school. 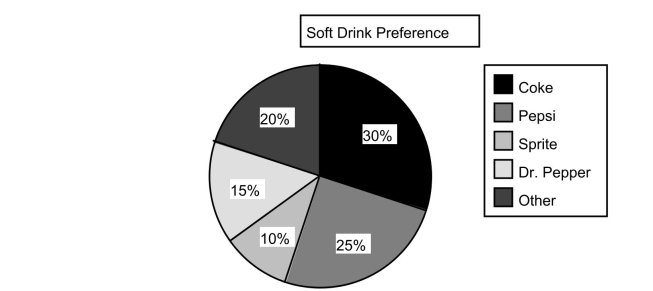
سؤال
سؤال
سؤال
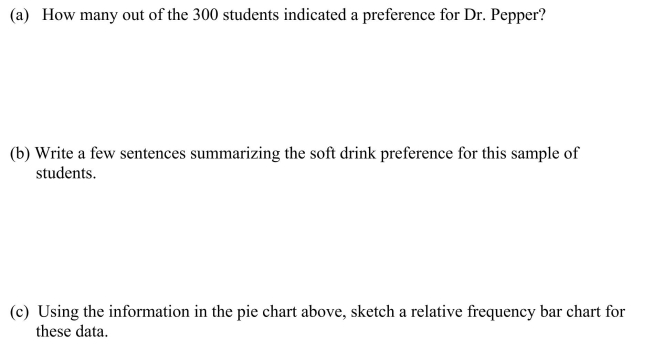
In the article, "Scaling of Mammalian Long Bones: Small and Large Mammals Compared," the average circumferences (distances around)in mm of the humerus, femur, and tibia of different species of mammals were reported.These are the long bones that primarily support the body mass in mammals.Each data value is the mean circumference for the available measures for a single species. 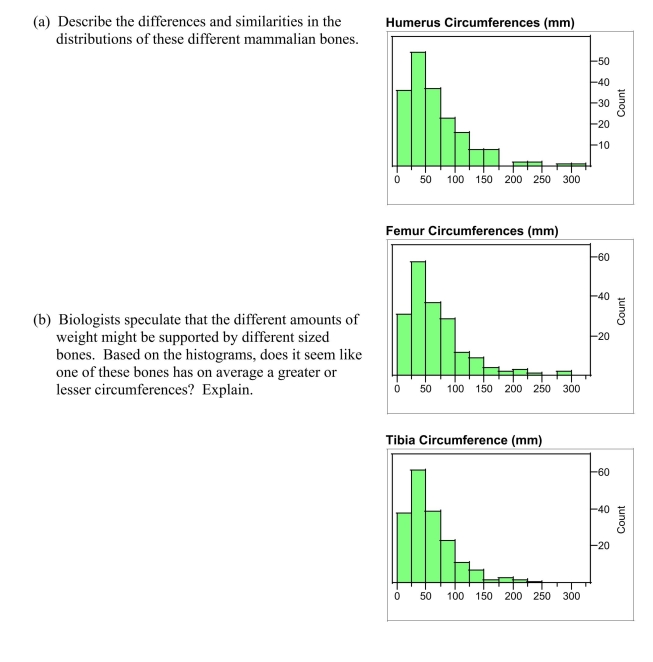
سؤال
سؤال
The stem plot below displays the weights (in ounces)of a random sample of tomatoes grown on a local farm 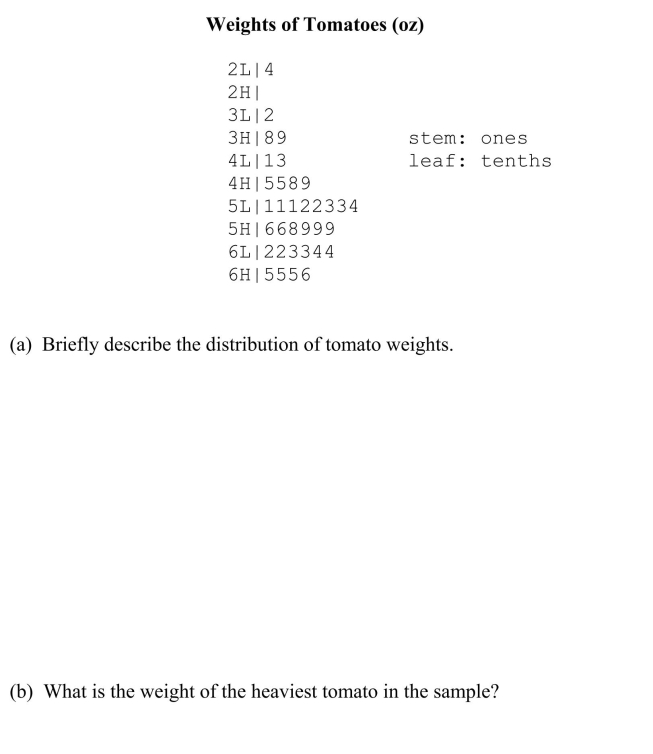
سؤال
سؤال
Investigators studying the relation between gender and the interests of early adolescents asked boys and girls in grades 5-9 to indicate on a 7-point scale their degree of interest in topics such as Life, Sports, and Cars. The data in the scatter plot represent average levels of interest for boys and girls in grades 5 - 9.Each point represents one topic listed by the investigators.For example, boys average rating for "Opposite sex" as a 6.2, while girls on average rated their interest in this topic as 6.0 on the 7 point interest scale.This is recorded as the point (6.2, 6.0). 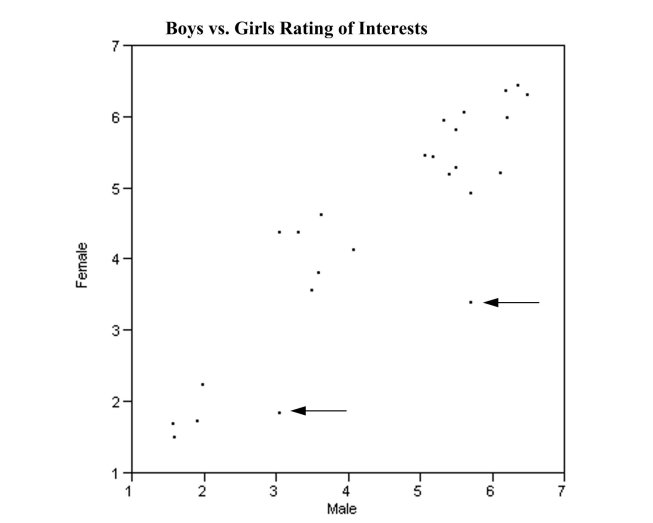 There are three interesting features of this scatter plot that you are to interpret below. What can you infer from each of these features of the scatterplot?
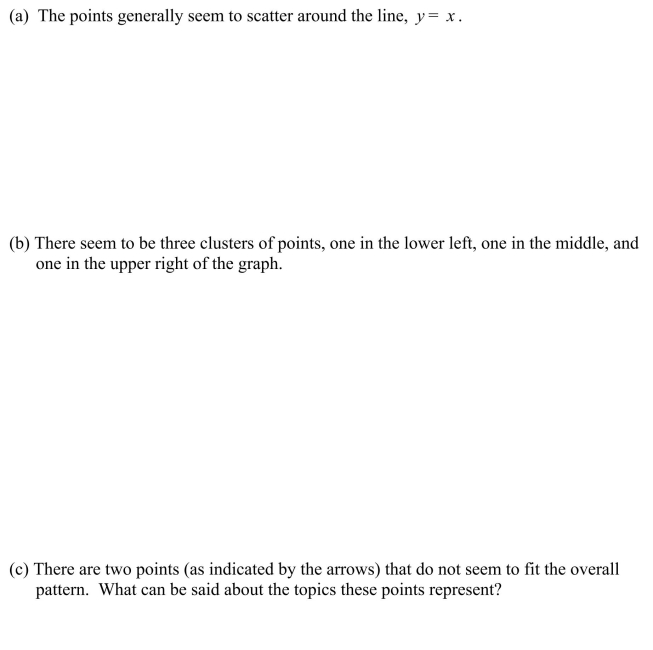
There are three interesting features of this scatter plot that you are to interpret below. What can you infer from each of these features of the scatterplot? سؤال
سؤال
سؤال
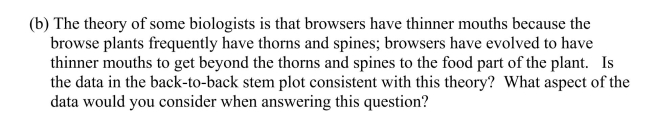
Ruminants are hoofed animals such as cattle and sheep.Two categories of ruminants are browsers (leaf eaters)and grazers (grass eaters).Some biologists believe that the incisor arcade, that part of the mouth between the incisors, is shaped differently for browsers and grazers, and that might explain their food selection.The "curvature" of an incisor arcade is a measure of its shape, with large values indicating a long, thin mouth, and small values a shorter, wider mouth.The back-to-back stem plot below compares the curvatures of incisor arcades of a sample of species of browsers and grazers in the ruminant family. 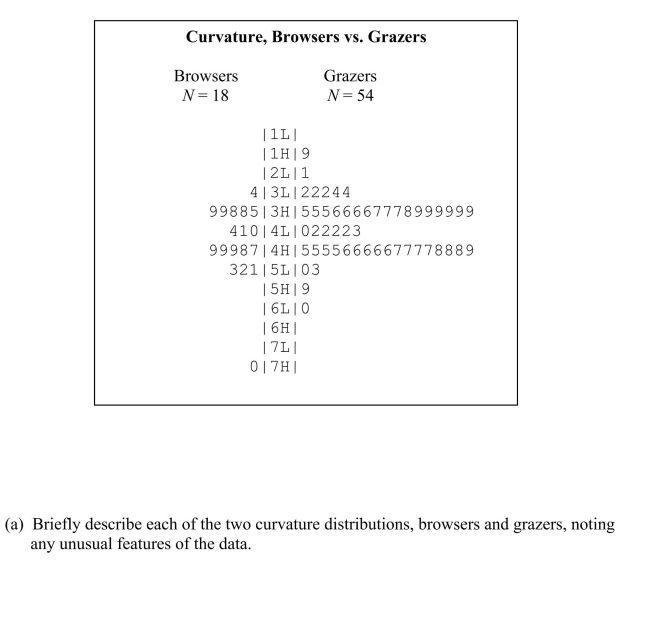
سؤال
سؤال
سؤال
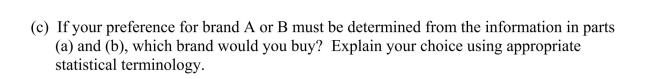
An experiment was performed to determine which brand of comparably priced light bulbs, A or B, lasts longer on average.Ten bulbs of each brand were tested, and their lifetimes recorded in hours.The data are shown below: 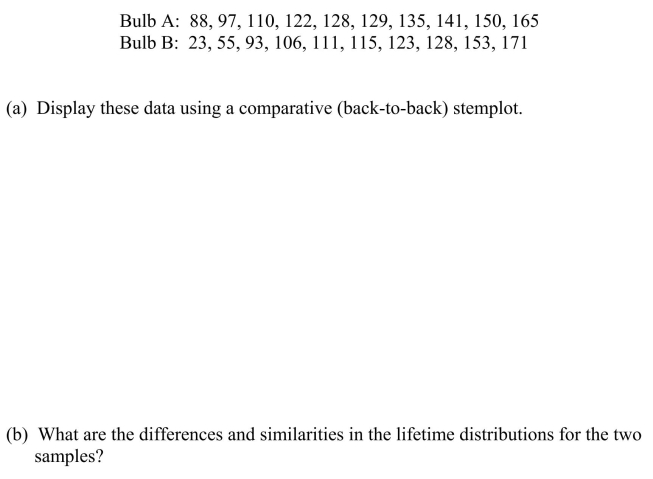
سؤال
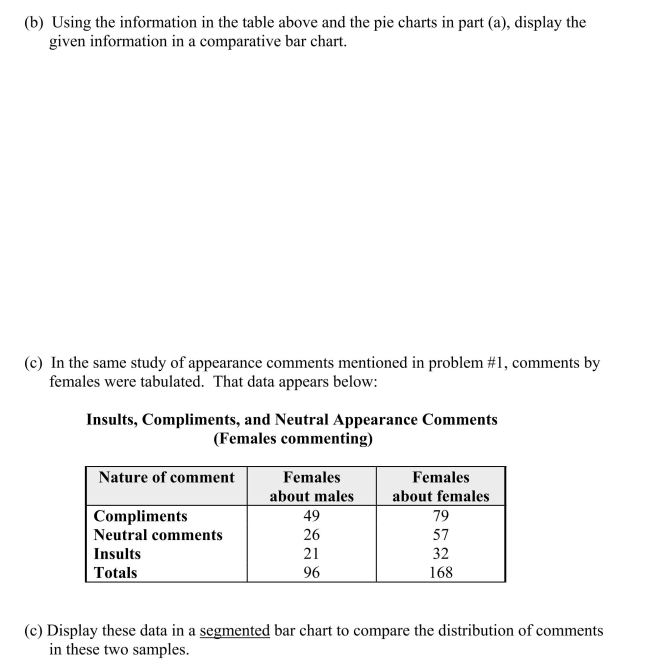
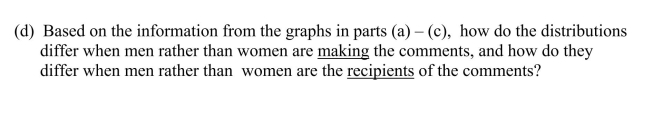
One of the "media messages" sent by television is that appearance is a very important aspect of one's being.These messages are thought to spur young women to have unrealistic expectations about beauty, thus spending billions of dollars on cosmetics and toiletries.Some of these messages were studied during the 1999-2000 prime- time television season, when investigators kept track of the "appearance" comments. Some of their data, comments by males, classified by gender of recipient and type of appearance comment, is reproduced in the table below. 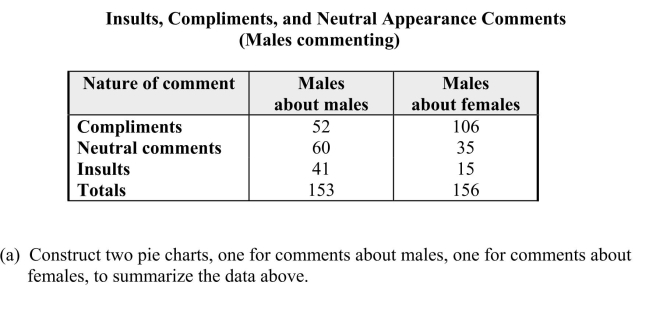
سؤال
As part of the United States Census, data is also collected on the number of persons in each household.The census data for four decades is summarized below. 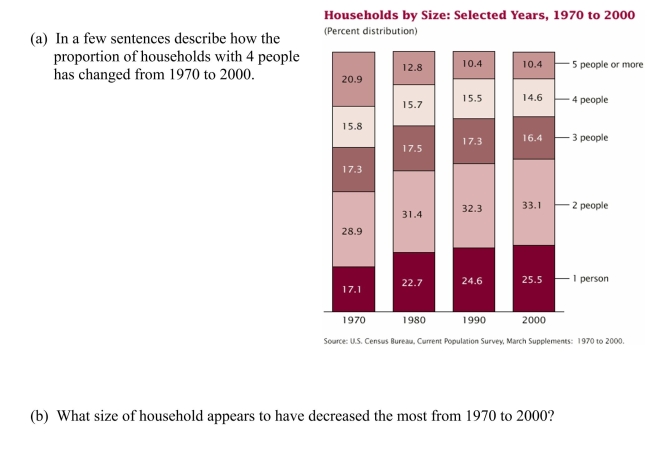
سؤال
سؤال
Iowa is an agricultural state with a large number of rivers.The use of chemical pesticides and increasing size of livestock herds has created a concern for the water quality in the state.A researcher recently surveyed the rivers of Iowa and analyzed the concentrations of certain chemicals at different locations in the watersheds of Iowa.The cumulative relative frequency plot below displays the distribution of Nitrogen concentrations along the Cedar River. 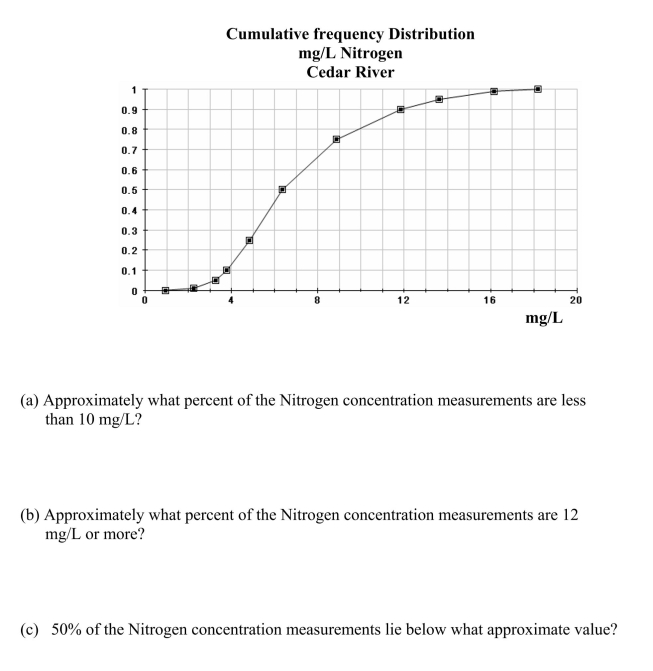
سؤال
A statewide survey released by the University of Iowa Injury Prevention Research Center was designed to assess compliance with Iowa seatbelt law.The table at right shows the results for 5 Iowa cities. compared for the different cities. 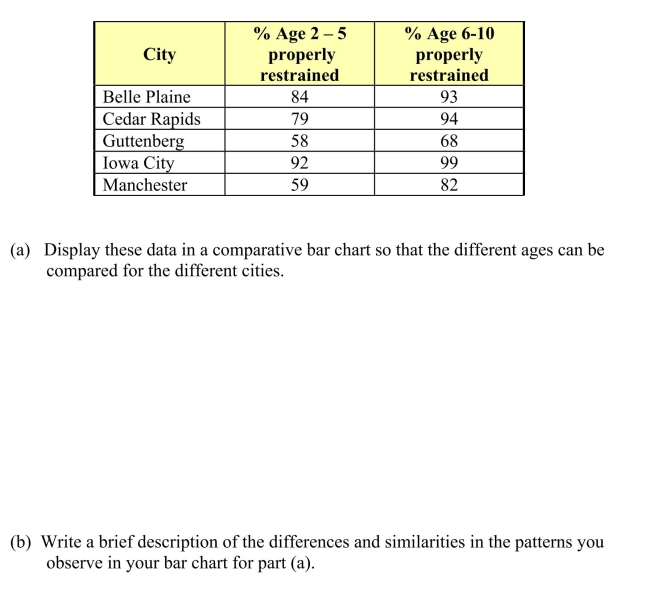 observe in your bar chart for part (a).
observe in your bar chart for part (a).
فتح الحزمة
قم بالتسجيل لفتح البطاقات في هذه المجموعة!
Unlock Deck
Unlock Deck
1/19
العب
ملء الشاشة (f)
Deck 3: Graphical Methods for Describing Data
1
The pie chart below summarizes the results of a survey of 300 randomly selected students at a particular high school.The investigators asked about soft drink preferences at a local high school.
2
If the upper tail of a distribution stretches out farther than the lower tail, the distribution is negatively skewed.
False
3
A pie chart is most useful for numeric data.
False
4
In the article, "Scaling of Mammalian Long Bones: Small and Large Mammals Compared," the average circumferences (distances around)in mm of the humerus, femur, and tibia of different species of mammals were reported.These are the long bones that primarily support the body mass in mammals.Each data value is the mean circumference for the available measures for a single species.
فتح الحزمة
افتح القفل للوصول البطاقات البالغ عددها 19 في هذه المجموعة.
فتح الحزمة
k this deck
5
One advantage of histograms is that they may be used for large data sets.
فتح الحزمة
افتح القفل للوصول البطاقات البالغ عددها 19 في هذه المجموعة.
فتح الحزمة
k this deck
6
The stem plot below displays the weights (in ounces)of a random sample of tomatoes grown on a local farm
فتح الحزمة
افتح القفل للوصول البطاقات البالغ عددها 19 في هذه المجموعة.
فتح الحزمة
k this deck
7
An outlier is an unusually small or large data value.
فتح الحزمة
افتح القفل للوصول البطاقات البالغ عددها 19 في هذه المجموعة.
فتح الحزمة
k this deck
8
Investigators studying the relation between gender and the interests of early adolescents asked boys and girls in grades 5-9 to indicate on a 7-point scale their degree of interest in topics such as Life, Sports, and Cars. The data in the scatter plot represent average levels of interest for boys and girls in grades 5 - 9.Each point represents one topic listed by the investigators.For example, boys average rating for "Opposite sex" as a 6.2, while girls on average rated their interest in this topic as 6.0 on the 7 point interest scale.This is recorded as the point (6.2, 6.0). There are three interesting features of this scatter plot that you are to interpret below. What can you infer from each of these features of the scatterplot?
There are three interesting features of this scatter plot that you are to interpret below. What can you infer from each of these features of the scatterplot? فتح الحزمة
افتح القفل للوصول البطاقات البالغ عددها 19 في هذه المجموعة.
فتح الحزمة
k this deck
9
A curve with tails that decline more rapidly than the tails of a normal curve is called a heavy-tailed distribution.
فتح الحزمة
افتح القفل للوصول البطاقات البالغ عددها 19 في هذه المجموعة.
فتح الحزمة
k this deck
10
In a scatter plot, both the horizontal and vertical axes must be set at zero.
فتح الحزمة
افتح القفل للوصول البطاقات البالغ عددها 19 في هذه المجموعة.
فتح الحزمة
k this deck
11
Ruminants are hoofed animals such as cattle and sheep.Two categories of ruminants are browsers (leaf eaters)and grazers (grass eaters).Some biologists believe that the incisor arcade, that part of the mouth between the incisors, is shaped differently for browsers and grazers, and that might explain their food selection.The "curvature" of an incisor arcade is a measure of its shape, with large values indicating a long, thin mouth, and small values a shorter, wider mouth.The back-to-back stem plot below compares the curvatures of incisor arcades of a sample of species of browsers and grazers in the ruminant family.
فتح الحزمة
افتح القفل للوصول البطاقات البالغ عددها 19 في هذه المجموعة.
فتح الحزمة
k this deck
12
For stem and leaf plots with single-digit leaves, commas must be used to separate the leaves.
فتح الحزمة
افتح القفل للوصول البطاقات البالغ عددها 19 في هذه المجموعة.
فتح الحزمة
k this deck
13
The density of a class can be calculated by multiplying the relative frequency of the class times the class width.
فتح الحزمة
افتح القفل للوصول البطاقات البالغ عددها 19 في هذه المجموعة.
فتح الحزمة
k this deck
14
An experiment was performed to determine which brand of comparably priced light bulbs, A or B, lasts longer on average.Ten bulbs of each brand were tested, and their lifetimes recorded in hours.The data are shown below:
فتح الحزمة
افتح القفل للوصول البطاقات البالغ عددها 19 في هذه المجموعة.
فتح الحزمة
k this deck
15
One of the "media messages" sent by television is that appearance is a very important aspect of one's being.These messages are thought to spur young women to have unrealistic expectations about beauty, thus spending billions of dollars on cosmetics and toiletries.Some of these messages were studied during the 1999-2000 prime- time television season, when investigators kept track of the "appearance" comments. Some of their data, comments by males, classified by gender of recipient and type of appearance comment, is reproduced in the table below.
فتح الحزمة
افتح القفل للوصول البطاقات البالغ عددها 19 في هذه المجموعة.
فتح الحزمة
k this deck
16
As part of the United States Census, data is also collected on the number of persons in each household.The census data for four decades is summarized below.
فتح الحزمة
افتح القفل للوصول البطاقات البالغ عددها 19 في هذه المجموعة.
فتح الحزمة
k this deck
17
فتح الحزمة
افتح القفل للوصول البطاقات البالغ عددها 19 في هذه المجموعة.
فتح الحزمة
k this deck
18
Iowa is an agricultural state with a large number of rivers.The use of chemical pesticides and increasing size of livestock herds has created a concern for the water quality in the state.A researcher recently surveyed the rivers of Iowa and analyzed the concentrations of certain chemicals at different locations in the watersheds of Iowa.The cumulative relative frequency plot below displays the distribution of Nitrogen concentrations along the Cedar River.
فتح الحزمة
افتح القفل للوصول البطاقات البالغ عددها 19 في هذه المجموعة.
فتح الحزمة
k this deck
19
A statewide survey released by the University of Iowa Injury Prevention Research Center was designed to assess compliance with Iowa seatbelt law.The table at right shows the results for 5 Iowa cities. compared for the different cities. observe in your bar chart for part (a).
observe in your bar chart for part (a). فتح الحزمة
افتح القفل للوصول البطاقات البالغ عددها 19 في هذه المجموعة.
فتح الحزمة
k this deck
فتح الحزمة
افتح القفل للوصول البطاقات البالغ عددها 19 في هذه المجموعة.


