Deck 4: Categorical Data: Comparisons and Associations
ملء الشاشة (f)
سؤال
سؤال
سؤال
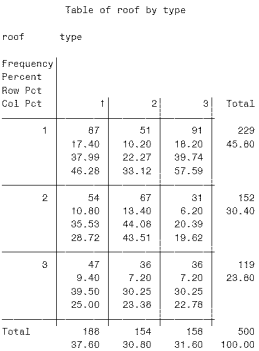
For the first cell in the following contingency table, interpret the frequency, percent, row percent, and column percent.
سؤال
سؤال
سؤال
سؤال
سؤال
سؤال
سؤال
سؤال
سؤال
سؤال
سؤال
سؤال
سؤال
سؤال
سؤال
سؤال
سؤال

فتح الحزمة
قم بالتسجيل لفتح البطاقات في هذه المجموعة!
Unlock Deck
Unlock Deck
1/20
العب
ملء الشاشة (f)
Deck 4: Categorical Data: Comparisons and Associations
1
Briefly describe the similarity and difference between odds and risks. At what value of odds and risks will the probability of success be larger than the probability of failure?
Both odds and risks describe the likelihood of an event occurring. However, odds range from 0 to positive infinity whereas risks range from 0 to 1. The probability of an event occurring (success) exceeds the probability of an event not occurring (failure) if the odds is greater than 1 and if the risk is greater than 0.5. Risks are preserved for prospective study whereas odds can be used regardless how the data are collected.
2
Suppose an odds ratio between gender (male, female) and smoking status (yes, no) is 2.5. Explain why it is incorrect to interpret the odds ratio as "the probability of smoking for males is 2.5 times that for females." Provide a correct interpretation.
The odds of smoking do not directly imply the proportion of people smoking in each gender because odds are not a proportion but a function of proportion. Thus, a correct statement for this odds ratio is "the odds of smoking for males is 2.5 times that for females."
3
For the first cell in the following contingency table, interpret the frequency, percent, row percent, and column percent.
There are 87 subjects with variable R =1 and variable C =1. The total percentage of subjects with R =1 and C =1 is 17.40%. 37.99% represents the percentage of subjects who have variable C =1 among those who have variable R =1. 46.28% represents the percentage of subjects that have variable R =1 among those who have variable C =1.
4
Briefly describe the difference between a case-control study and a cohort study in terms of the way data are collected. What measure of association is appropriate in each study?
فتح الحزمة
افتح القفل للوصول البطاقات البالغ عددها 20 في هذه المجموعة.
فتح الحزمة
k this deck
5
The confidence interval width decreases as which of the following increases?
A) level of confidence
B) estimated variance of the proportion
C) sample size
D) size of the null parameter
A) level of confidence
B) estimated variance of the proportion
C) sample size
D) size of the null parameter
فتح الحزمة
افتح القفل للوصول البطاقات البالغ عددها 20 في هذه المجموعة.
فتح الحزمة
k this deck
6
Which of the following is NOT a good descriptive statistic for categorical variables?
A) proportions
B) percentages
C) counts
D) means
A) proportions
B) percentages
C) counts
D) means
فتح الحزمة
افتح القفل للوصول البطاقات البالغ عددها 20 في هذه المجموعة.
فتح الحزمة
k this deck
7
Which of the following is NOT an advantage of a pie chart?
A) relate parts to whole
B) represent a good alternative when numerical summaries are harder to present
C) investigate the shape of the distribution
D) allow easy interpretation and understanding
A) relate parts to whole
B) represent a good alternative when numerical summaries are harder to present
C) investigate the shape of the distribution
D) allow easy interpretation and understanding
فتح الحزمة
افتح القفل للوصول البطاقات البالغ عددها 20 في هذه المجموعة.
فتح الحزمة
k this deck
8
Assume the estimated odds ratio of obesity for the amount of weekly exercise (in minutes) is 0.93 (95% CI: 0.88, 0.99). Interpret this odds ratio for every minute and for 30-minute increases in exercising time.
فتح الحزمة
افتح القفل للوصول البطاقات البالغ عددها 20 في هذه المجموعة.
فتح الحزمة
k this deck
9
Can a variable be regarded as both ordinal and dichotomous? Why or why not?
فتح الحزمة
افتح القفل للوصول البطاقات البالغ عددها 20 في هذه المجموعة.
فتح الحزمة
k this deck
10
Choose the most appropriate graphical presentation (pie chart or bar graph) for the following examples. Provide a rationale for your choice.
a.To show the composition of racial distribution of a certain disease.
b.To compare the proportion of smoking between males and females.
c.To show an association between weight perception and age groups.
d.To compare the number of cases of flu in each month
a.To show the composition of racial distribution of a certain disease.
b.To compare the proportion of smoking between males and females.
c.To show an association between weight perception and age groups.
d.To compare the number of cases of flu in each month
فتح الحزمة
افتح القفل للوصول البطاقات البالغ عددها 20 في هذه المجموعة.
فتح الحزمة
k this deck
11
What is the denominator(s) used to calculate the percentages of the first cell.
فتح الحزمة
افتح القفل للوصول البطاقات البالغ عددها 20 في هذه المجموعة.
فتح الحزمة
k this deck
12
Which of the following is NOT required to determine the sample size for a test of two proportions?
A) power
B) significance level
C) proportion estimates
D) standard deviation
A) power
B) significance level
C) proportion estimates
D) standard deviation
فتح الحزمة
افتح القفل للوصول البطاقات البالغ عددها 20 في هذه المجموعة.
فتح الحزمة
k this deck
13
In the following scenarios, p = the probability of lung cancer. If the odds ratio estimate is 1.2, interpret for the following variables:
a.age (continuous)
b.education level (graduate school vs. high school)
c.race (Black vs. White)
d.smoking status (smoker vs. nonsmoker)
a.age (continuous)
b.education level (graduate school vs. high school)
c.race (Black vs. White)
d.smoking status (smoker vs. nonsmoker)
فتح الحزمة
افتح القفل للوصول البطاقات البالغ عددها 20 في هذه المجموعة.
فتح الحزمة
k this deck
14
Briefly explain how the expected and observed cell counts are obtained. How do they influence the significance of the hypothesis test?
فتح الحزمة
افتح القفل للوصول البطاقات البالغ عددها 20 في هذه المجموعة.
فتح الحزمة
k this deck
15
Identify the following variables as nominal, ordinal, or dichotomous. Provide a justification for your choice.
a.Types of diabetes: type 1 (insulin-dependent), type 2 (non-insulin-dependent), gestational diabetes mellitus.
b.Time to recurrence: 0-2 years, 2-4 years, more than 4 years.
c.Clinic sites: Lexington, Covington, Frankfort, Nashville, Bowling Green.
d.Smoking status: smoker, nonsmoker.
e.Levels of body mass index (BMI): normal, overweight, obese. Types of vaccine administration: oral, injection, puncture.
f.Types of residency: urban, rural.
فتح الحزمة
افتح القفل للوصول البطاقات البالغ عددها 20 في هذه المجموعة.
فتح الحزمة
k this deck
16
Specify an appropriate test (nonzero correlation test, row mean scores differ test, and general association test) for the following types of categorical variables. Justify the choice.
a.education level versus social class (upper, middle, lower)
b.gender versus anxiety rating (none, moderate, severe)
c.race versus political affiliation
a.education level versus social class (upper, middle, lower)
b.gender versus anxiety rating (none, moderate, severe)
c.race versus political affiliation
فتح الحزمة
افتح القفل للوصول البطاقات البالغ عددها 20 في هذه المجموعة.
فتح الحزمة
k this deck
17
The chi-square test of independence is used to assess which of the following hypotheses?
A) Whether the samples are independently distributed.
B) Whether the samples are associated with each other.
C) Whether the variables are independently distributed.
D) Whether the variables are associated with each other.
A) Whether the samples are independently distributed.
B) Whether the samples are associated with each other.
C) Whether the variables are independently distributed.
D) Whether the variables are associated with each other.
فتح الحزمة
افتح القفل للوصول البطاقات البالغ عددها 20 في هذه المجموعة.
فتح الحزمة
k this deck
18
Describe how confidence intervals are used to determine whether an odds ratio is different than 1?
فتح الحزمة
افتح القفل للوصول البطاقات البالغ عددها 20 في هذه المجموعة.
فتح الحزمة
k this deck
19
When is it appropriate to interpret odds ratio as relative risk?
فتح الحزمة
افتح القفل للوصول البطاقات البالغ عددها 20 في هذه المجموعة.
فتح الحزمة
k this deck
20
Why is it inappropriate to estimate risks directly in a case-control (retrospective) study?
فتح الحزمة
افتح القفل للوصول البطاقات البالغ عددها 20 في هذه المجموعة.
فتح الحزمة
k this deck
فتح الحزمة
افتح القفل للوصول البطاقات البالغ عددها 20 في هذه المجموعة.


