Deck 12: Simple Regression Analysis and Correlation
ملء الشاشة (f)
سؤال
سؤال
سؤال
سؤال
سؤال
سؤال
سؤال
سؤال
سؤال
سؤال
سؤال
سؤال
سؤال
سؤال
سؤال
سؤال
سؤال
سؤال
سؤال
سؤال
سؤال
سؤال
سؤال
From the following scatter plot, we can say that between y and x there is ___. 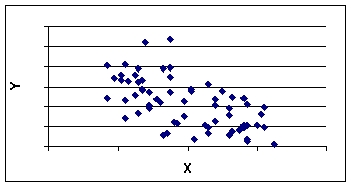
A)perfect positive correlation
B)virtually no correlation
C)positive correlation
D)negative correlation
E)perfect negative correlation
A)perfect positive correlation
B)virtually no correlation
C)positive correlation
D)negative correlation
E)perfect negative correlation
سؤال
The following data is to be used to construct a regression model:  The regression equation is ___.
A)y = 2.16 + 1.37x
B)y = 1.37 + 2.16x
C)y = 0.69 + 0.57x
D)y = 0.57 + 0.69x
E)y = 0.57 - 0.69x
The regression equation is ___.A)y = 2.16 + 1.37x
B)y = 1.37 + 2.16x
C)y = 0.69 + 0.57x
D)y = 0.57 + 0.69x
E)y = 0.57 - 0.69x
سؤال
The following data is to be used to construct a regression model:  The value of the slope is ___.
A)2.36
B)2.16
C)0.68
D)0.57
E)1.37
The value of the slope is ___.A)2.36
B)2.16
C)0.68
D)0.57
E)1.37
سؤال
For following scatter plot and regression line, at x = 65 the residual is ___. 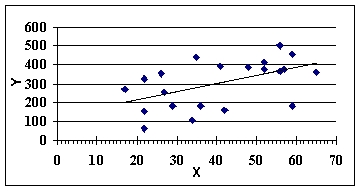
A)positive
B)zero
C)negative
D)imaginary
E)unknown
A)positive
B)zero
C)negative
D)imaginary
E)unknown
سؤال
سؤال
سؤال
From the following scatter plot, we can say that between y and x there is ___. 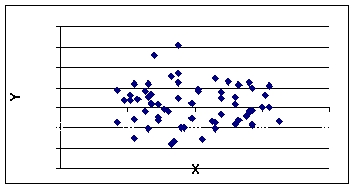
A)perfect positive correlation
B)virtually no correlation
C)positive correlation
D)negative correlation
E)perfect negative correlation
A)perfect positive correlation
B)virtually no correlation
C)positive correlation
D)negative correlation
E)perfect negative correlation
سؤال
The following residuals plot indicates ___. 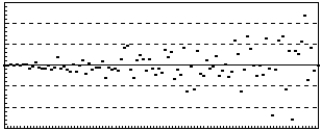
A)a nonlinear relation
B)a nonconstant error variance
C)the simple regression assumptions are met
D)the sample is biased
E)the sample is random
A)a nonlinear relation
B)a nonconstant error variance
C)the simple regression assumptions are met
D)the sample is biased
E)the sample is random
سؤال
Consider the following scatter plot and regression line.At x = 17, the residual (error term)is ___. 
A)positive
B)zero
C)negative
D)imaginary
E)unknown
A)positive
B)zero
C)negative
D)imaginary
E)unknown
سؤال
From the following scatter plot, we can say that between y and x there is ___. 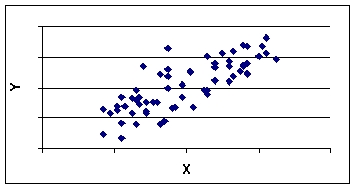
A)perfect positive correlation
B)virtually no correlation
C)positive correlation
D)negative correlation
E)perfect negative correlation
A)perfect positive correlation
B)virtually no correlation
C)positive correlation
D)negative correlation
E)perfect negative correlation
سؤال
سؤال
سؤال
سؤال
سؤال
سؤال
The following data is to be used to construct a regression model:  The value of the y intercept is ___.
A)1.36
B)2.16
C)0.68
D)0.57
E)2.36
The value of the y intercept is ___.A)1.36
B)2.16
C)0.68
D)0.57
E)2.36
سؤال
سؤال
سؤال
سؤال
The following residuals plot indicates ___. 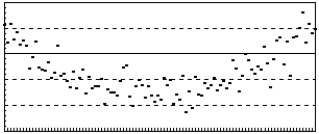
A)a nonlinear relation
B)a nonconstant error variance
C)the simple regression assumptions are met
D)the sample is biased
E)a random sample
A)a nonlinear relation
B)a nonconstant error variance
C)the simple regression assumptions are met
D)the sample is biased
E)a random sample
سؤال
سؤال
سؤال
سؤال
سؤال
سؤال
سؤال
سؤال
سؤال
سؤال
سؤال
سؤال
سؤال
سؤال
سؤال
سؤال
سؤال
سؤال
سؤال
Abby Kuntz, a market specialist at the market research firm of Saez, Gann, and Spitz, is analyzing household budget data collected by her firm.Abby's dependent variable is monthly household expenditures on groceries (in $'s), and her independent variable is annual household income (in $1,000's).Regression analysis of the data yielded the following tables:  s), and her independent variable is annual household income (in $1,000's).Regression analysis of the data yielded the following tables: The correlation coefficient between the two variables in this regression is ___. A)0.682478 B)-0.83 C)0.83 D)-0.68 E)1.0008
s), and her independent variable is annual household income (in $1,000's).Regression analysis of the data yielded the following tables: The correlation coefficient between the two variables in this regression is ___. A)0.682478 B)-0.83 C)0.83 D)-0.68 E)1.0008 " class="answers-bank-image d-block" loading="lazy" > 11eb6c3a_ec61_fde9_ad81_59fe2eaa383b_TB8417_00 The correlation coefficient between the two variables in this regression is ___.
A)0.682478
B)-0.83
C)0.83
D)-0.68
E)1.0008s), and her independent variable is annual household income (in $1,000's).Regression analysis of the data yielded the following tables: The correlation coefficient between the two variables in this regression is ___. A)0.682478 B)-0.83 C)0.83 D)-0.68 E)1.0008
A)0.682478
B)-0.83
C)0.83
D)-0.68
E)1.0008
" class="answers-bank-image d-block" loading="lazy" > The correlation coefficient between the two variables in this regression is ___.
A)0.682478
B)-0.83
C)0.83
D)-0.68
E)1.0008s), and her independent variable is annual household income (in $1,000's).Regression analysis of the data yielded the following tables: The correlation coefficient between the two variables in this regression is ___. A)0.682478 B)-0.83 C)0.83 D)-0.68 E)1.0008
A)0.682478
B)-0.83
C)0.83
D)-0.68
E)1.0008
" class="answers-bank-image d-block" loading="lazy" > 11eb6c3a_ec61_fde9_ad81_59fe2eaa383b_TB8417_00 The correlation coefficient between the two variables in this regression is ___.
A)0.682478
B)-0.83
C)0.83
D)-0.68
E)1.0008
A)0.682478
B)-0.83
C)0.83
D)-0.68
E)1.0008
سؤال
Abby Kuntz, a market specialist at the market research firm of Saez, Gann, and Spitz, is analyzing household budget data collected by her firm.Abby's dependent variable is monthly household expenditures on groceries (in $'s), and her independent variable is annual household income (in $1,000's).Regression analysis of the data yielded the following tables.  s), and her independent variable is annual household income (in $1,000's).Regression analysis of the data yielded the following tables. For a household with $50,000 annual income, Abby's model predicts monthly grocery expenditures of ___. A)$150.35 B)$50.35 C)$1,959.29 D)$128.65 E)$1286.50
s), and her independent variable is annual household income (in $1,000's).Regression analysis of the data yielded the following tables. For a household with $50,000 annual income, Abby's model predicts monthly grocery expenditures of ___. A)$150.35 B)$50.35 C)$1,959.29 D)$128.65 E)$1286.50 " class="answers-bank-image d-block" loading="lazy" > 11eb6c3a_ec62_731f_ad81_5b97fdcd3d3e_TB8417_00 For a household with $50,000 annual income, Abby's model predicts monthly grocery expenditures of ___.
A)$150.35
B)$50.35
C)$1,959.29
D)$128.65
E)$1286.50s), and her independent variable is annual household income (in $1,000's).Regression analysis of the data yielded the following tables. For a household with $50,000 annual income, Abby's model predicts monthly grocery expenditures of ___. A)$150.35 B)$50.35 C)$1,959.29 D)$128.65 E)$1286.50
A)$150.35
B)$50.35
C)$1,959.29
D)$128.65
E)$1286.50
" class="answers-bank-image d-block" loading="lazy" > For a household with $50,000 annual income, Abby's model predicts monthly grocery expenditures of ___.
A)$150.35
B)$50.35
C)$1,959.29
D)$128.65
E)$1286.50s), and her independent variable is annual household income (in $1,000's).Regression analysis of the data yielded the following tables. For a household with $50,000 annual income, Abby's model predicts monthly grocery expenditures of ___. A)$150.35 B)$50.35 C)$1,959.29 D)$128.65 E)$1286.50
A)$150.35
B)$50.35
C)$1,959.29
D)$128.65
E)$1286.50
" class="answers-bank-image d-block" loading="lazy" > 11eb6c3a_ec62_731f_ad81_5b97fdcd3d3e_TB8417_00 For a household with $50,000 annual income, Abby's model predicts monthly grocery expenditures of ___.
A)$150.35
B)$50.35
C)$1,959.29
D)$128.65
E)$1286.50
A)$150.35
B)$50.35
C)$1,959.29
D)$128.65
E)$1286.50
سؤال
Alan Nip, market analyst for Clear Sound Mart, is analyzing the relation between heavy metal CD sales and the size of the teenage population.He gathers data from six sales districts.Alan's dependent variable is annual heavy metal CD sales (in $1,000,000's), and his independent variable is teenage population (in 1,000's).Regression analysis of the data yielded the following tables: 
 Alan's sample size is ___.
A)2
B)4
C)6
D)8
E)10
Alan's sample size is ___.A)2
B)4
C)6
D)8
E)10
سؤال
Louis Tang, a cost accountant at Prime Plastics, Inc.(PPI), is analyzing the manufacturing costs of a moulded plastic telephone handset produced by PPI.Louis's independent variable is production lot size (in 1,000's of units), and his dependent variable is the total cost of the lot (in $100's).Regression analysis of the data yielded the following tables: 
 Using = 0.05, Louis should ___.
A)increase the sample size
B)suspend judgment
C)not reject H0: 1 = 0
D)reject H0: 1 = 0
E)do not reject H0: 0 = 0
Using = 0.05, Louis should ___.A)increase the sample size
B)suspend judgment
C)not reject H0: 1 = 0
D)reject H0: 1 = 0
E)do not reject H0: 0 = 0
سؤال
Louis Tang, a cost accountant at Prime Plastics, Inc.(PPI), is analyzing the manufacturing costs of a moulded plastic telephone handset produced by PPI.Louis's independent variable is production lot size (in 1,000's of units), and his dependent variable is the total cost of the lot (in $100's).Regression analysis of the data yielded the following tables: 
 The correlation coefficient between Louis's variables is ___.
A)-0.73
B)0.73
C)0.28
D)-0.28
E)0.00
The correlation coefficient between Louis's variables is ___.A)-0.73
B)0.73
C)0.28
D)-0.28
E)0.00
سؤال
Louis Tang, a cost accountant at Prime Plastics, Inc.(PPI), is analyzing the manufacturing costs of a moulded plastic telephone handset produced by PPI.Louis's independent variable is production lot size (in 1,000's of units), and his dependent variable is the total cost of the lot (in $100's).Regression analysis of the data yielded the following tables: 
 Louis's regression model is ___.
A)y = -0.358 + 3.996x
B)y = 0.358 + 3.996x
C)y = -3.996 + 0.358x
D)y = 3.996 - 0.358x
E)y = 3.996 + 0.358x
Louis's regression model is ___.A)y = -0.358 + 3.996x
B)y = 0.358 + 3.996x
C)y = -3.996 + 0.358x
D)y = 3.996 - 0.358x
E)y = 3.996 + 0.358x
سؤال
Alan Nip, market analyst for Clear Sound Mart, is analyzing the relation between heavy metal CD sales and the size of the teenage population.He gathers data from six sales districts.Alan's dependent variable is annual heavy metal CD sales (in $1,000,000's), and his independent variable is teenage population (in 1,000's).Regression analysis of the data yielded the following tables. 
 The numerical value of the correlation coefficient between the CD sales and the size of teenage population is ___.
A)0.969785
B)0.940483
C)0.224675
D)-0.14156
E)1.000000
The numerical value of the correlation coefficient between the CD sales and the size of teenage population is ___.A)0.969785
B)0.940483
C)0.224675
D)-0.14156
E)1.000000
سؤال
Abby Kuntz, a market specialist at the market research firm of Saez, Gann, and Spitz, is analyzing household budget data collected by her firm.Abby's dependent variable is monthly household expenditures on groceries (in $'s), and her independent variable is annual household income (in $1,000's).Regression analysis of the data yielded the following tables.  = 0.05, Abby should ___.
A)reject H0: 1 = 0
B)not reject H0: 1 = 0
C)increase the sample size
D)suspend judgment
E)reject H0: 0 = 0s), and her independent variable is annual household income (in $1,000's).Regression analysis of the data yielded the following tables. Using \alpha = 0.05, Abby should ___. A)reject H0: \beta 1 = 0 B)not reject H0: \beta 1 = 0 C)increase the sample size D)suspend judgment E)reject H0: \beta 0 = 0
= 0.05, Abby should ___.A)reject H0: 1 = 0
B)not reject H0: 1 = 0
C)increase the sample size
D)suspend judgment
E)reject H0: 0 = 0
" class="answers-bank-image d-block" loading="lazy" > 11eb6c3a_ec62_4c0d_ad81_ff858582a93a_TB8417_00 Using = 0.05, Abby should ___.
A)reject H0: 1 = 0
B)not reject H0: 1 = 0
C)increase the sample size
D)suspend judgment
E)reject H0: 0 = 0s), and her independent variable is annual household income (in $1,000's).Regression analysis of the data yielded the following tables. Using \alpha = 0.05, Abby should ___. A)reject H0: \beta 1 = 0 B)not reject H0: \beta 1 = 0 C)increase the sample size D)suspend judgment E)reject H0: \beta 0 = 0
A)reject H0: 1 = 0
B)not reject H0: 1 = 0
C)increase the sample size
D)suspend judgment
E)reject H0: 0 = 0
" class="answers-bank-image d-block" loading="lazy" > Using = 0.05, Abby should ___.
A)reject H0: 1 = 0
B)not reject H0: 1 = 0
C)increase the sample size
D)suspend judgment
E)reject H0: 0 = 0s), and her independent variable is annual household income (in $1,000's).Regression analysis of the data yielded the following tables. Using \alpha = 0.05, Abby should ___. A)reject H0: \beta 1 = 0 B)not reject H0: \beta 1 = 0 C)increase the sample size D)suspend judgment E)reject H0: \beta 0 = 0
A)reject H0: 1 = 0
B)not reject H0: 1 = 0
C)increase the sample size
D)suspend judgment
E)reject H0: 0 = 0
" class="answers-bank-image d-block" loading="lazy" > 11eb6c3a_ec62_4c0d_ad81_ff858582a93a_TB8417_00 Using = 0.05, Abby should ___.
A)reject H0: 1 = 0
B)not reject H0: 1 = 0
C)increase the sample size
D)suspend judgment
E)reject H0: 0 = 0
A)reject H0: 1 = 0
B)not reject H0: 1 = 0
C)increase the sample size
D)suspend judgment
E)reject H0: 0 = 0
سؤال
Louis Tang, a cost accountant at Prime Plastics, Inc.(PPI), is analyzing the manufacturing costs of a moulded plastic telephone handset produced by PPI.Louis's independent variable is production lot size (in 1,000's of units), and his dependent variable is the total cost of the lot (in $100's).Regression analysis of the data yielded the following tables: 
 For a lot size of 10,000 handsets, Louis' model predicts total cost will be ___.
A)$4,031.80
B)$757.60
C)$3,960.20
D)$354.01
E)$1873.077
For a lot size of 10,000 handsets, Louis' model predicts total cost will be ___.A)$4,031.80
B)$757.60
C)$3,960.20
D)$354.01
E)$1873.077
سؤال
Alan Nip, market analyst for Clear Sound Mart, is analyzing the relation between heavy metal CD sales and the size of the teenage population.He gathers data from six sales districts.Alan's dependent variable is annual heavy metal CD sales (in $1,000,000's), and his independent variable is teenage population (in 1,000's).Regression analysis of the data yielded the following tables: 
 For a sales district with 20,000 teenagers, Alan's model predicts annual CD sales of ___.
A)$1,947.08
B)$2,104.04
C)$2,103,900
D)$1,962,340
E)$2,908,089
For a sales district with 20,000 teenagers, Alan's model predicts annual CD sales of ___.A)$1,947.08
B)$2,104.04
C)$2,103,900
D)$1,962,340
E)$2,908,089
سؤال
Alan Nip, market analyst for Clear Sound Mart, is analyzing the relation between heavy metal CD sales and the size of the teenage population.He gathers data from six sales districts.Alan's dependent variable is annual heavy metal CD sales (in $1,000,000's), and his independent variable is teenage population (in 1,000's).Regression analysis of the data yielded the following tables: 
 Using = 0.05, Alan should ___.
A)increase the sample size
B)not reject H0: 1 = 0
C)reject H0: 1 = 0
D)suspend judgment
E)reject H0: 0 = 0
Using = 0.05, Alan should ___.A)increase the sample size
B)not reject H0: 1 = 0
C)reject H0: 1 = 0
D)suspend judgment
E)reject H0: 0 = 0
سؤال
Abby Kuntz, a market specialist at the market research firm of Saez, Gann, and Spitz, is analyzing household budget data collected by her firm.Abby's dependent variable is monthly household expenditures on groceries (in $'s), and her independent variable is annual household income (in $1,000's).Regression analysis of the data yielded the following tables:  s), and her independent variable is annual household income (in $1,000's).Regression analysis of the data yielded the following tables: Abby's sample size (n)is ___. A)8 B)10 C)11 D)20 E)12
s), and her independent variable is annual household income (in $1,000's).Regression analysis of the data yielded the following tables: Abby's sample size (n)is ___. A)8 B)10 C)11 D)20 E)12 " class="answers-bank-image d-block" loading="lazy" > 11eb6c3a_ec62_24fb_ad81_a7111ecfb44e_TB8417_00 Abby's sample size (n)is ___.
A)8
B)10
C)11
D)20
E)12s), and her independent variable is annual household income (in $1,000's).Regression analysis of the data yielded the following tables: Abby's sample size (n)is ___. A)8 B)10 C)11 D)20 E)12
A)8
B)10
C)11
D)20
E)12
" class="answers-bank-image d-block" loading="lazy" > Abby's sample size (n)is ___.
A)8
B)10
C)11
D)20
E)12s), and her independent variable is annual household income (in $1,000's).Regression analysis of the data yielded the following tables: Abby's sample size (n)is ___. A)8 B)10 C)11 D)20 E)12
A)8
B)10
C)11
D)20
E)12
" class="answers-bank-image d-block" loading="lazy" > 11eb6c3a_ec62_24fb_ad81_a7111ecfb44e_TB8417_00 Abby's sample size (n)is ___.
A)8
B)10
C)11
D)20
E)12
A)8
B)10
C)11
D)20
E)12
سؤال
Alan Nip, market analyst for Clear Sound Mart, is analyzing the relation between heavy metal CD sales and the size of the teenage population.He gathers data from six sales districts.Alan's dependent variable is annual heavy metal CD sales (in $1,000,000's), and his independent variable is teenage population (in 1,000's).Regression analysis of the data yielded the following tables: 
 Alan's regression model can be written as: ___.
A)y = 7.950352 - 0.48455x
B)y = -0.48455 + 7.950352x
C)y = -0.14156 + 0.105195x
D)y = 0.105195 - 0.14156x
E)y = 0.105195 + 0.14156x
Alan's regression model can be written as: ___.A)y = 7.950352 - 0.48455x
B)y = -0.48455 + 7.950352x
C)y = -0.14156 + 0.105195x
D)y = 0.105195 - 0.14156x
E)y = 0.105195 + 0.14156x
سؤال
Abby Kuntz, a market specialist at the market research firm of Saez, Gann, and Spitz, is analyzing household budget data collected by her firm.Abby's dependent variable is monthly household expenditures on groceries (in $'s), and her independent variable is annual household income (in $1,000's).Regression analysis of the data yielded the following tables:  s), and her independent variable is annual household income (in $1,000's).Regression analysis of the data yielded the following tables: Abby's regression model is ___. A)y = 39.15 + 2.79x B)y = 39.15 - 1.79x C)y = 1.79 + 39.15x D)y = -1.79 + 39.15x E)y = 39.15 + 1.79x
s), and her independent variable is annual household income (in $1,000's).Regression analysis of the data yielded the following tables: Abby's regression model is ___. A)y = 39.15 + 2.79x B)y = 39.15 - 1.79x C)y = 1.79 + 39.15x D)y = -1.79 + 39.15x E)y = 39.15 + 1.79x " class="answers-bank-image d-block" loading="lazy" > 11eb6c3a_ec61_d6d7_ad81_a936bb16aa64_TB8417_00 Abby's regression model is ___.
A)y = 39.15 + 2.79x
B)y = 39.15 - 1.79x
C)y = 1.79 + 39.15x
D)y = -1.79 + 39.15x
E)y = 39.15 + 1.79xs), and her independent variable is annual household income (in $1,000's).Regression analysis of the data yielded the following tables: Abby's regression model is ___. A)y = 39.15 + 2.79x B)y = 39.15 - 1.79x C)y = 1.79 + 39.15x D)y = -1.79 + 39.15x E)y = 39.15 + 1.79x
A)y = 39.15 + 2.79x
B)y = 39.15 - 1.79x
C)y = 1.79 + 39.15x
D)y = -1.79 + 39.15x
E)y = 39.15 + 1.79x
" class="answers-bank-image d-block" loading="lazy" > Abby's regression model is ___.
A)y = 39.15 + 2.79x
B)y = 39.15 - 1.79x
C)y = 1.79 + 39.15x
D)y = -1.79 + 39.15x
E)y = 39.15 + 1.79xs), and her independent variable is annual household income (in $1,000's).Regression analysis of the data yielded the following tables: Abby's regression model is ___. A)y = 39.15 + 2.79x B)y = 39.15 - 1.79x C)y = 1.79 + 39.15x D)y = -1.79 + 39.15x E)y = 39.15 + 1.79x
A)y = 39.15 + 2.79x
B)y = 39.15 - 1.79x
C)y = 1.79 + 39.15x
D)y = -1.79 + 39.15x
E)y = 39.15 + 1.79x
" class="answers-bank-image d-block" loading="lazy" > 11eb6c3a_ec61_d6d7_ad81_a936bb16aa64_TB8417_00 Abby's regression model is ___.
A)y = 39.15 + 2.79x
B)y = 39.15 - 1.79x
C)y = 1.79 + 39.15x
D)y = -1.79 + 39.15x
E)y = 39.15 + 1.79x
A)y = 39.15 + 2.79x
B)y = 39.15 - 1.79x
C)y = 1.79 + 39.15x
D)y = -1.79 + 39.15x
E)y = 39.15 + 1.79x
سؤال
Louis Tang, a cost accountant at Prime Plastics, Inc.(PPI), is analyzing the manufacturing costs of a moulded plastic telephone handset produced by PPI.Louis's independent variable is production lot size (in 1,000's of units), and his dependent variable is the total cost of the lot (in $100's).Regression analysis of the data yielded the following tables: 
 Louis's sample size (n)is ___.
A)13
B)14
C)12
D)24
E)1
Louis's sample size (n)is ___.A)13
B)14
C)12
D)24
E)1

فتح الحزمة
قم بالتسجيل لفتح البطاقات في هذه المجموعة!
Unlock Deck
Unlock Deck
1/75
العب
ملء الشاشة (f)
Deck 12: Simple Regression Analysis and Correlation
1
The slope of the regression line, y = 21 − 8x, is 8.
False
2
The proportion of variability of the dependent variable (y)accounted for or explained by the independent variable (x)is called the coefficient of correlation.
False
3
The slope of the regression line, y = 21 − 8x, is 21.
False
4
The range of admissible values for the coefficient determination is −1 to +1.
فتح الحزمة
افتح القفل للوصول البطاقات البالغ عددها 75 في هذه المجموعة.
فتح الحزمة
k this deck
5
One of the assumptions of simple regression analysis is that the error terms are exponentially distributed.
فتح الحزمة
افتح القفل للوصول البطاقات البالغ عددها 75 في هذه المجموعة.
فتح الحزمة
k this deck
6
The coefficient of determination is the proportion of variability of the dependent variable (y)accounted for or explained by the independent variable (x).
فتح الحزمة
افتح القفل للوصول البطاقات البالغ عددها 75 في هذه المجموعة.
فتح الحزمة
k this deck
7
In a simple regression the coefficient of correlation is the square root of the coefficient of determination.
فتح الحزمة
افتح القفل للوصول البطاقات البالغ عددها 75 في هذه المجموعة.
فتح الحزمة
k this deck
8
In regression, the predictor variable is called the dependent variable.
فتح الحزمة
افتح القفل للوصول البطاقات البالغ عددها 75 في هذه المجموعة.
فتح الحزمة
k this deck
9
For the regression line, y = 21 − 8x, 21 is the y intercept of the line.
فتح الحزمة
افتح القفل للوصول البطاقات البالغ عددها 75 في هذه المجموعة.
فتح الحزمة
k this deck
10
One of the major uses of residual analysis is to test some of the assumptions underlying regression.
فتح الحزمة
افتح القفل للوصول البطاقات البالغ عددها 75 في هذه المجموعة.
فتح الحزمة
k this deck
11
The first step in simple regression analysis usually is to construct a scatter plot.
فتح الحزمة
افتح القفل للوصول البطاقات البالغ عددها 75 في هذه المجموعة.
فتح الحزمة
k this deck
12
The difference between the actual y value and the predicted y value found using a regression equation is called the residual.
فتح الحزمة
افتح القفل للوصول البطاقات البالغ عددها 75 في هذه المجموعة.
فتح الحزمة
k this deck
13
To determine whether the overall regression model is significant, the F test is used.
فتح الحزمة
افتح القفل للوصول البطاقات البالغ عددها 75 في هذه المجموعة.
فتح الحزمة
k this deck
14
In simple regression analysis the error terms are assumed to be independent and normally distributed with zero mean and constant variance.
فتح الحزمة
افتح القفل للوصول البطاقات البالغ عددها 75 في هذه المجموعة.
فتح الحزمة
k this deck
15
Data points that lie apart from the rest of the points are called deviants.
فتح الحزمة
افتح القفل للوصول البطاقات البالغ عددها 75 في هذه المجموعة.
فتح الحزمة
k this deck
16
The process of constructing a mathematical model or function that can be used to predict or determine one variable by another variable is called regression analysis.
فتح الحزمة
افتح القفل للوصول البطاقات البالغ عددها 75 في هذه المجموعة.
فتح الحزمة
k this deck
17
In the simple regression model, y = 21 − 8x, if the coefficient of determination is 0.81, we can say that the coefficient of correlation between y and x is 0.90.
فتح الحزمة
افتح القفل للوصول البطاقات البالغ عددها 75 في هذه المجموعة.
فتح الحزمة
k this deck
18
In regression, the variable that is being predicted is usually referred to as the independent variable.
فتح الحزمة
افتح القفل للوصول البطاقات البالغ عددها 75 في هذه المجموعة.
فتح الحزمة
k this deck
19
A t test is used to determine whether the coefficients of the regression model are significantly different from zero.
فتح الحزمة
افتح القفل للوصول البطاقات البالغ عددها 75 في هذه المجموعة.
فتح الحزمة
k this deck
20
The F value to test the overall significance of a regression model is computed by dividing the sum of squares regression (SSreg)by the sum of squares error (SSerr).
فتح الحزمة
افتح القفل للوصول البطاقات البالغ عددها 75 في هذه المجموعة.
فتح الحزمة
k this deck
21
A cost accountant is developing a regression model to predict the total cost of producing a batch of car seats as a function of batch size (the number of seats produced in one lot or batch).The dependent variable is ___.
A)batch size
B)unit variable cost
C)fixed cost
D)total cost
E)total variable cost
A)batch size
B)unit variable cost
C)fixed cost
D)total cost
E)total variable cost
فتح الحزمة
افتح القفل للوصول البطاقات البالغ عددها 75 في هذه المجموعة.
فتح الحزمة
k this deck
22
A cost accountant is developing a regression model to predict the total cost of producing a batch of car seats as a linear function of batch size (the number of seats produced in one lot or batch).The slope of the accountant's model is ___.
A)batch size
B)unit variable cost
C)fixed cost
D)total cost
E)total variable cost
A)batch size
B)unit variable cost
C)fixed cost
D)total cost
E)total variable cost
فتح الحزمة
افتح القفل للوصول البطاقات البالغ عددها 75 في هذه المجموعة.
فتح الحزمة
k this deck
23
From the following scatter plot, we can say that between y and x there is ___.
A)perfect positive correlation
B)virtually no correlation
C)positive correlation
D)negative correlation
E)perfect negative correlation
A)perfect positive correlation
B)virtually no correlation
C)positive correlation
D)negative correlation
E)perfect negative correlation
فتح الحزمة
افتح القفل للوصول البطاقات البالغ عددها 75 في هذه المجموعة.
فتح الحزمة
k this deck
24
The following data is to be used to construct a regression model: The regression equation is ___.
A)y = 2.16 + 1.37x
B)y = 1.37 + 2.16x
C)y = 0.69 + 0.57x
D)y = 0.57 + 0.69x
E)y = 0.57 - 0.69x
The regression equation is ___.A)y = 2.16 + 1.37x
B)y = 1.37 + 2.16x
C)y = 0.69 + 0.57x
D)y = 0.57 + 0.69x
E)y = 0.57 - 0.69x
فتح الحزمة
افتح القفل للوصول البطاقات البالغ عددها 75 في هذه المجموعة.
فتح الحزمة
k this deck
25
The following data is to be used to construct a regression model: The value of the slope is ___.
A)2.36
B)2.16
C)0.68
D)0.57
E)1.37
The value of the slope is ___.A)2.36
B)2.16
C)0.68
D)0.57
E)1.37
فتح الحزمة
افتح القفل للوصول البطاقات البالغ عددها 75 في هذه المجموعة.
فتح الحزمة
k this deck
26
For following scatter plot and regression line, at x = 65 the residual is ___.
A)positive
B)zero
C)negative
D)imaginary
E)unknown
A)positive
B)zero
C)negative
D)imaginary
E)unknown
فتح الحزمة
افتح القفل للوصول البطاقات البالغ عددها 75 في هذه المجموعة.
فتح الحزمة
k this deck
27
In the regression equation, y = 75.65 + 0.80x, the intercept is ___.
A)0.80
B)75.65
C)1.00
D)0.00
E)-0.80
A)0.80
B)75.65
C)1.00
D)0.00
E)-0.80
فتح الحزمة
افتح القفل للوصول البطاقات البالغ عددها 75 في هذه المجموعة.
فتح الحزمة
k this deck
28
A cost accountant is developing a regression model to predict the total cost of producing a batch of car seats as a linear function of batch size (the number of seats produced in one lot or batch).The intercept of this model is the ___.
A)batch size
B)unit variable cost
C)fixed cost
D)total cost
E)total variable cost
A)batch size
B)unit variable cost
C)fixed cost
D)total cost
E)total variable cost
فتح الحزمة
افتح القفل للوصول البطاقات البالغ عددها 75 في هذه المجموعة.
فتح الحزمة
k this deck
29
From the following scatter plot, we can say that between y and x there is ___.
A)perfect positive correlation
B)virtually no correlation
C)positive correlation
D)negative correlation
E)perfect negative correlation
A)perfect positive correlation
B)virtually no correlation
C)positive correlation
D)negative correlation
E)perfect negative correlation
فتح الحزمة
افتح القفل للوصول البطاقات البالغ عددها 75 في هذه المجموعة.
فتح الحزمة
k this deck
30
The following residuals plot indicates ___.
A)a nonlinear relation
B)a nonconstant error variance
C)the simple regression assumptions are met
D)the sample is biased
E)the sample is random
A)a nonlinear relation
B)a nonconstant error variance
C)the simple regression assumptions are met
D)the sample is biased
E)the sample is random
فتح الحزمة
افتح القفل للوصول البطاقات البالغ عددها 75 في هذه المجموعة.
فتح الحزمة
k this deck
31
Consider the following scatter plot and regression line.At x = 17, the residual (error term)is ___.
A)positive
B)zero
C)negative
D)imaginary
E)unknown
A)positive
B)zero
C)negative
D)imaginary
E)unknown
فتح الحزمة
افتح القفل للوصول البطاقات البالغ عددها 75 في هذه المجموعة.
فتح الحزمة
k this deck
32
From the following scatter plot, we can say that between y and x there is ___.
A)perfect positive correlation
B)virtually no correlation
C)positive correlation
D)negative correlation
E)perfect negative correlation
A)perfect positive correlation
B)virtually no correlation
C)positive correlation
D)negative correlation
E)perfect negative correlation
فتح الحزمة
افتح القفل للوصول البطاقات البالغ عددها 75 في هذه المجموعة.
فتح الحزمة
k this deck
33
The numerical value of the coefficient of correlation must be ___.
A)between -1 and +1
B)between -1 and 0
C)between 0 and 1
D)equal to SSE/(n - 2)
E)between 0 and -1
A)between -1 and +1
B)between -1 and 0
C)between 0 and 1
D)equal to SSE/(n - 2)
E)between 0 and -1
فتح الحزمة
افتح القفل للوصول البطاقات البالغ عددها 75 في هذه المجموعة.
فتح الحزمة
k this deck
34
One of the assumptions made in simple regression is that ___.
A)the error terms are exponentially distributed
B)the error terms have unequal variances
C)the model is linear
D)the error terms are dependent
E)the model is nonlinear
A)the error terms are exponentially distributed
B)the error terms have unequal variances
C)the model is linear
D)the error terms are dependent
E)the model is nonlinear
فتح الحزمة
افتح القفل للوصول البطاقات البالغ عددها 75 في هذه المجموعة.
فتح الحزمة
k this deck
35
One of the assumptions made in simple regression is that ___.
A)the error terms are normally distributed
B)the error terms have unequal variances
C)the model is nonlinear
D)the error terms are dependent
E)the error terms are all equal
A)the error terms are normally distributed
B)the error terms have unequal variances
C)the model is nonlinear
D)the error terms are dependent
E)the error terms are all equal
فتح الحزمة
افتح القفل للوصول البطاقات البالغ عددها 75 في هذه المجموعة.
فتح الحزمة
k this deck
36
A cost accountant is developing a regression model to predict the total cost of producing a batch of car seats as a function of batch size (the number of seats produced in one lot or batch).The explanatory variable is ___.
A)batch size
B)unit variable cost
C)fixed cost
D)total cost
E)total variable cost
A)batch size
B)unit variable cost
C)fixed cost
D)total cost
E)total variable cost
فتح الحزمة
افتح القفل للوصول البطاقات البالغ عددها 75 في هذه المجموعة.
فتح الحزمة
k this deck
37
The assumptions underlying simple regression analysis include ___.
A)the error terms are exponentially distributed
B)the error terms have unequal variances
C)the model is nonlinear
D)the error terms are dependent
E)the error terms are independent
A)the error terms are exponentially distributed
B)the error terms have unequal variances
C)the model is nonlinear
D)the error terms are dependent
E)the error terms are independent
فتح الحزمة
افتح القفل للوصول البطاقات البالغ عددها 75 في هذه المجموعة.
فتح الحزمة
k this deck
38
The following data is to be used to construct a regression model: The value of the y intercept is ___.
A)1.36
B)2.16
C)0.68
D)0.57
E)2.36
The value of the y intercept is ___.A)1.36
B)2.16
C)0.68
D)0.57
E)2.36
فتح الحزمة
افتح القفل للوصول البطاقات البالغ عددها 75 في هذه المجموعة.
فتح الحزمة
k this deck
39
In the regression equation, y = 75.65 + 0.80x, the slope is ___.
A)0.80
B)75.65
C)1.00
D)0.00
E)-0.80
A)0.80
B)75.65
C)1.00
D)0.00
E)-0.80
فتح الحزمة
افتح القفل للوصول البطاقات البالغ عددها 75 في هذه المجموعة.
فتح الحزمة
k this deck
40
The assumption of constant error variance in regression analysis is called ___.
A)heteroscedasticity
B)homoscedasticity
C)residuals
D)linearity
E)non-normality
A)heteroscedasticity
B)homoscedasticity
C)residuals
D)linearity
E)non-normality
فتح الحزمة
افتح القفل للوصول البطاقات البالغ عددها 75 في هذه المجموعة.
فتح الحزمة
k this deck
41
A researcher has developed a regression model from fifteen pairs of data points.He wants to test to determine if the slope is significantly different from zero.He uses a two-tailed test and = 0.10.The critical table t value is ___.
A)1.771
B)1.350
C)1.761
D)2.145
E)2.068
A)1.771
B)1.350
C)1.761
D)2.145
E)2.068
فتح الحزمة
افتح القفل للوصول البطاقات البالغ عددها 75 في هذه المجموعة.
فتح الحزمة
k this deck
42
The following residuals plot indicates ___.
A)a nonlinear relation
B)a nonconstant error variance
C)the simple regression assumptions are met
D)the sample is biased
E)a random sample
A)a nonlinear relation
B)a nonconstant error variance
C)the simple regression assumptions are met
D)the sample is biased
E)a random sample
فتح الحزمة
افتح القفل للوصول البطاقات البالغ عددها 75 في هذه المجموعة.
فتح الحزمة
k this deck
43
A simple regression model developed for ten pairs of data resulted in a sum of squares of error, SSE = 125.The standard error of the estimate is ___.
A)12.5
B)3.5
C)15.6
D)3.95
E)25
A)12.5
B)3.5
C)15.6
D)3.95
E)25
فتح الحزمة
افتح القفل للوصول البطاقات البالغ عددها 75 في هذه المجموعة.
فتح الحزمة
k this deck
44
In regression analysis, R-squared is also called the ___.
A)residual
B)coefficient of determination
C)coefficient of correlation
D)standard error of the estimate
E)sum of squares of regression
A)residual
B)coefficient of determination
C)coefficient of correlation
D)standard error of the estimate
E)sum of squares of regression
فتح الحزمة
افتح القفل للوصول البطاقات البالغ عددها 75 في هذه المجموعة.
فتح الحزمة
k this deck
45
In a regression analysis if SST = 200 and SSR = 200, r2 = ___.
A)0.25
B)0.75
C)0.00
D)1.00
E)-1.00
A)0.25
B)0.75
C)0.00
D)1.00
E)-1.00
فتح الحزمة
افتح القفل للوصول البطاقات البالغ عددها 75 في هذه المجموعة.
فتح الحزمة
k this deck
46
The numerical value of the coefficient of determination must be ___.
A)between -1 and +1
B)between -1 and 0
C)between 0 and 1
D)equal to SSE/(n - 2)
E)between -100 and +100
A)between -1 and +1
B)between -1 and 0
C)between 0 and 1
D)equal to SSE/(n - 2)
E)between -100 and +100
فتح الحزمة
افتح القفل للوصول البطاقات البالغ عددها 75 في هذه المجموعة.
فتح الحزمة
k this deck
47
If there is perfect negative correlation between two sets of numbers, then ___.
A)r = 0
B)r = -1
C)r = +1
D)SSE=1
E)MSE = 1
A)r = 0
B)r = -1
C)r = +1
D)SSE=1
E)MSE = 1
فتح الحزمة
افتح القفل للوصول البطاقات البالغ عددها 75 في هذه المجموعة.
فتح الحزمة
k this deck
48
For a certain data set the regression equation is y = 21 - 8x.The correlation coefficient between y and x in this data set ___.
A)must be 0
B)is negative
C)must be 1
D)is positive
E)must be >1
A)must be 0
B)is negative
C)must be 1
D)is positive
E)must be >1
فتح الحزمة
افتح القفل للوصول البطاقات البالغ عددها 75 في هذه المجموعة.
فتح الحزمة
k this deck
49
A researcher has developed a regression model from fourteen pairs of data points.He wants to test to determine if the slope is significantly different from zero.He uses a two-tailed test and = 0.01.The critical table t value is ___.
A)2.650
B)3.012
C)3.055
D)2.718
E)2.168
A)2.650
B)3.012
C)3.055
D)2.718
E)2.168
فتح الحزمة
افتح القفل للوصول البطاقات البالغ عددها 75 في هذه المجموعة.
فتح الحزمة
k this deck
50
A manager wants to predict the cost (y)of travel for salespeople based on the number of days (x)spent on each sales trip.The following model has been developed: y = $400 + 120x.If a trip took 3 days, the predicted cost of the trip is ___.
A)760
B)360
C)523
D)1560
E)1080
A)760
B)360
C)523
D)1560
E)1080
فتح الحزمة
افتح القفل للوصول البطاقات البالغ عددها 75 في هذه المجموعة.
فتح الحزمة
k this deck
51
The coefficient of correlation in a simple regression analysis is = - 0.6.The coefficient of determination for this regression would be ___.
A)0.6
B)- 0.6 or + 0.6
C)0.13
D)- 0.36
E)0.36
A)0.6
B)- 0.6 or + 0.6
C)0.13
D)- 0.36
E)0.36
فتح الحزمة
افتح القفل للوصول البطاقات البالغ عددها 75 في هذه المجموعة.
فتح الحزمة
k this deck
52
A manager wishes to predict the annual cost (y)of an automobile based on the number of kilometres (x)driven.The following model was developed: y = 1,550 + .36x.If a car is driven 20,000 kilometres, the predicted cost is ___.
A)7,200
B)5,650
C)8,750
D)2,270
E)6,750
A)7,200
B)5,650
C)8,750
D)2,270
E)6,750
فتح الحزمة
افتح القفل للوصول البطاقات البالغ عددها 75 في هذه المجموعة.
فتح الحزمة
k this deck
53
The proportion of variability of the dependent variable accounted for or explained by the independent variable is called the ___.
A)sum of squares error
B)coefficient of correlation
C)coefficient of determination
D)covariance
E)regression sum of squares
A)sum of squares error
B)coefficient of correlation
C)coefficient of determination
D)covariance
E)regression sum of squares
فتح الحزمة
افتح القفل للوصول البطاقات البالغ عددها 75 في هذه المجموعة.
فتح الحزمة
k this deck
54
A manager wishes to predict the annual cost (y)of an automobile based on the number of kilometres (x)driven.The following model was developed: y = 1,550 + 0.36x.If a car is driven 15,000 kilometres, the predicted cost is ___.
A)2090
B)3850
C)7400
D)6950
E)5400
A)2090
B)3850
C)7400
D)6950
E)5400
فتح الحزمة
افتح القفل للوصول البطاقات البالغ عددها 75 في هذه المجموعة.
فتح الحزمة
k this deck
55
For a certain data set the regression equation is y = 2 + 3.5x.The correlation coefficient between y and x in this data set ___.
A)must be 0
B)is negative
C)must be 1
D)is positive
E)must be 3
A)must be 0
B)is negative
C)must be 1
D)is positive
E)must be 3
فتح الحزمة
افتح القفل للوصول البطاقات البالغ عددها 75 في هذه المجموعة.
فتح الحزمة
k this deck
56
A manager wants to predict the cost (y)of travel for salespeople based on the number of days (x)spent on each sales trip.The following model has been developed: y = $400 + 120x.If a trip took 4 days, the predicted cost of the trip is ___.
A)480
B)880
C)524
D)2080
E)1080
A)480
B)880
C)524
D)2080
E)1080
فتح الحزمة
افتح القفل للوصول البطاقات البالغ عددها 75 في هذه المجموعة.
فتح الحزمة
k this deck
57
A manager wishes to predict the annual cost (y)of an automobile based on the number of kilometres (x)driven.The following model was developed: y = 1,550 + 0.36x.If a car is driven 30,000 kilometres, the predicted cost is ___.
A)10,800
B)12,350
C)2,630
D)9,250
E)10,250
A)10,800
B)12,350
C)2,630
D)9,250
E)10,250
فتح الحزمة
افتح القفل للوصول البطاقات البالغ عددها 75 في هذه المجموعة.
فتح الحزمة
k this deck
58
The total of the squared residuals is called the ___.
A)coefficient of determination
B)sum of squares of error
C)standard error of the estimate
D)R-squared
E)coefficient of correlation
A)coefficient of determination
B)sum of squares of error
C)standard error of the estimate
D)R-squared
E)coefficient of correlation
فتح الحزمة
افتح القفل للوصول البطاقات البالغ عددها 75 في هذه المجموعة.
فتح الحزمة
k this deck
59
If x and y in a regression model are totally unrelated, ___.
A)the correlation coefficient would be -1
B)the coefficient of determination would be 0
C)the coefficient of determination would be 1
D)the SSE would be 0
E)the MSE would be 0s
A)the correlation coefficient would be -1
B)the coefficient of determination would be 0
C)the coefficient of determination would be 1
D)the SSE would be 0
E)the MSE would be 0s
فتح الحزمة
افتح القفل للوصول البطاقات البالغ عددها 75 في هذه المجموعة.
فتح الحزمة
k this deck
60
A standard deviation of the error of the regression model is called the ___.
A)coefficient of determination
B)sum of squares of error
C)standard error of the estimate
D)R-squared
E)coefficient of correlation
A)coefficient of determination
B)sum of squares of error
C)standard error of the estimate
D)R-squared
E)coefficient of correlation
فتح الحزمة
افتح القفل للوصول البطاقات البالغ عددها 75 في هذه المجموعة.
فتح الحزمة
k this deck
61
Abby Kuntz, a market specialist at the market research firm of Saez, Gann, and Spitz, is analyzing household budget data collected by her firm.Abby's dependent variable is monthly household expenditures on groceries (in $'s), and her independent variable is annual household income (in $1,000's).Regression analysis of the data yielded the following tables: 11eb6c3a_ec61_fde9_ad81_59fe2eaa383b_TB8417_00 The correlation coefficient between the two variables in this regression is ___.
A)0.682478
B)-0.83
C)0.83
D)-0.68
E)1.0008s), and her independent variable is annual household income (in $1,000's).Regression analysis of the data yielded the following tables: The correlation coefficient between the two variables in this regression is ___. A)0.682478 B)-0.83 C)0.83 D)-0.68 E)1.0008 " class="answers-bank-image d-block" loading="lazy" > The correlation coefficient between the two variables in this regression is ___.
A)0.682478
B)-0.83
C)0.83
D)-0.68
E)1.0008s), and her independent variable is annual household income (in $1,000's).Regression analysis of the data yielded the following tables: The correlation coefficient between the two variables in this regression is ___. A)0.682478 B)-0.83 C)0.83 D)-0.68 E)1.0008 " class="answers-bank-image d-block" loading="lazy" > 11eb6c3a_ec61_fde9_ad81_59fe2eaa383b_TB8417_00 The correlation coefficient between the two variables in this regression is ___.
A)0.682478
B)-0.83
C)0.83
D)-0.68
E)1.0008
11eb6c3a_ec61_fde9_ad81_59fe2eaa383b_TB8417_00 The correlation coefficient between the two variables in this regression is ___.A)0.682478
B)-0.83
C)0.83
D)-0.68
E)1.0008
A)0.682478
B)-0.83
C)0.83
D)-0.68
E)1.0008
A)0.682478
B)-0.83
C)0.83
D)-0.68
E)1.0008
فتح الحزمة
افتح القفل للوصول البطاقات البالغ عددها 75 في هذه المجموعة.
فتح الحزمة
k this deck
62
Abby Kuntz, a market specialist at the market research firm of Saez, Gann, and Spitz, is analyzing household budget data collected by her firm.Abby's dependent variable is monthly household expenditures on groceries (in $'s), and her independent variable is annual household income (in $1,000's).Regression analysis of the data yielded the following tables. 11eb6c3a_ec62_731f_ad81_5b97fdcd3d3e_TB8417_00 For a household with $50,000 annual income, Abby's model predicts monthly grocery expenditures of ___.
A)$150.35
B)$50.35
C)$1,959.29
D)$128.65
E)$1286.50s), and her independent variable is annual household income (in $1,000's).Regression analysis of the data yielded the following tables. For a household with $50,000 annual income, Abby's model predicts monthly grocery expenditures of ___. A)$150.35 B)$50.35 C)$1,959.29 D)$128.65 E)$1286.50 " class="answers-bank-image d-block" loading="lazy" > For a household with $50,000 annual income, Abby's model predicts monthly grocery expenditures of ___.
A)$150.35
B)$50.35
C)$1,959.29
D)$128.65
E)$1286.50s), and her independent variable is annual household income (in $1,000's).Regression analysis of the data yielded the following tables. For a household with $50,000 annual income, Abby's model predicts monthly grocery expenditures of ___. A)$150.35 B)$50.35 C)$1,959.29 D)$128.65 E)$1286.50 " class="answers-bank-image d-block" loading="lazy" > 11eb6c3a_ec62_731f_ad81_5b97fdcd3d3e_TB8417_00 For a household with $50,000 annual income, Abby's model predicts monthly grocery expenditures of ___.
A)$150.35
B)$50.35
C)$1,959.29
D)$128.65
E)$1286.50
11eb6c3a_ec62_731f_ad81_5b97fdcd3d3e_TB8417_00 For a household with $50,000 annual income, Abby's model predicts monthly grocery expenditures of ___.A)$150.35
B)$50.35
C)$1,959.29
D)$128.65
E)$1286.50
A)$150.35
B)$50.35
C)$1,959.29
D)$128.65
E)$1286.50
A)$150.35
B)$50.35
C)$1,959.29
D)$128.65
E)$1286.50
فتح الحزمة
افتح القفل للوصول البطاقات البالغ عددها 75 في هذه المجموعة.
فتح الحزمة
k this deck
63
Alan Nip, market analyst for Clear Sound Mart, is analyzing the relation between heavy metal CD sales and the size of the teenage population.He gathers data from six sales districts.Alan's dependent variable is annual heavy metal CD sales (in $1,000,000's), and his independent variable is teenage population (in 1,000's).Regression analysis of the data yielded the following tables: Alan's sample size is ___.
A)2
B)4
C)6
D)8
E)10
Alan's sample size is ___.A)2
B)4
C)6
D)8
E)10
فتح الحزمة
افتح القفل للوصول البطاقات البالغ عددها 75 في هذه المجموعة.
فتح الحزمة
k this deck
64
Louis Tang, a cost accountant at Prime Plastics, Inc.(PPI), is analyzing the manufacturing costs of a moulded plastic telephone handset produced by PPI.Louis's independent variable is production lot size (in 1,000's of units), and his dependent variable is the total cost of the lot (in $100's).Regression analysis of the data yielded the following tables: Using = 0.05, Louis should ___.
A)increase the sample size
B)suspend judgment
C)not reject H0: 1 = 0
D)reject H0: 1 = 0
E)do not reject H0: 0 = 0
Using = 0.05, Louis should ___.A)increase the sample size
B)suspend judgment
C)not reject H0: 1 = 0
D)reject H0: 1 = 0
E)do not reject H0: 0 = 0
فتح الحزمة
افتح القفل للوصول البطاقات البالغ عددها 75 في هذه المجموعة.
فتح الحزمة
k this deck
65
Louis Tang, a cost accountant at Prime Plastics, Inc.(PPI), is analyzing the manufacturing costs of a moulded plastic telephone handset produced by PPI.Louis's independent variable is production lot size (in 1,000's of units), and his dependent variable is the total cost of the lot (in $100's).Regression analysis of the data yielded the following tables: The correlation coefficient between Louis's variables is ___.
A)-0.73
B)0.73
C)0.28
D)-0.28
E)0.00
The correlation coefficient between Louis's variables is ___.A)-0.73
B)0.73
C)0.28
D)-0.28
E)0.00
فتح الحزمة
افتح القفل للوصول البطاقات البالغ عددها 75 في هذه المجموعة.
فتح الحزمة
k this deck
66
Louis Tang, a cost accountant at Prime Plastics, Inc.(PPI), is analyzing the manufacturing costs of a moulded plastic telephone handset produced by PPI.Louis's independent variable is production lot size (in 1,000's of units), and his dependent variable is the total cost of the lot (in $100's).Regression analysis of the data yielded the following tables: Louis's regression model is ___.
A)y = -0.358 + 3.996x
B)y = 0.358 + 3.996x
C)y = -3.996 + 0.358x
D)y = 3.996 - 0.358x
E)y = 3.996 + 0.358x
Louis's regression model is ___.A)y = -0.358 + 3.996x
B)y = 0.358 + 3.996x
C)y = -3.996 + 0.358x
D)y = 3.996 - 0.358x
E)y = 3.996 + 0.358x
فتح الحزمة
افتح القفل للوصول البطاقات البالغ عددها 75 في هذه المجموعة.
فتح الحزمة
k this deck
67
Alan Nip, market analyst for Clear Sound Mart, is analyzing the relation between heavy metal CD sales and the size of the teenage population.He gathers data from six sales districts.Alan's dependent variable is annual heavy metal CD sales (in $1,000,000's), and his independent variable is teenage population (in 1,000's).Regression analysis of the data yielded the following tables. The numerical value of the correlation coefficient between the CD sales and the size of teenage population is ___.
A)0.969785
B)0.940483
C)0.224675
D)-0.14156
E)1.000000
The numerical value of the correlation coefficient between the CD sales and the size of teenage population is ___.A)0.969785
B)0.940483
C)0.224675
D)-0.14156
E)1.000000
فتح الحزمة
افتح القفل للوصول البطاقات البالغ عددها 75 في هذه المجموعة.
فتح الحزمة
k this deck
68
Abby Kuntz, a market specialist at the market research firm of Saez, Gann, and Spitz, is analyzing household budget data collected by her firm.Abby's dependent variable is monthly household expenditures on groceries (in $'s), and her independent variable is annual household income (in $1,000's).Regression analysis of the data yielded the following tables. = 0.05, Abby should ___.
A)reject H0: 1 = 0
B)not reject H0: 1 = 0
C)increase the sample size
D)suspend judgment
E)reject H0: 0 = 0s), and her independent variable is annual household income (in $1,000's).Regression analysis of the data yielded the following tables. Using \alpha = 0.05, Abby should ___. A)reject H0: \beta 1 = 0 B)not reject H0: \beta 1 = 0 C)increase the sample size D)suspend judgment E)reject H0: \beta 0 = 0 " class="answers-bank-image d-block" loading="lazy" > 11eb6c3a_ec62_4c0d_ad81_ff858582a93a_TB8417_00 Using = 0.05, Abby should ___.
A)reject H0: 1 = 0
B)not reject H0: 1 = 0
C)increase the sample size
D)suspend judgment
E)reject H0: 0 = 0s), and her independent variable is annual household income (in $1,000's).Regression analysis of the data yielded the following tables. Using \alpha = 0.05, Abby should ___. A)reject H0: \beta 1 = 0 B)not reject H0: \beta 1 = 0 C)increase the sample size D)suspend judgment E)reject H0: \beta 0 = 0 " class="answers-bank-image d-block" loading="lazy" > Using = 0.05, Abby should ___.
A)reject H0: 1 = 0
B)not reject H0: 1 = 0
C)increase the sample size
D)suspend judgment
E)reject H0: 0 = 0s), and her independent variable is annual household income (in $1,000's).Regression analysis of the data yielded the following tables. Using \alpha = 0.05, Abby should ___. A)reject H0: \beta 1 = 0 B)not reject H0: \beta 1 = 0 C)increase the sample size D)suspend judgment E)reject H0: \beta 0 = 0 " class="answers-bank-image d-block" loading="lazy" > 11eb6c3a_ec62_4c0d_ad81_ff858582a93a_TB8417_00 Using = 0.05, Abby should ___.
A)reject H0: 1 = 0
B)not reject H0: 1 = 0
C)increase the sample size
D)suspend judgment
E)reject H0: 0 = 0
= 0.05, Abby should ___.A)reject H0: 1 = 0
B)not reject H0: 1 = 0
C)increase the sample size
D)suspend judgment
E)reject H0: 0 = 0
A)reject H0: 1 = 0
B)not reject H0: 1 = 0
C)increase the sample size
D)suspend judgment
E)reject H0: 0 = 0
A)reject H0: 1 = 0
B)not reject H0: 1 = 0
C)increase the sample size
D)suspend judgment
E)reject H0: 0 = 0
A)reject H0: 1 = 0
B)not reject H0: 1 = 0
C)increase the sample size
D)suspend judgment
E)reject H0: 0 = 0
فتح الحزمة
افتح القفل للوصول البطاقات البالغ عددها 75 في هذه المجموعة.
فتح الحزمة
k this deck
69
Louis Tang, a cost accountant at Prime Plastics, Inc.(PPI), is analyzing the manufacturing costs of a moulded plastic telephone handset produced by PPI.Louis's independent variable is production lot size (in 1,000's of units), and his dependent variable is the total cost of the lot (in $100's).Regression analysis of the data yielded the following tables: For a lot size of 10,000 handsets, Louis' model predicts total cost will be ___.
A)$4,031.80
B)$757.60
C)$3,960.20
D)$354.01
E)$1873.077
For a lot size of 10,000 handsets, Louis' model predicts total cost will be ___.A)$4,031.80
B)$757.60
C)$3,960.20
D)$354.01
E)$1873.077
فتح الحزمة
افتح القفل للوصول البطاقات البالغ عددها 75 في هذه المجموعة.
فتح الحزمة
k this deck
70
Alan Nip, market analyst for Clear Sound Mart, is analyzing the relation between heavy metal CD sales and the size of the teenage population.He gathers data from six sales districts.Alan's dependent variable is annual heavy metal CD sales (in $1,000,000's), and his independent variable is teenage population (in 1,000's).Regression analysis of the data yielded the following tables: For a sales district with 20,000 teenagers, Alan's model predicts annual CD sales of ___.
A)$1,947.08
B)$2,104.04
C)$2,103,900
D)$1,962,340
E)$2,908,089
For a sales district with 20,000 teenagers, Alan's model predicts annual CD sales of ___.A)$1,947.08
B)$2,104.04
C)$2,103,900
D)$1,962,340
E)$2,908,089
فتح الحزمة
افتح القفل للوصول البطاقات البالغ عددها 75 في هذه المجموعة.
فتح الحزمة
k this deck
71
Alan Nip, market analyst for Clear Sound Mart, is analyzing the relation between heavy metal CD sales and the size of the teenage population.He gathers data from six sales districts.Alan's dependent variable is annual heavy metal CD sales (in $1,000,000's), and his independent variable is teenage population (in 1,000's).Regression analysis of the data yielded the following tables: Using = 0.05, Alan should ___.
A)increase the sample size
B)not reject H0: 1 = 0
C)reject H0: 1 = 0
D)suspend judgment
E)reject H0: 0 = 0
Using = 0.05, Alan should ___.A)increase the sample size
B)not reject H0: 1 = 0
C)reject H0: 1 = 0
D)suspend judgment
E)reject H0: 0 = 0
فتح الحزمة
افتح القفل للوصول البطاقات البالغ عددها 75 في هذه المجموعة.
فتح الحزمة
k this deck
72
Abby Kuntz, a market specialist at the market research firm of Saez, Gann, and Spitz, is analyzing household budget data collected by her firm.Abby's dependent variable is monthly household expenditures on groceries (in $'s), and her independent variable is annual household income (in $1,000's).Regression analysis of the data yielded the following tables: 11eb6c3a_ec62_24fb_ad81_a7111ecfb44e_TB8417_00 Abby's sample size (n)is ___.
A)8
B)10
C)11
D)20
E)12s), and her independent variable is annual household income (in $1,000's).Regression analysis of the data yielded the following tables: Abby's sample size (n)is ___. A)8 B)10 C)11 D)20 E)12 " class="answers-bank-image d-block" loading="lazy" > Abby's sample size (n)is ___.
A)8
B)10
C)11
D)20
E)12s), and her independent variable is annual household income (in $1,000's).Regression analysis of the data yielded the following tables: Abby's sample size (n)is ___. A)8 B)10 C)11 D)20 E)12 " class="answers-bank-image d-block" loading="lazy" > 11eb6c3a_ec62_24fb_ad81_a7111ecfb44e_TB8417_00 Abby's sample size (n)is ___.
A)8
B)10
C)11
D)20
E)12
11eb6c3a_ec62_24fb_ad81_a7111ecfb44e_TB8417_00 Abby's sample size (n)is ___.A)8
B)10
C)11
D)20
E)12
A)8
B)10
C)11
D)20
E)12
A)8
B)10
C)11
D)20
E)12
فتح الحزمة
افتح القفل للوصول البطاقات البالغ عددها 75 في هذه المجموعة.
فتح الحزمة
k this deck
73
Alan Nip, market analyst for Clear Sound Mart, is analyzing the relation between heavy metal CD sales and the size of the teenage population.He gathers data from six sales districts.Alan's dependent variable is annual heavy metal CD sales (in $1,000,000's), and his independent variable is teenage population (in 1,000's).Regression analysis of the data yielded the following tables: Alan's regression model can be written as: ___.
A)y = 7.950352 - 0.48455x
B)y = -0.48455 + 7.950352x
C)y = -0.14156 + 0.105195x
D)y = 0.105195 - 0.14156x
E)y = 0.105195 + 0.14156x
Alan's regression model can be written as: ___.A)y = 7.950352 - 0.48455x
B)y = -0.48455 + 7.950352x
C)y = -0.14156 + 0.105195x
D)y = 0.105195 - 0.14156x
E)y = 0.105195 + 0.14156x
فتح الحزمة
افتح القفل للوصول البطاقات البالغ عددها 75 في هذه المجموعة.
فتح الحزمة
k this deck
74
Abby Kuntz, a market specialist at the market research firm of Saez, Gann, and Spitz, is analyzing household budget data collected by her firm.Abby's dependent variable is monthly household expenditures on groceries (in $'s), and her independent variable is annual household income (in $1,000's).Regression analysis of the data yielded the following tables: 11eb6c3a_ec61_d6d7_ad81_a936bb16aa64_TB8417_00 Abby's regression model is ___.
A)y = 39.15 + 2.79x
B)y = 39.15 - 1.79x
C)y = 1.79 + 39.15x
D)y = -1.79 + 39.15x
E)y = 39.15 + 1.79xs), and her independent variable is annual household income (in $1,000's).Regression analysis of the data yielded the following tables: Abby's regression model is ___. A)y = 39.15 + 2.79x B)y = 39.15 - 1.79x C)y = 1.79 + 39.15x D)y = -1.79 + 39.15x E)y = 39.15 + 1.79x " class="answers-bank-image d-block" loading="lazy" > Abby's regression model is ___.
A)y = 39.15 + 2.79x
B)y = 39.15 - 1.79x
C)y = 1.79 + 39.15x
D)y = -1.79 + 39.15x
E)y = 39.15 + 1.79xs), and her independent variable is annual household income (in $1,000's).Regression analysis of the data yielded the following tables: Abby's regression model is ___. A)y = 39.15 + 2.79x B)y = 39.15 - 1.79x C)y = 1.79 + 39.15x D)y = -1.79 + 39.15x E)y = 39.15 + 1.79x " class="answers-bank-image d-block" loading="lazy" > 11eb6c3a_ec61_d6d7_ad81_a936bb16aa64_TB8417_00 Abby's regression model is ___.
A)y = 39.15 + 2.79x
B)y = 39.15 - 1.79x
C)y = 1.79 + 39.15x
D)y = -1.79 + 39.15x
E)y = 39.15 + 1.79x
11eb6c3a_ec61_d6d7_ad81_a936bb16aa64_TB8417_00 Abby's regression model is ___.A)y = 39.15 + 2.79x
B)y = 39.15 - 1.79x
C)y = 1.79 + 39.15x
D)y = -1.79 + 39.15x
E)y = 39.15 + 1.79x
A)y = 39.15 + 2.79x
B)y = 39.15 - 1.79x
C)y = 1.79 + 39.15x
D)y = -1.79 + 39.15x
E)y = 39.15 + 1.79x
A)y = 39.15 + 2.79x
B)y = 39.15 - 1.79x
C)y = 1.79 + 39.15x
D)y = -1.79 + 39.15x
E)y = 39.15 + 1.79x
فتح الحزمة
افتح القفل للوصول البطاقات البالغ عددها 75 في هذه المجموعة.
فتح الحزمة
k this deck
75
Louis Tang, a cost accountant at Prime Plastics, Inc.(PPI), is analyzing the manufacturing costs of a moulded plastic telephone handset produced by PPI.Louis's independent variable is production lot size (in 1,000's of units), and his dependent variable is the total cost of the lot (in $100's).Regression analysis of the data yielded the following tables: Louis's sample size (n)is ___.
A)13
B)14
C)12
D)24
E)1
Louis's sample size (n)is ___.A)13
B)14
C)12
D)24
E)1
فتح الحزمة
افتح القفل للوصول البطاقات البالغ عددها 75 في هذه المجموعة.
فتح الحزمة
k this deck
فتح الحزمة
افتح القفل للوصول البطاقات البالغ عددها 75 في هذه المجموعة.


