Deck 9: Large-Sample Tests of Hypotheses
ملء الشاشة (f)
سؤال
سؤال
The test statistic that is used in testing  vs.
vs.  is
is 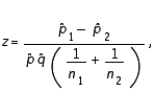 where
where  .
.
vs. is where . سؤال
سؤال
سؤال
سؤال
If we reject the null hypothesis  , we conclude that there is not enough statistical evidence to infer that the population proportions are equal.
, we conclude that there is not enough statistical evidence to infer that the population proportions are equal. سؤال
In testing the null hypothesis  , if
, if  is false, the test could lead to:
A) a Type I error
B) a Type II error
C) a Type O error
D) either a Type I or a Type II error
E) neither a Type I nor a Type II error
, if is false, the test could lead to:A) a Type I error
B) a Type II error
C) a Type O error
D) either a Type I or a Type II error
E) neither a Type I nor a Type II error
سؤال
When the necessary conditions are met, a two-tailed test is being conducted to test the difference between two population proportions. The two sample proportions are  and
and  , respectively, and the standard error of the sampling distribution of
  is 0.04. Then, the calculated value of the test statistic will be 1.50.
and , respectively, and the standard error of the sampling distribution of is 0.04. Then, the calculated value of the test statistic will be 1.50. سؤال
In testing  vs.
vs.  the test statistic value is found to be z = 1.28. The p-value of the test is approximately .1003.
vs. the test statistic value is found to be z = 1.28. The p-value of the test is approximately .1003. سؤال
سؤال
When the necessary conditions are met, a two-tail test is being conducted to test the difference between two population proportions. The two sample proportions are  and
and  , and the standard error of the sampling distribution of
  is 0.04. The calculated value of the test statistic will be:
A) z = 0.25
B) z = 1.25
C) t = 0.25
D) t = 0.80
E) t = 1.25
and , and the standard error of the sampling distribution of is 0.04. The calculated value of the test statistic will be:A) z = 0.25
B) z = 1.25
C) t = 0.25
D) t = 0.80
E) t = 1.25
سؤال
سؤال
سؤال
When the necessary conditions are met, a two-tailed test is being conducted to test the difference between two population proportions. The two sample proportions are  and
and  , and the standard error of the sampling distribution of
  is 0.0085. The calculated value of the test statistic will be z = 3.41.
and , and the standard error of the sampling distribution of is 0.0085. The calculated value of the test statistic will be z = 3.41. سؤال
When the necessary conditions are met, a lower tailed test is being conducted for the difference between two population proportions. If the value of the test statistic is -2.43, then the null hypothesis cannot be rejected at  = 0.025.
= 0.025. سؤال
سؤال
When the necessary conditions are met, a two-tailed test is being conducted for the difference between two population proportions. If the value of the test statistic is 1.96, then the null hypothesis is rejected at  = 0.10.
= 0.10. سؤال
In testing  vs.
vs.  using a significance level equal to .05, the critical value that will be used to conduct the test is z = 1.645.
vs. using a significance level equal to .05, the critical value that will be used to conduct the test is z = 1.645. سؤال
سؤال
In testing  vs/
vs/  the following summary statistics are found:

 and
and  Based on these results, the null hypothesis should be rejected at the significance level
  .
.
vs/ the following summary statistics are found: and Based on these results, the null hypothesis should be rejected at the significance level . سؤال
In testing  vs.
vs.  a random sample of size 100 produced a sample proportion
  Given these results, the test statistic value is z = -.655.
vs. a random sample of size 100 produced a sample proportion Given these results, the test statistic value is z = -.655. سؤال
In testing  vs.
vs.  at
at  , any p-value greater than .025 will lead to a rejection of the null hypothesis.
vs. at , any p-value greater than .025 will lead to a rejection of the null hypothesis. سؤال
If the null hypothesis  is rejected at the 0.05 level of significance, it must be rejected at the 0.01 level.
is rejected at the 0.05 level of significance, it must be rejected at the 0.01 level. سؤال
A one-tailed hypothesis test of the population proportion is used when the alternative hypothesis takes the form  .
.
. سؤال
In testing  vs.
vs.  a random sample of size 200 produced a sample proportion
  Given these results, the null hypothesis should not be rejected at
  = .05.
vs. a random sample of size 200 produced a sample proportion Given these results, the null hypothesis should not be rejected at = .05. سؤال
A two-tailed hypothesis test of the population proportion takes the form  vs.
vs.  .
.
vs. . سؤال
Independent random samples of n1 = 150 and n2 = 150 sales phone calls for an insurance policy were randomly selected from binomial populations 1 and 2, respectively. Sample 1 had 80 successful sales, and sample 2 had 88 successful sales. Suppose you have no preconceived theory concerning which parameter, p1 or p2, is the larger and you wish to detect only a difference between the two parameters if one exists.
Calculate the standard error of the difference in the two sample proportions, . Make sure to use the pooled estimate for the common value of p.
______________
Calculate the test statistic that you would use for the test above. Based on your knowledge of the standard normal distribution, is this a likely or unlikely observation, assuming that H0 is true and the two population proportions are the same?
Test statistic = ______________
Find the p-value for the test. Test for a significant difference in the population means at the 1% significance level.
p-value = ______________
Find the rejection region when = 0.01. Do the data provide sufficient evidence to indicate a difference in the population proportions?
Critical Value(s) = ______________
Conclusion: ______________
Interpretation: __________________________________________
Calculate the standard error of the difference in the two sample proportions,
. Make sure to use the pooled estimate for the common value of p.______________
Calculate the test statistic that you would use for the test above. Based on your knowledge of the standard normal distribution, is this a likely or unlikely observation, assuming that H0 is true and the two population proportions are the same?
Test statistic = ______________
Find the p-value for the test. Test for a significant difference in the population means at the 1% significance level.
p-value = ______________
Find the rejection region when
= 0.01. Do the data provide sufficient evidence to indicate a difference in the population proportions?Critical Value(s) = ______________
Conclusion: ______________
Interpretation: __________________________________________
سؤال
The Environmental Protection Agency wanted to compare the proportion of plants in violation of air quality standards for two different industries: steel and utility. Two independent samples of plants were selected and monitored. The following data was recorded: 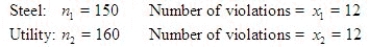 Test at
  = 0.01
Test statistic = ______________
Critical Value(s) = ______________
Conclusion: ______________
Interpretation: __________________________________________
Test at = 0.01Test statistic = ______________
Critical Value(s) = ______________
Conclusion: ______________
Interpretation: __________________________________________
سؤال
A cable company in Michigan is thinking of offering its service in one of two counties; Mecosta and Newaygo. Allegedly, the proportion of households in either county ready to hook up to the cable is the same, but the company wants to test the claim. Accordingly, it takes a simple random sample in each county. In Mecosta county, 175 of 2900 households say they will join. In Newaygo county, 665 of 800 households say so.
Calculate the pooled estimate of the common proportion p.
______________
Calculate the standard error of .
.
______________
Calculate the value of the test statistic.
______________
Calculate the p-value and write your conclusion given that = 0.05.
______________
Conclusion: ______________
Interpretation: __________________________________________
Construct 95% confidence interval for the difference in proportions of households in Mecosta and Newaygo counties who are ready to hook up to the cable.
______________
Explain how to use the 95% confidence interval to test the appropriate hypotheses at = 0.05.
__________________________________________
Calculate the pooled estimate of the common proportion p.
______________
Calculate the standard error of
.______________
Calculate the value of the test statistic.
______________
Calculate the p-value and write your conclusion given that
= 0.05.______________
Conclusion: ______________
Interpretation: __________________________________________
Construct 95% confidence interval for the difference in proportions of households in Mecosta and Newaygo counties who are ready to hook up to the cable.
______________
Explain how to use the 95% confidence interval to test the appropriate hypotheses at
= 0.05.__________________________________________
سؤال
A manufacturing plant has two assembly lines for producing plastic bottles. The plant manager was concerned about whether the proportion of defective bottles differed between the two lines. Two independent random samples were selected and the following summary data computed: 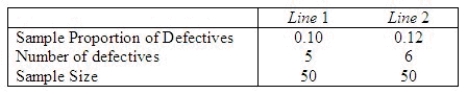 Perform the appropriate test of hypothesis using
  = 0.05.
Test statistic = ______________
Critical Value(s) = ______________
Conclusion: ______________
Interpretation: __________________________________________
Perform the appropriate test of hypothesis using = 0.05.Test statistic = ______________
Critical Value(s) = ______________
Conclusion: ______________
Interpretation: __________________________________________
سؤال
When testing  vs.
vs.  , an increase in the sample size will result in a decrease in the probability of committing a Type I error.
vs. , an increase in the sample size will result in a decrease in the probability of committing a Type I error. سؤال
An experiment was conducted to test the effect of a new drug on a viral infection. The infection was induced in 100 mice, and the mice were randomly split into two groups of 50. The first group, the control group, received no treatment for the infection. The second group received the drug. The proportions of survivors,  and
and  , in the two groups after a 30-day period, were found to be 0.40 and 0.64, respectively. Is there sufficient evidence to indicate that the drug is effective in treating the viral infection? Use
  = 0.05.
Test statistic = ______________
Critical Value(s) = ______________
Conclusion: ______________
Interpretation: __________________________________________
Use a 95% confidence interval to estimate the actual difference in the cure rates for the treated versus the control groups.
______________
and , in the two groups after a 30-day period, were found to be 0.40 and 0.64, respectively. Is there sufficient evidence to indicate that the drug is effective in treating the viral infection? Use = 0.05.Test statistic = ______________
Critical Value(s) = ______________
Conclusion: ______________
Interpretation: __________________________________________
Use a 95% confidence interval to estimate the actual difference in the cure rates for the treated versus the control groups.
______________
سؤال
سؤال
سؤال
In testing the hypotheses
H0: p1 - p2 = 0.10 vs.
Ha: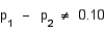 .
.
Use the following statistics, where x1 and x2 represent the number of Dial Soap sales in the two samples, respectively.
n1 = 150, x1 = 72
n2 = 175, x2 = 70
What conclusion can we draw at the 5% significance level?
Test statistic = ______________
Critical Value(s) = ______________
Conclusion: ______________
What is the p-value of the test?
p-value = ______________
Explain how to use the p-value to test the hypotheses.
____________________________
Estimate with 95% confidence the difference between the two population proportions.
______________
Interpret and explain how to use the confidence interval to test the hypotheses.
__________________________________________
H0: p1 - p2 = 0.10 vs.
Ha:
.Use the following statistics, where x1 and x2 represent the number of Dial Soap sales in the two samples, respectively.
n1 = 150, x1 = 72
n2 = 175, x2 = 70
What conclusion can we draw at the 5% significance level?
Test statistic = ______________
Critical Value(s) = ______________
Conclusion: ______________
What is the p-value of the test?
p-value = ______________
Explain how to use the p-value to test the hypotheses.
____________________________
Estimate with 95% confidence the difference between the two population proportions.
______________
Interpret and explain how to use the confidence interval to test the hypotheses.
__________________________________________
سؤال
In testing  vs.
vs.  the level of significance must be twice as large as when testing
  vs.
vs.  .
.
vs. the level of significance must be twice as large as when testing vs. . سؤال
When the hypothesized proportion  is close to 0.50, the spread in the sampling distribution of the sample proportion
  is greater than when
  is close to 0.0 or 1.0.
is close to 0.50, the spread in the sampling distribution of the sample proportion is greater than when is close to 0.0 or 1.0. سؤال
In testing  vs.
vs.  the test statistic value is found to be equal to 1.20. The p-value for this test would be approximately .1151.
vs. the test statistic value is found to be equal to 1.20. The p-value for this test would be approximately .1151. سؤال
The campaign manager of John Kerry believes that more than 52% of the registered voters will vote in favor of Kerry. If you wish to test this claim, the appropriate null and alternative hypotheses are  vs.
vs.  .
.
vs. . سؤال
A group in favor of freezing production of nuclear weapons believes that the proportion of individuals in favor of a nuclear freeze is greater for those who have seen the movie "The Day After" (population 1) than those who have not (population 2). In an attempt to verify this belief, random samples of size 500 are obtained from the populations of interest. Among those who had seen "The Day After", 228 were in favor of a freeze. For those who had not seen the movie, 196 favored a freeze. Test using  = 0.05.
Test statistic = ______________
Critical Value(s) = ______________
Conclusion: ______________
Interpretation: __________________________________________
= 0.05.Test statistic = ______________
Critical Value(s) = ______________
Conclusion: ______________
Interpretation: __________________________________________
سؤال
سؤال
The upper limit of the 85% confidence interval for the population proportion p, given that n = 60 and  = 0.20 is 0.274.
= 0.20 is 0.274. سؤال
The sampling distribution of  is approximately normal, provided that the sample size is large enough (n > 30).
is approximately normal, provided that the sample size is large enough (n > 30). سؤال
In testing  vs.
vs.  random sample of size 200 produced a sample proportion
  Given these results, the p-value of the test is approximately:
A) .4616
B) .5384
C) .0384
D) .0768
E) .2812
vs. random sample of size 200 produced a sample proportion Given these results, the p-value of the test is approximately:A) .4616
B) .5384
C) .0384
D) .0768
E) .2812
سؤال
سؤال
سؤال
سؤال
The rejection region for testing  at the 0.05 level of significance is:
A) |z| < 1.28
B) |z| > 1.96
C) z > 1.645
D) z < 2.33
E) z < 2.58
at the 0.05 level of significance is:A) |z| < 1.28
B) |z| > 1.96
C) z > 1.645
D) z < 2.33
E) z < 2.58
سؤال
The lower limit of the 90% confidence interval for the population proportion p, given that n = 400 and  = 0.10 is 0.1247.
= 0.10 is 0.1247. سؤال
A professor of statistics refutes the claim that the proportion of Republican voters in Michigan is at most 44%. To test the claim, the hypotheses:  ,
,  , should be used.
, , should be used. سؤال
سؤال
In testing a hypothesis about a population proportion p, the z test statistic measures how close the computed sample proportion  has come to the hypothesized population parameter.
has come to the hypothesized population parameter. سؤال
سؤال
Assuming that all necessary conditions are met, what needs to be changed in the formula 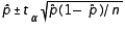 , so that we can use it to construct a confidence interval estimate for the population proportion p?
A) The p̂ should be replaced by p.
B) The ta should be replaced by za.
C) The ta should be replaced by ta/2.
D) The ta should be replaced by za/2.
E) The p̂ should be replaced by za/2.
, so that we can use it to construct a confidence interval estimate for the population proportion p?A) The p̂ should be replaced by p.
B) The ta should be replaced by za.
C) The ta should be replaced by ta/2.
D) The ta should be replaced by za/2.
E) The p̂ should be replaced by za/2.
سؤال
سؤال
سؤال
سؤال
سؤال
In selecting the sample size to estimate the population proportion p, if we have no knowledge of even the approximate values of the sample proportion  , we:
, we:
A) take another sample and estimate
B) take two more samples and find the average of their
C) let=0.50
D) let=0.95
E) let=0.05
, we:A) take another sample and estimate
B) take two more samples and find the average of their
C) let=0.50
D) let=0.95
E) let=0.05
سؤال
سؤال
In testing the difference between two population means using two independent samples, the sampling distribution of the sample mean difference  is normal if the sample sizes are both greater than 30.
is normal if the sample sizes are both greater than 30. سؤال
سؤال
سؤال
If you wish to test whether two populations means are the same, the appropriate null and alternative hypotheses would be:  vs.
vs.  .
.
vs. . سؤال
سؤال
In testing the difference between two population means using two independent samples, we use the pooled variance in estimating the standard error of the sampling distribution of the sample mean difference  if the populations are normal with equal variances.
if the populations are normal with equal variances. سؤال
In estimating the difference between two population means, the following summary statistics were found: 


 and
and  Based on these results, the point estimate of
  is .70.
and Based on these results, the point estimate of is .70. سؤال
سؤال
سؤال
سؤال
سؤال
سؤال
سؤال
سؤال
If we reject the null hypothesis  at the 0.01 level of significance, then we must also reject it at the 0.05 level.
at the 0.01 level of significance, then we must also reject it at the 0.05 level. سؤال
سؤال
سؤال
سؤال
سؤال
In estimating the difference between two population means, the estimate for the standard deviation of the sampling distribution of  is found by taking the square root of the sum of the two sample variances.
is found by taking the square root of the sum of the two sample variances.
فتح الحزمة
قم بالتسجيل لفتح البطاقات في هذه المجموعة!
Unlock Deck
Unlock Deck
1/210
العب
ملء الشاشة (f)
Deck 9: Large-Sample Tests of Hypotheses
1
In constructing a confidence interval estimate for the difference between two population proportions, we:
A) pool the population proportions when the populations are normally distributed
B) pool the population proportions when the population means are equal
C) pool the population proportions when they are equal
D) never pool the population proportions to construct confidence interval for
E) always pool the population proportions to construct confidence interval for
never pool the population proportions to construct confidence interval for
2
The test statistic that is used in testing vs. is where .
vs. is where .False
3
When the necessary conditions are met, a lower tailed test is being conducted for the difference between two population proportions. If the value of the test statistic is -2.50, then the p-value is 0.0062.
True
4
A sample of size 150 from population 1 has 40 successes. A sample of size 250 from population 2 has 30 successes. The value of the test statistic for testing the null hypothesis that the proportion of successes in population one exceeds the proportion of successes in population two by 0.05 is:
A) 1.645
B) 2.327
C) 1.960
D) 1.977
E) 1.772
A) 1.645
B) 2.327
C) 1.960
D) 1.977
E) 1.772
فتح الحزمة
افتح القفل للوصول البطاقات البالغ عددها 210 في هذه المجموعة.
فتح الحزمة
k this deck
5
For testing the difference between two population proportions, the pooled proportion estimate should be used to compute the value of the test statistic when the:
A) populations are normally distributed
B) sample sizes are small
C) samples are independently drawn from the populations
D) null hypothesis states that the two population proportions are equal
E) populations are normally distributed and sample sizes are small
A) populations are normally distributed
B) sample sizes are small
C) samples are independently drawn from the populations
D) null hypothesis states that the two population proportions are equal
E) populations are normally distributed and sample sizes are small
فتح الحزمة
افتح القفل للوصول البطاقات البالغ عددها 210 في هذه المجموعة.
فتح الحزمة
k this deck
6
If we reject the null hypothesis , we conclude that there is not enough statistical evidence to infer that the population proportions are equal.
, we conclude that there is not enough statistical evidence to infer that the population proportions are equal. فتح الحزمة
افتح القفل للوصول البطاقات البالغ عددها 210 في هذه المجموعة.
فتح الحزمة
k this deck
7
In testing the null hypothesis , if is false, the test could lead to:
A) a Type I error
B) a Type II error
C) a Type O error
D) either a Type I or a Type II error
E) neither a Type I nor a Type II error
, if is false, the test could lead to:A) a Type I error
B) a Type II error
C) a Type O error
D) either a Type I or a Type II error
E) neither a Type I nor a Type II error
فتح الحزمة
افتح القفل للوصول البطاقات البالغ عددها 210 في هذه المجموعة.
فتح الحزمة
k this deck
8
When the necessary conditions are met, a two-tailed test is being conducted to test the difference between two population proportions. The two sample proportions are and , respectively, and the standard error of the sampling distribution of is 0.04. Then, the calculated value of the test statistic will be 1.50.
and , respectively, and the standard error of the sampling distribution of is 0.04. Then, the calculated value of the test statistic will be 1.50. فتح الحزمة
افتح القفل للوصول البطاقات البالغ عددها 210 في هذه المجموعة.
فتح الحزمة
k this deck
9
In testing vs. the test statistic value is found to be z = 1.28. The p-value of the test is approximately .1003.
vs. the test statistic value is found to be z = 1.28. The p-value of the test is approximately .1003. فتح الحزمة
افتح القفل للوصول البطاقات البالغ عددها 210 في هذه المجموعة.
فتح الحزمة
k this deck
10
A sample of size 100 selected from one population has 60 successes, and a sample of size 150 selected from a second population has 95 successes. The test statistic for testing the equality of the population proportions equal to:
A) -0.5319
B) 0.7293
C) -0.419
D) 0.2702
E) -0.3518
A) -0.5319
B) 0.7293
C) -0.419
D) 0.2702
E) -0.3518
فتح الحزمة
افتح القفل للوصول البطاقات البالغ عددها 210 في هذه المجموعة.
فتح الحزمة
k this deck
11
When the necessary conditions are met, a two-tail test is being conducted to test the difference between two population proportions. The two sample proportions are and , and the standard error of the sampling distribution of is 0.04. The calculated value of the test statistic will be:
A) z = 0.25
B) z = 1.25
C) t = 0.25
D) t = 0.80
E) t = 1.25
and , and the standard error of the sampling distribution of is 0.04. The calculated value of the test statistic will be:A) z = 0.25
B) z = 1.25
C) t = 0.25
D) t = 0.80
E) t = 1.25
فتح الحزمة
افتح القفل للوصول البطاقات البالغ عددها 210 في هذه المجموعة.
فتح الحزمة
k this deck
12
When the necessary conditions are met, a two-tail test is being conducted to test the difference between two population proportions. If the value of the test statistic is 2.05, then the p-value is:
A) 0.4798
B) 0.0404
C) 0.2399
D) 0.0202
E) 0.1982
A) 0.4798
B) 0.0404
C) 0.2399
D) 0.0202
E) 0.1982
فتح الحزمة
افتح القفل للوصول البطاقات البالغ عددها 210 في هذه المجموعة.
فتح الحزمة
k this deck
13
When the necessary conditions are met, an upper tailed test is being conducted for the difference between two population proportions. If the value of the test statistic is 2.90, then the p-value is 0.0038.
فتح الحزمة
افتح القفل للوصول البطاقات البالغ عددها 210 في هذه المجموعة.
فتح الحزمة
k this deck
14
When the necessary conditions are met, a two-tailed test is being conducted to test the difference between two population proportions. The two sample proportions are and , and the standard error of the sampling distribution of is 0.0085. The calculated value of the test statistic will be z = 3.41.
and , and the standard error of the sampling distribution of is 0.0085. The calculated value of the test statistic will be z = 3.41. فتح الحزمة
افتح القفل للوصول البطاقات البالغ عددها 210 في هذه المجموعة.
فتح الحزمة
k this deck
15
When the necessary conditions are met, a lower tailed test is being conducted for the difference between two population proportions. If the value of the test statistic is -2.43, then the null hypothesis cannot be rejected at = 0.025.
= 0.025. فتح الحزمة
افتح القفل للوصول البطاقات البالغ عددها 210 في هذه المجموعة.
فتح الحزمة
k this deck
16
Which of the following is a required condition for using the normal approximation to the binomial in testing the difference between two population proportions?
A) n1p1 ≥ 30 and n2p2 ≥ 30
B) n1p1 ≥ 5 and n2p2 ≥ 5
C) n1p1 ≥ 5 , n1(1-p1) ≥ 5 , n2p2 ≥ 5 and n2(1-p2) ≥ 5
D) n1p̂1 ≥ 5 , n1(1-p̂1) ≥ 5 , n2p̂2 ≥ 5 and n2(1-p̂2) ≥ 5
E) n1p1 ≥ 10 and n2p2 ≥ 10
A) n1p1 ≥ 30 and n2p2 ≥ 30
B) n1p1 ≥ 5 and n2p2 ≥ 5
C) n1p1 ≥ 5 , n1(1-p1) ≥ 5 , n2p2 ≥ 5 and n2(1-p2) ≥ 5
D) n1p̂1 ≥ 5 , n1(1-p̂1) ≥ 5 , n2p̂2 ≥ 5 and n2(1-p̂2) ≥ 5
E) n1p1 ≥ 10 and n2p2 ≥ 10
فتح الحزمة
افتح القفل للوصول البطاقات البالغ عددها 210 في هذه المجموعة.
فتح الحزمة
k this deck
17
When the necessary conditions are met, a two-tailed test is being conducted for the difference between two population proportions. If the value of the test statistic is 1.96, then the null hypothesis is rejected at = 0.10.
= 0.10. فتح الحزمة
افتح القفل للوصول البطاقات البالغ عددها 210 في هذه المجموعة.
فتح الحزمة
k this deck
18
In testing vs. using a significance level equal to .05, the critical value that will be used to conduct the test is z = 1.645.
vs. using a significance level equal to .05, the critical value that will be used to conduct the test is z = 1.645. فتح الحزمة
افتح القفل للوصول البطاقات البالغ عددها 210 في هذه المجموعة.
فتح الحزمة
k this deck
19
When the necessary conditions are met, a two-tailed test is being conducted for the difference between two population proportions. If the value of the test statistic is -1.35, then the p-value is 0.0885.
فتح الحزمة
افتح القفل للوصول البطاقات البالغ عددها 210 في هذه المجموعة.
فتح الحزمة
k this deck
20
In testing vs/ the following summary statistics are found: and Based on these results, the null hypothesis should be rejected at the significance level .
vs/ the following summary statistics are found: and Based on these results, the null hypothesis should be rejected at the significance level . فتح الحزمة
افتح القفل للوصول البطاقات البالغ عددها 210 في هذه المجموعة.
فتح الحزمة
k this deck
21
In testing vs. a random sample of size 100 produced a sample proportion Given these results, the test statistic value is z = -.655.
vs. a random sample of size 100 produced a sample proportion Given these results, the test statistic value is z = -.655. فتح الحزمة
افتح القفل للوصول البطاقات البالغ عددها 210 في هذه المجموعة.
فتح الحزمة
k this deck
22
In testing vs. at , any p-value greater than .025 will lead to a rejection of the null hypothesis.
vs. at , any p-value greater than .025 will lead to a rejection of the null hypothesis. فتح الحزمة
افتح القفل للوصول البطاقات البالغ عددها 210 في هذه المجموعة.
فتح الحزمة
k this deck
23
If the null hypothesis is rejected at the 0.05 level of significance, it must be rejected at the 0.01 level.
is rejected at the 0.05 level of significance, it must be rejected at the 0.01 level. فتح الحزمة
افتح القفل للوصول البطاقات البالغ عددها 210 في هذه المجموعة.
فتح الحزمة
k this deck
24
A one-tailed hypothesis test of the population proportion is used when the alternative hypothesis takes the form .
. فتح الحزمة
افتح القفل للوصول البطاقات البالغ عددها 210 في هذه المجموعة.
فتح الحزمة
k this deck
25
In testing vs. a random sample of size 200 produced a sample proportion Given these results, the null hypothesis should not be rejected at = .05.
vs. a random sample of size 200 produced a sample proportion Given these results, the null hypothesis should not be rejected at = .05. فتح الحزمة
افتح القفل للوصول البطاقات البالغ عددها 210 في هذه المجموعة.
فتح الحزمة
k this deck
26
A two-tailed hypothesis test of the population proportion takes the form vs. .
vs. . فتح الحزمة
افتح القفل للوصول البطاقات البالغ عددها 210 في هذه المجموعة.
فتح الحزمة
k this deck
27
Independent random samples of n1 = 150 and n2 = 150 sales phone calls for an insurance policy were randomly selected from binomial populations 1 and 2, respectively. Sample 1 had 80 successful sales, and sample 2 had 88 successful sales. Suppose you have no preconceived theory concerning which parameter, p1 or p2, is the larger and you wish to detect only a difference between the two parameters if one exists.
Calculate the standard error of the difference in the two sample proportions, . Make sure to use the pooled estimate for the common value of p.
______________
Calculate the test statistic that you would use for the test above. Based on your knowledge of the standard normal distribution, is this a likely or unlikely observation, assuming that H0 is true and the two population proportions are the same?
Test statistic = ______________
Find the p-value for the test. Test for a significant difference in the population means at the 1% significance level.
p-value = ______________
Find the rejection region when = 0.01. Do the data provide sufficient evidence to indicate a difference in the population proportions?
Critical Value(s) = ______________
Conclusion: ______________
Interpretation: __________________________________________
Calculate the standard error of the difference in the two sample proportions,
. Make sure to use the pooled estimate for the common value of p.______________
Calculate the test statistic that you would use for the test above. Based on your knowledge of the standard normal distribution, is this a likely or unlikely observation, assuming that H0 is true and the two population proportions are the same?
Test statistic = ______________
Find the p-value for the test. Test for a significant difference in the population means at the 1% significance level.
p-value = ______________
Find the rejection region when
= 0.01. Do the data provide sufficient evidence to indicate a difference in the population proportions?Critical Value(s) = ______________
Conclusion: ______________
Interpretation: __________________________________________
فتح الحزمة
افتح القفل للوصول البطاقات البالغ عددها 210 في هذه المجموعة.
فتح الحزمة
k this deck
28
The Environmental Protection Agency wanted to compare the proportion of plants in violation of air quality standards for two different industries: steel and utility. Two independent samples of plants were selected and monitored. The following data was recorded: Test at = 0.01
Test statistic = ______________
Critical Value(s) = ______________
Conclusion: ______________
Interpretation: __________________________________________
Test at = 0.01Test statistic = ______________
Critical Value(s) = ______________
Conclusion: ______________
Interpretation: __________________________________________
فتح الحزمة
افتح القفل للوصول البطاقات البالغ عددها 210 في هذه المجموعة.
فتح الحزمة
k this deck
29
A cable company in Michigan is thinking of offering its service in one of two counties; Mecosta and Newaygo. Allegedly, the proportion of households in either county ready to hook up to the cable is the same, but the company wants to test the claim. Accordingly, it takes a simple random sample in each county. In Mecosta county, 175 of 2900 households say they will join. In Newaygo county, 665 of 800 households say so.
Calculate the pooled estimate of the common proportion p.
______________
Calculate the standard error of .
______________
Calculate the value of the test statistic.
______________
Calculate the p-value and write your conclusion given that = 0.05.
______________
Conclusion: ______________
Interpretation: __________________________________________
Construct 95% confidence interval for the difference in proportions of households in Mecosta and Newaygo counties who are ready to hook up to the cable.
______________
Explain how to use the 95% confidence interval to test the appropriate hypotheses at = 0.05.
__________________________________________
Calculate the pooled estimate of the common proportion p.
______________
Calculate the standard error of
.______________
Calculate the value of the test statistic.
______________
Calculate the p-value and write your conclusion given that
= 0.05.______________
Conclusion: ______________
Interpretation: __________________________________________
Construct 95% confidence interval for the difference in proportions of households in Mecosta and Newaygo counties who are ready to hook up to the cable.
______________
Explain how to use the 95% confidence interval to test the appropriate hypotheses at
= 0.05.__________________________________________
فتح الحزمة
افتح القفل للوصول البطاقات البالغ عددها 210 في هذه المجموعة.
فتح الحزمة
k this deck
30
A manufacturing plant has two assembly lines for producing plastic bottles. The plant manager was concerned about whether the proportion of defective bottles differed between the two lines. Two independent random samples were selected and the following summary data computed: Perform the appropriate test of hypothesis using = 0.05.
Test statistic = ______________
Critical Value(s) = ______________
Conclusion: ______________
Interpretation: __________________________________________
Perform the appropriate test of hypothesis using = 0.05.Test statistic = ______________
Critical Value(s) = ______________
Conclusion: ______________
Interpretation: __________________________________________
فتح الحزمة
افتح القفل للوصول البطاقات البالغ عددها 210 في هذه المجموعة.
فتح الحزمة
k this deck
31
When testing vs. , an increase in the sample size will result in a decrease in the probability of committing a Type I error.
vs. , an increase in the sample size will result in a decrease in the probability of committing a Type I error. فتح الحزمة
افتح القفل للوصول البطاقات البالغ عددها 210 في هذه المجموعة.
فتح الحزمة
k this deck
32
An experiment was conducted to test the effect of a new drug on a viral infection. The infection was induced in 100 mice, and the mice were randomly split into two groups of 50. The first group, the control group, received no treatment for the infection. The second group received the drug. The proportions of survivors, and , in the two groups after a 30-day period, were found to be 0.40 and 0.64, respectively. Is there sufficient evidence to indicate that the drug is effective in treating the viral infection? Use = 0.05.
Test statistic = ______________
Critical Value(s) = ______________
Conclusion: ______________
Interpretation: __________________________________________
Use a 95% confidence interval to estimate the actual difference in the cure rates for the treated versus the control groups.
______________
and , in the two groups after a 30-day period, were found to be 0.40 and 0.64, respectively. Is there sufficient evidence to indicate that the drug is effective in treating the viral infection? Use = 0.05.Test statistic = ______________
Critical Value(s) = ______________
Conclusion: ______________
Interpretation: __________________________________________
Use a 95% confidence interval to estimate the actual difference in the cure rates for the treated versus the control groups.
______________
فتح الحزمة
افتح القفل للوصول البطاقات البالغ عددها 210 في هذه المجموعة.
فتح الحزمة
k this deck
33
In testing the hypotheses H0: p1 - p2 = 0 vs. Ha: p1 - p2 > 0, use the following statistics, where x1 and x2 represent the number of defective components found in medical instruments in the two samples.
n1 = 200, x1 = 80
n2 = 400, x2 = 140
What conclusion can we draw at the 5% significance level?
Test statistic = ______________
Critical Value(s) = ______________
Conclusion: ______________
What is the p-value of the test?
p-value = ______________
Explain how to use the p-value to test the hypotheses.
____________________________
Estimate with 95% confidence the difference between the two population proportions.
______________
فتح الحزمة
افتح القفل للوصول البطاقات البالغ عددها 210 في هذه المجموعة.
فتح الحزمة
k this deck
34
Suppose in testing a hypothesis about a proportion, the p-value is computed to be 0.027. The null hypothesis should be rejected if the chosen level of significance is 0.01.
فتح الحزمة
افتح القفل للوصول البطاقات البالغ عددها 210 في هذه المجموعة.
فتح الحزمة
k this deck
35
In testing the hypotheses
H0: p1 - p2 = 0.10 vs.
Ha: .
Use the following statistics, where x1 and x2 represent the number of Dial Soap sales in the two samples, respectively.
n1 = 150, x1 = 72
n2 = 175, x2 = 70
What conclusion can we draw at the 5% significance level?
Test statistic = ______________
Critical Value(s) = ______________
Conclusion: ______________
What is the p-value of the test?
p-value = ______________
Explain how to use the p-value to test the hypotheses.
____________________________
Estimate with 95% confidence the difference between the two population proportions.
______________
Interpret and explain how to use the confidence interval to test the hypotheses.
__________________________________________
H0: p1 - p2 = 0.10 vs.
Ha:
.Use the following statistics, where x1 and x2 represent the number of Dial Soap sales in the two samples, respectively.
n1 = 150, x1 = 72
n2 = 175, x2 = 70
What conclusion can we draw at the 5% significance level?
Test statistic = ______________
Critical Value(s) = ______________
Conclusion: ______________
What is the p-value of the test?
p-value = ______________
Explain how to use the p-value to test the hypotheses.
____________________________
Estimate with 95% confidence the difference between the two population proportions.
______________
Interpret and explain how to use the confidence interval to test the hypotheses.
__________________________________________
فتح الحزمة
افتح القفل للوصول البطاقات البالغ عددها 210 في هذه المجموعة.
فتح الحزمة
k this deck
36
In testing vs. the level of significance must be twice as large as when testing vs. .
vs. the level of significance must be twice as large as when testing vs. . فتح الحزمة
افتح القفل للوصول البطاقات البالغ عددها 210 في هذه المجموعة.
فتح الحزمة
k this deck
37
When the hypothesized proportion is close to 0.50, the spread in the sampling distribution of the sample proportion is greater than when is close to 0.0 or 1.0.
is close to 0.50, the spread in the sampling distribution of the sample proportion is greater than when is close to 0.0 or 1.0. فتح الحزمة
افتح القفل للوصول البطاقات البالغ عددها 210 في هذه المجموعة.
فتح الحزمة
k this deck
38
In testing vs. the test statistic value is found to be equal to 1.20. The p-value for this test would be approximately .1151.
vs. the test statistic value is found to be equal to 1.20. The p-value for this test would be approximately .1151. فتح الحزمة
افتح القفل للوصول البطاقات البالغ عددها 210 في هذه المجموعة.
فتح الحزمة
k this deck
39
The campaign manager of John Kerry believes that more than 52% of the registered voters will vote in favor of Kerry. If you wish to test this claim, the appropriate null and alternative hypotheses are vs. .
vs. . فتح الحزمة
افتح القفل للوصول البطاقات البالغ عددها 210 في هذه المجموعة.
فتح الحزمة
k this deck
40
A group in favor of freezing production of nuclear weapons believes that the proportion of individuals in favor of a nuclear freeze is greater for those who have seen the movie "The Day After" (population 1) than those who have not (population 2). In an attempt to verify this belief, random samples of size 500 are obtained from the populations of interest. Among those who had seen "The Day After", 228 were in favor of a freeze. For those who had not seen the movie, 196 favored a freeze. Test using = 0.05.
Test statistic = ______________
Critical Value(s) = ______________
Conclusion: ______________
Interpretation: __________________________________________
= 0.05.Test statistic = ______________
Critical Value(s) = ______________
Conclusion: ______________
Interpretation: __________________________________________
فتح الحزمة
افتح القفل للوصول البطاقات البالغ عددها 210 في هذه المجموعة.
فتح الحزمة
k this deck
41
The lower limit of a confidence interval at the 95% level of confidence for the population proportion if a sample of size 200 had 40 successes is:
A) 0.2554
B) 0.1446
C) 0.2465
D) 0.1535
E) 0.3390
A) 0.2554
B) 0.1446
C) 0.2465
D) 0.1535
E) 0.3390
فتح الحزمة
افتح القفل للوصول البطاقات البالغ عددها 210 في هذه المجموعة.
فتح الحزمة
k this deck
42
The upper limit of the 85% confidence interval for the population proportion p, given that n = 60 and = 0.20 is 0.274.
= 0.20 is 0.274. فتح الحزمة
افتح القفل للوصول البطاقات البالغ عددها 210 في هذه المجموعة.
فتح الحزمة
k this deck
43
The sampling distribution of is approximately normal, provided that the sample size is large enough (n > 30).
is approximately normal, provided that the sample size is large enough (n > 30). فتح الحزمة
افتح القفل للوصول البطاقات البالغ عددها 210 في هذه المجموعة.
فتح الحزمة
k this deck
44
In testing vs. random sample of size 200 produced a sample proportion Given these results, the p-value of the test is approximately:
A) .4616
B) .5384
C) .0384
D) .0768
E) .2812
vs. random sample of size 200 produced a sample proportion Given these results, the p-value of the test is approximately:A) .4616
B) .5384
C) .0384
D) .0768
E) .2812
فتح الحزمة
افتح القفل للوصول البطاقات البالغ عددها 210 في هذه المجموعة.
فتح الحزمة
k this deck
45
In a one-tail test for the population proportion, if the null hypothesis is not rejected when the alternative hypothesis is false, a Type II error is committed.
فتح الحزمة
افتح القفل للوصول البطاقات البالغ عددها 210 في هذه المجموعة.
فتح الحزمة
k this deck
46
In a two-tail test for the population proportion, if the null hypothesis is rejected when the alternative hypothesis is false, a Type I error is committed.
فتح الحزمة
افتح القفل للوصول البطاقات البالغ عددها 210 في هذه المجموعة.
فتح الحزمة
k this deck
47
Suppose in testing a hypothesis about a proportion, the p-value is computed to be 0.038. The null hypothesis should be rejected if the chosen level of significance is 0.05.
فتح الحزمة
افتح القفل للوصول البطاقات البالغ عددها 210 في هذه المجموعة.
فتح الحزمة
k this deck
48
The rejection region for testing at the 0.05 level of significance is:
A) |z| < 1.28
B) |z| > 1.96
C) z > 1.645
D) z < 2.33
E) z < 2.58
at the 0.05 level of significance is:A) |z| < 1.28
B) |z| > 1.96
C) z > 1.645
D) z < 2.33
E) z < 2.58
فتح الحزمة
افتح القفل للوصول البطاقات البالغ عددها 210 في هذه المجموعة.
فتح الحزمة
k this deck
49
The lower limit of the 90% confidence interval for the population proportion p, given that n = 400 and = 0.10 is 0.1247.
= 0.10 is 0.1247. فتح الحزمة
افتح القفل للوصول البطاقات البالغ عددها 210 في هذه المجموعة.
فتح الحزمة
k this deck
50
A professor of statistics refutes the claim that the proportion of Republican voters in Michigan is at most 44%. To test the claim, the hypotheses: , , should be used.
, , should be used. فتح الحزمة
افتح القفل للوصول البطاقات البالغ عددها 210 في هذه المجموعة.
فتح الحزمة
k this deck
51
In a hypothesis test involving the population proportion, which of the following would be an acceptable formulation?
A) H0 : p̂ = .25 vs Ha : p̂ < .25 .
B) H0 : p̂ = .25 vs Ha : p̂ > .25 .
C) H0 : p̂ = .25 vs Ha : p̂ ≠ .25 .
D) H0 : p̂ = .25 vs. Ha : p̂ < .25 and H0 : p̂ = .25 vs. Ha : p̂ > .25 are acceptable
E) none of these
A) H0 : p̂ = .25 vs Ha : p̂ < .25 .
B) H0 : p̂ = .25 vs Ha : p̂ > .25 .
C) H0 : p̂ = .25 vs Ha : p̂ ≠ .25 .
D) H0 : p̂ = .25 vs. Ha : p̂ < .25 and H0 : p̂ = .25 vs. Ha : p̂ > .25 are acceptable
E) none of these
فتح الحزمة
افتح القفل للوصول البطاقات البالغ عددها 210 في هذه المجموعة.
فتح الحزمة
k this deck
52
In testing a hypothesis about a population proportion p, the z test statistic measures how close the computed sample proportion has come to the hypothesized population parameter.
has come to the hypothesized population parameter. فتح الحزمة
افتح القفل للوصول البطاقات البالغ عددها 210 في هذه المجموعة.
فتح الحزمة
k this deck
53
The use of the standard normal distribution for constructing confidence interval estimate for the population proportion p requires:
A) andare both greater than 5, wheredenotes the sample proportion
B) np and n(1 - p) are both greater than 5
C) n(p +) and n(p -) are both greater than 5
D) that the sample size is greater than 5
E) that the sample size is greater than 10
A) andare both greater than 5, wheredenotes the sample proportion
B) np and n(1 - p) are both greater than 5
C) n(p +) and n(p -) are both greater than 5
D) that the sample size is greater than 5
E) that the sample size is greater than 10
فتح الحزمة
افتح القفل للوصول البطاقات البالغ عددها 210 في هذه المجموعة.
فتح الحزمة
k this deck
54
Assuming that all necessary conditions are met, what needs to be changed in the formula , so that we can use it to construct a confidence interval estimate for the population proportion p?
A) The p̂ should be replaced by p.
B) The ta should be replaced by za.
C) The ta should be replaced by ta/2.
D) The ta should be replaced by za/2.
E) The p̂ should be replaced by za/2.
, so that we can use it to construct a confidence interval estimate for the population proportion p?A) The p̂ should be replaced by p.
B) The ta should be replaced by za.
C) The ta should be replaced by ta/2.
D) The ta should be replaced by za/2.
E) The p̂ should be replaced by za/2.
فتح الحزمة
افتح القفل للوصول البطاقات البالغ عددها 210 في هذه المجموعة.
فتح الحزمة
k this deck
55
Suppose in testing a hypothesis about a proportion, the z test statistic is computed to be 1.92. The null hypothesis should be rejected if the chosen level of significance is 0.01 and a two-tailed test is used.
فتح الحزمة
افتح القفل للوصول البطاقات البالغ عددها 210 في هذه المجموعة.
فتح الحزمة
k this deck
56
In a one-tail test about the population proportion p, the p-value is found to be equal to 0.0352. If the test had been two-tail, the p-value would have been 0.0704.
فتح الحزمة
افتح القفل للوصول البطاقات البالغ عددها 210 في هذه المجموعة.
فتح الحزمة
k this deck
57
A two-tailed test of the population proportion produces a test statistic z = 1.77. The p-value of the test is 0.4616.
فتح الحزمة
افتح القفل للوصول البطاقات البالغ عددها 210 في هذه المجموعة.
فتح الحزمة
k this deck
58
If a null hypothesis about the population proportion p is rejected at the 0.10 level of significance, it must be rejected at the 0.05 level.
فتح الحزمة
افتح القفل للوصول البطاقات البالغ عددها 210 في هذه المجموعة.
فتح الحزمة
k this deck
59
In selecting the sample size to estimate the population proportion p, if we have no knowledge of even the approximate values of the sample proportion , we:
A) take another sample and estimate
B) take two more samples and find the average of their
C) let=0.50
D) let=0.95
E) let=0.05
, we:A) take another sample and estimate
B) take two more samples and find the average of their
C) let=0.50
D) let=0.95
E) let=0.05
فتح الحزمة
افتح القفل للوصول البطاقات البالغ عددها 210 في هذه المجموعة.
فتح الحزمة
k this deck
60
For a given data set and confidence level, the confidence interval of the population proportion p will be wider for 95% confidence than for 90% confidence.
فتح الحزمة
افتح القفل للوصول البطاقات البالغ عددها 210 في هذه المجموعة.
فتح الحزمة
k this deck
61
In testing the difference between two population means using two independent samples, the sampling distribution of the sample mean difference is normal if the sample sizes are both greater than 30.
is normal if the sample sizes are both greater than 30. فتح الحزمة
افتح القفل للوصول البطاقات البالغ عددها 210 في هذه المجموعة.
فتح الحزمة
k this deck
62
A survey claims that 9 out of 10 doctors recommend aspirin for their patients with headaches. To test this claim against the alternative that the actual proportion of doctors who recommend aspirin is less than 0.90, a random sample of 100 doctors' results in 83 who indicate that they recommend aspirin. The value of the test statistic in this problem is approximately equal to:
A) -1.67
B) -2.33
C) -1.86
D) -0.14
E) -2.58
A) -1.67
B) -2.33
C) -1.86
D) -0.14
E) -2.58
فتح الحزمة
افتح القفل للوصول البطاقات البالغ عددها 210 في هذه المجموعة.
فتح الحزمة
k this deck
63
After calculating the sample size needed to estimate a population proportion to within 0.04, your statistics professor told you the maximum allowable error must be reduced to just .01. If the original calculation led to a sample size of 800, the sample size will now have to be:
A) 800
B) 3200
C) 12,800
D) 6400
E) 1600
A) 800
B) 3200
C) 12,800
D) 6400
E) 1600
فتح الحزمة
افتح القفل للوصول البطاقات البالغ عددها 210 في هذه المجموعة.
فتح الحزمة
k this deck
64
If you wish to test whether two populations means are the same, the appropriate null and alternative hypotheses would be: vs. .
vs. . فتح الحزمة
افتح القفل للوصول البطاقات البالغ عددها 210 في هذه المجموعة.
فتح الحزمة
k this deck
65
The z-test can be used to determine whether two population means are equal.
فتح الحزمة
افتح القفل للوصول البطاقات البالغ عددها 210 في هذه المجموعة.
فتح الحزمة
k this deck
66
In testing the difference between two population means using two independent samples, we use the pooled variance in estimating the standard error of the sampling distribution of the sample mean difference if the populations are normal with equal variances.
if the populations are normal with equal variances. فتح الحزمة
افتح القفل للوصول البطاقات البالغ عددها 210 في هذه المجموعة.
فتح الحزمة
k this deck
67
In estimating the difference between two population means, the following summary statistics were found: and Based on these results, the point estimate of is .70.
and Based on these results, the point estimate of is .70. فتح الحزمة
افتح القفل للوصول البطاقات البالغ عددها 210 في هذه المجموعة.
فتح الحزمة
k this deck
68
The width of a confidence interval estimate for a proportion will be:
A) narrower for 99% confidence than for 95% confidence
B) wider for a sample size of 100 than for a sample size of 50
C) narrower for 90% confidence than for 95% confidence
D) narrower when the sample proportion if 0.50 than when the sample proportion is 0.20
E) none of these
A) narrower for 99% confidence than for 95% confidence
B) wider for a sample size of 100 than for a sample size of 50
C) narrower for 90% confidence than for 95% confidence
D) narrower when the sample proportion if 0.50 than when the sample proportion is 0.20
E) none of these
فتح الحزمة
افتح القفل للوصول البطاقات البالغ عددها 210 في هذه المجموعة.
فتح الحزمة
k this deck
69
Which of the following would be an appropriate null hypothesis?
A) The population proportion is equal to 0.60.
B) The sample proportion is equal to 0.60.
C) The population proportion is not equal to 0.60.
D) The population proportion is greater than 0.60.
E) All of these.
A) The population proportion is equal to 0.60.
B) The sample proportion is equal to 0.60.
C) The population proportion is not equal to 0.60.
D) The population proportion is greater than 0.60.
E) All of these.
فتح الحزمة
افتح القفل للوصول البطاقات البالغ عددها 210 في هذه المجموعة.
فتح الحزمة
k this deck
70
A political analyst in Iowa surveys a random sample of registered Democrats and compares the results with those obtained from a random sample of registered Republicans. This would be an example of two independent samples.
فتح الحزمة
افتح القفل للوصول البطاقات البالغ عددها 210 في هذه المجموعة.
فتح الحزمة
k this deck
71
In testing the difference between two population means using two independent samples, the population standard deviations are assumed to be known, and the calculated test statistic equals 2.75. If the test is two-tail and 5% level of significance has been specified, the conclusion should be not to reject the null hypothesis.
فتح الحزمة
افتح القفل للوصول البطاقات البالغ عددها 210 في هذه المجموعة.
فتح الحزمة
k this deck
72
The significance level in a hypothesis test for the difference between two population means is the same as the probability of committing a Type I error.
فتح الحزمة
افتح القفل للوصول البطاقات البالغ عددها 210 في هذه المجموعة.
فتح الحزمة
k this deck
73
With all other factors held constant, increasing the confidence level for a confidence interval estimate for the difference between two population means will result in a wider confidence interval estimate.
فتح الحزمة
افتح القفل للوصول البطاقات البالغ عددها 210 في هذه المجموعة.
فتح الحزمة
k this deck
74
Which of the following would be an appropriate alternative hypothesis?
A) The population proportion is less than 0.65.
B) The sample proportion is less than 0.65.
C) The population proportion is equal to 0.65.
D) The sample proportion is equal to 0.65.
E) The population proportion is less than 0.65 and the sample proportion is equal to 0.65.
A) The population proportion is less than 0.65.
B) The sample proportion is less than 0.65.
C) The population proportion is equal to 0.65.
D) The sample proportion is equal to 0.65.
E) The population proportion is less than 0.65 and the sample proportion is equal to 0.65.
فتح الحزمة
افتح القفل للوصول البطاقات البالغ عددها 210 في هذه المجموعة.
فتح الحزمة
k this deck
75
If we reject the null hypothesis at the 0.01 level of significance, then we must also reject it at the 0.05 level.
at the 0.01 level of significance, then we must also reject it at the 0.05 level. فتح الحزمة
افتح القفل للوصول البطاقات البالغ عددها 210 في هذه المجموعة.
فتح الحزمة
k this deck
76
From a sample of 400 items, 14 are found to be defective. The point estimate of the population proportion defective will be:
A) 14
B) 0.035
C) 28.57
D) 0.05
E) 0.26
A) 14
B) 0.035
C) 28.57
D) 0.05
E) 0.26
فتح الحزمة
افتح القفل للوصول البطاقات البالغ عددها 210 في هذه المجموعة.
فتح الحزمة
k this deck
77
Independent samples are those for which the selection process for one is not related to the selection process for the other.
فتح الحزمة
افتح القفل للوصول البطاقات البالغ عددها 210 في هذه المجموعة.
فتح الحزمة
k this deck
78
Increasing the size of the samples in a study to estimate the difference between two population means will increase the probability of committing a Type I error that a decision maker can have regarding the interval estimate.
فتح الحزمة
افتح القفل للوصول البطاقات البالغ عددها 210 في هذه المجموعة.
فتح الحزمة
k this deck
79
In estimating the difference between two population means, if a 90% confidence interval includes zero, then we can be 90% certain that the difference between the two population means is zero.
فتح الحزمة
افتح القفل للوصول البطاقات البالغ عددها 210 في هذه المجموعة.
فتح الحزمة
k this deck
80
In estimating the difference between two population means, the estimate for the standard deviation of the sampling distribution of is found by taking the square root of the sum of the two sample variances.
is found by taking the square root of the sum of the two sample variances. فتح الحزمة
افتح القفل للوصول البطاقات البالغ عددها 210 في هذه المجموعة.
فتح الحزمة
k this deck
فتح الحزمة
افتح القفل للوصول البطاقات البالغ عددها 210 في هذه المجموعة.


