Deck 18: Extending the Analysis of Aggregate Supply
ملء الشاشة (f)
سؤال
سؤال
سؤال
سؤال
سؤال
سؤال
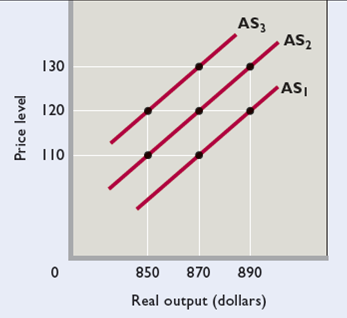
Use the accompanying figure to answer the follow questions. Assume that the economy initially is operating at price level 120 and real output level $870. This output level is the economy's potential (or full-employment) level of output. Next, suppose that the price level rises from 120 to 130. By how much will real output increase in the short run? In the
LO1
LO1
سؤال
سؤال
Suppose the full-employment level of real output (Q) for a hypothetical economy is $250 and the price level (P) initially is 100. Use the short-run aggregate supply schedules below to answer the questions that follow:
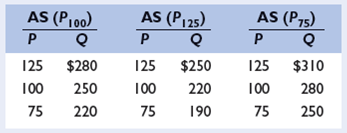
a.?What will be the level of real output in the short run if the price level unexpectedly rises from 100 to 125 because of an increase in aggregate demand? What if the price level unexpectedly falls from 100 to 75 because of a decrease in aggregate demand? Explain each situation, using numbers from the table.
b.?What will be the level of real output in the
c.? Show the circumstances described in parts a and b on graph paper, and derive the
سؤال
سؤال
سؤال
سؤال
سؤال
سؤال
سؤال
سؤال
سؤال
سؤال
سؤال
سؤال
سؤال

فتح الحزمة
قم بالتسجيل لفتح البطاقات في هذه المجموعة!
Unlock Deck
Unlock Deck
1/21
العب
ملء الشاشة (f)
Deck 18: Extending the Analysis of Aggregate Supply
1
Use graphical analysis to show how each of the following would affect the economy first in the short run and then in the
b.?Construction spending on new homes rises dramatically, greatly increasing total U.S. investment spending.
c.?Economic recession occurs abroad, significantly reducing foreign purchases of U.S. exports.
b.?Construction spending on new homes rises dramatically, greatly increasing total U.S. investment spending.
c.?Economic recession occurs abroad, significantly reducing foreign purchases of U.S. exports.
(a) Because of a war abroad, the oil supply to the is disrupted, sending oil prices rocketing upwards. It shifts aggregate supply curve leftwards from AS 1 to AS 2 because of the increase in the per-unit production cost of producing and transporting goods and services rises significantly and the price level rises from P 1 to P 2. In the(b) Construction spending on new homes rises dramatically, greatly increasing total investment spending. An increase in the investment spending shifts aggregate demand curve rightwards from AD1 to AD2. This increase in aggregate demand increases the price level from P1 to P2 and expands real output from Yp to Y2, and hence a positive GDP gap occurs. In the(c) Economic recession occurs abroad, significantly reducing foreign purchases of exports. It shifts aggregate demand leftwards from AD1 to AD2. If prices and wages are downwardly flexible, the price level falls from P1 to P2 and real output decreases from Yp to Y2, and hence a negative GDP gap occurs.
In the
In the
2
Why might one person work more, earn more, and pay more income tax when his or her tax rate is cut, while another person will work less, earn less, and pay less income tax under the same circumstance?
Proponents of supply-side economics argue that one person work more, earn more, and pay more income tax when his or her tax rate is cut because tax cuts provides work incentives to the person who substitute work for leisure since the opportunity cost of leisure has increaseD.But critics of supply-side economics reason that another person will work less, earn less, and pay less income tax under the same circumstances because tax cuts provides him or her higher after-tax pay enabling him or her to enjoy more leisure, and hence with tax cut, he or she can earn the same level of after-tax income as before with fewer work hours.
3
Between 1990 and 2009, the U.S. price level rose by about 64 percent while real output increased by about 62 percent. Use the aggregate demand-aggregate supply model to illustrate these outcomes graphically.
Between 1990 and 2007, the price level rose by about 61 percent while real output increased by about 63 percent. Economic growth driven by supply factors (quantity and quality of resources and technology) shifts thePrice level ASLR 1 ASLR 2 

 AD 2
AD 2  AD 1
AD 1  P 2
P 2
P 1 AS 2
AS 1
0 Q 1 Q 2 Real GDP
Economic growth with mild inflation
AD 2 AD 1 P 2 P 1 AS 2
AS 1
0 Q 1 Q 2
Real GDPEconomic growth with mild inflation
4
Distinguish between the short run and the
فتح الحزمة
افتح القفل للوصول البطاقات البالغ عددها 21 في هذه المجموعة.
فتح الحزمة
k this deck
5
LAST WORD On average, does an increase in taxes raise or lower real GDP? If taxes as a percent of GDP go up 1 percent, by how much does real GDP change? Are the decreases in real GDP caused by tax increases temporary or permanent? Does the intention of a tax increase matter?
فتح الحزمة
افتح القفل للوصول البطاقات البالغ عددها 21 في هذه المجموعة.
فتح الحزمة
k this deck
6
Use the accompanying figure to answer the follow questions. Assume that the economy initially is operating at price level 120 and real output level $870. This output level is the economy's potential (or full-employment) level of output. Next, suppose that the price level rises from 120 to 130. By how much will real output increase in the short run? In the
LO1
LO1
فتح الحزمة
افتح القفل للوصول البطاقات البالغ عددها 21 في هذه المجموعة.
فتح الحزمة
k this deck
7
Assume there is a particular short-run aggregate supply curve for an economy and the curve is relevant for -several years. Use the AD-AS analysis to show graphically why higher rates of inflation over this period would be associated with
فتح الحزمة
افتح القفل للوصول البطاقات البالغ عددها 21 في هذه المجموعة.
فتح الحزمة
k this deck
8
Suppose the full-employment level of real output (Q) for a hypothetical economy is $250 and the price level (P) initially is 100. Use the short-run aggregate supply schedules below to answer the questions that follow:
a.?What will be the level of real output in the short run if the price level unexpectedly rises from 100 to 125 because of an increase in aggregate demand? What if the price level unexpectedly falls from 100 to 75 because of a decrease in aggregate demand? Explain each situation, using numbers from the table.
b.?What will be the level of real output in the
c.? Show the circumstances described in parts a and b on graph paper, and derive the
فتح الحزمة
افتح القفل للوصول البطاقات البالغ عددها 21 في هذه المجموعة.
فتح الحزمة
k this deck
9
Aggregate supply shocks can cause______ rates of inflation that are accompanied by_______ rates of unemployment.
A) Higher; higher.
B) Higher;
Chigher.
Dlower.
A) Higher; higher.
B) Higher;
Chigher.
Dlower.
فتح الحزمة
افتح القفل للوصول البطاقات البالغ عددها 21 في هذه المجموعة.
فتح الحزمة
k this deck
10
Which of the following statements are true? Which are false? Explain why the false statements are untrueaggregate supply curves reflect an inverse relationship between the price level and the level of real output.
b.?The
c.?In the
b.?The
c.?In the
فتح الحزمة
افتح القفل للوصول البطاقات البالغ عددها 21 في هذه المجموعة.
فتح الحزمة
k this deck
11
Suppose that firms are expecting 6 percent inflation while workers are expecting 9 percent inflation. How much of a pay raise will workers demand if their goal is to maintain the purchasing power of their incomes?
A) 3 percent.
B) 6 percent
C) 9 percent.
D) 12 percent.
A) 3 percent.
B) 6 percent
C) 9 percent.
D) 12 percent.
فتح الحزمة
افتح القفل للوصول البطاقات البالغ عددها 21 في هذه المجموعة.
فتح الحزمة
k this deck
12
ADVANCED ANALYSIS Suppose that the equation for a particular short-run AS curve is P = 20 +.5 Q , where P is the price level and Q is real output in dollar terms. What is Q if the price level is 120? Suppose that the Q in your answer is the full-employment level of output. By how much will Q increase in the short run if the price level unexpectedly rises from 120 to 132? By how much will Q increase in the
فتح الحزمة
افتح القفل للوصول البطاقات البالغ عددها 21 في هذه المجموعة.
فتح الحزمة
k this deck
13
Suppose that firms were expecting inflation to be 3 percent, but then it actually turned out to be 7 percent. Other things equal, firm profits will be:
a. Smaller than expected.
b. Larger than expected.
a. Smaller than expected.
b. Larger than expected.
فتح الحزمة
افتح القفل للوصول البطاقات البالغ عددها 21 في هذه المجموعة.
فتح الحزمة
k this deck
14
Suppose that AD and AS intersect at an output level that is higher than the full-employment output level. After the economy adjusts back to equilibrium in the a. Higher than it is now.
Bthan it is now.
C) The same as it is now.
Bthan it is now.
C) The same as it is now.
فتح الحزمة
افتح القفل للوصول البطاقات البالغ عددها 21 في هذه المجموعة.
فتح الحزمة
k this deck
15
Suppose the government misjudges the natural rate of unemployment to be much
فتح الحزمة
افتح القفل للوصول البطاقات البالغ عددها 21 في هذه المجموعة.
فتح الحزمة
k this deck
16
Suppose that over a 30-year period Buskerville's price level increased from 72 to 138 while its real GDP rose from $1.2 trillion to $2.1 trillion. Did economic growth occur in Buskerville? If so, by what average yearly rate? Did Buskerville experience inflation? If so, by what average yearly rate? Which shifted rightward faster in Buskerville: its
فتح الحزمة
افتح القفل للوصول البطاقات البالغ عددها 21 في هذه المجموعة.
فتح الحزمة
k this deck
17
Suppose that an economy begins in a. The AD curve shifting right.
B) The AS curve shifting right.
C) The AD curve shifting left.
D) The AS curve shifting left.
B) The AS curve shifting right.
C) The AD curve shifting left.
D) The AS curve shifting left.
فتح الحزمة
افتح القفل للوصول البطاقات البالغ عددها 21 في هذه المجموعة.
فتح الحزمة
k this deck
18
What do the distinctions between short-run aggregate supply and
فتح الحزمة
افتح القفل للوصول البطاقات البالغ عددها 21 في هذه المجموعة.
فتح الحزمة
k this deck
19
Suppose that for years East Confetti's short-run Phillips Curve was such that each 1 percentage point increase in its unemployment rate was associated with a 2 percentage point decline in its inflation rate. Then, during several recent years the short run pattern changed such that its inflation rate rose by 3 percentage points for every 1 percentage point drop in its unemployment rate. Graphically, did East Confetti's Phillips Curve shift upward or did it shift downward?
فتح الحزمة
افتح القفل للوصول البطاقات البالغ عددها 21 في هذه المجموعة.
فتح الحزمة
k this deck
20
Identify the two descriptions below as being the result of either cost-push inflation or demand-pull inflation.
a. Real GDP is below the full-employment level and prices have risen recently.
b. Real GDP is above the full-employment level and prices have risen recently.
a. Real GDP is below the full-employment level and prices have risen recently.
b. Real GDP is above the full-employment level and prices have risen recently.
فتح الحزمة
افتح القفل للوصول البطاقات البالغ عددها 21 في هذه المجموعة.
فتح الحزمة
k this deck
21
What is the Laffer Curve, and how does it relate to supply-side economics? Why is determining the economy's
فتح الحزمة
افتح القفل للوصول البطاقات البالغ عددها 21 في هذه المجموعة.
فتح الحزمة
k this deck
فتح الحزمة
افتح القفل للوصول البطاقات البالغ عددها 21 في هذه المجموعة.


