Deck 6: Correlation and Linear Regression
ملء الشاشة (f)
سؤال
The scatterplot shows monthly sales figures (in units) and number of months of experience for a sample of salespeople. 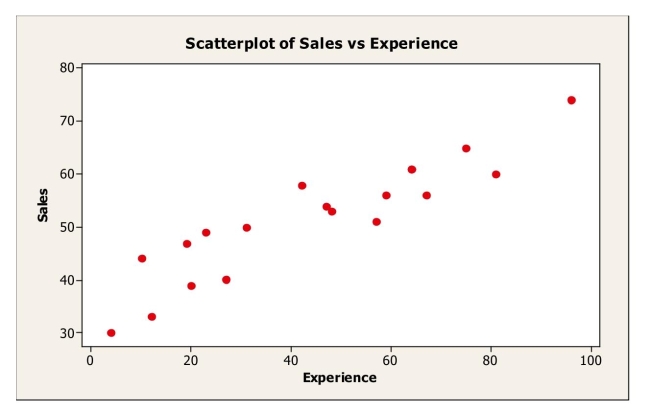 The correlation between monthly sales and level of experience is most likely
A)-.235.
B)0.
C).180.
D)-.914.
E).914.
The correlation between monthly sales and level of experience is most likelyA)-.235.
B)0.
C).180.
D)-.914.
E).914.
سؤال
The following scatterplot shows monthly sales figures (in units) and number of
months of experience on the job for a sample of 19 salespeople.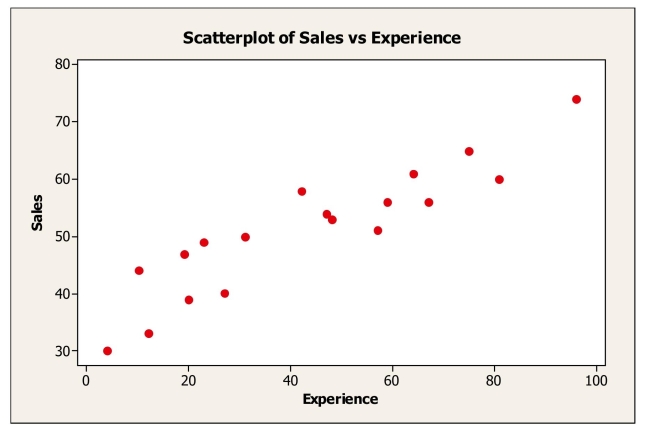 a.Describe the association between monthly sales and level of experience.
b.Do these data satisfy the conditions for computing a correlation coefficient? Explain.
c.Estimate the correlation.
months of experience on the job for a sample of 19 salespeople.
a.Describe the association between monthly sales and level of experience.b.Do these data satisfy the conditions for computing a correlation coefficient? Explain.
c.Estimate the correlation.
سؤال
A company studying the productivity of its employees on a new information system was interested in determining if the age (X) of data entry operators influenced the number
Of completed entries made per hour (Y).The regression equation is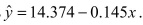 Suppose the actual completed entries per hour for an operator who is 35 years old was 8.
The residual is
A)-1.3
B)2.6
C)-3.5
D)1.3
E)-2.2
Of completed entries made per hour (Y).The regression equation is
Suppose the actual completed entries per hour for an operator who is 35 years old was 8.The residual is
A)-1.3
B)2.6
C)-3.5
D)1.3
E)-2.2
سؤال
Shown below is a correlation table showing correlation coefficients between stock price, earnings per share (EPS) and price/earnings (P/E) ratio for a sample of 19
Publicly traded companies.Which of the following statements is false?
Correlations: Stock Price, EPS, PE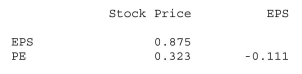
A)EPS is the best predictor of stock price.
B)The strongest correlation is between EPS and stock price.
C)There is a weak negative association between PE and EPS.
D)PE is the best predictor of stock price.
E)The weakest correlation is between PE and EPS.
سؤال
The scatterplot shows monthly sales figures (in units) and number of months of experience for a sample of salespeople. 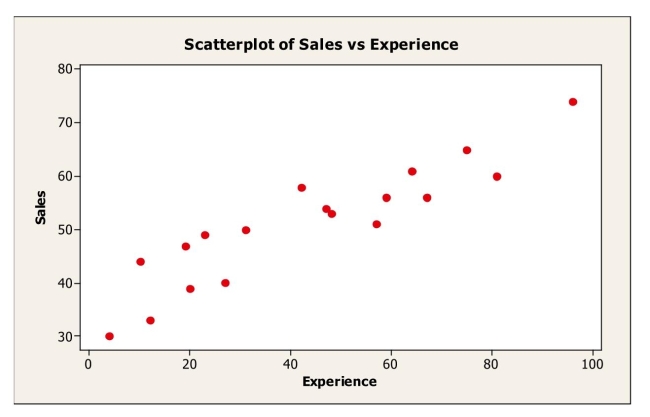
The association between monthly sales and level of experience can be described as
A)positive and weak.
B)negative and weak.
C)negative and strong.
D)positive and strong.
E)nonlinear.
The association between monthly sales and level of experience can be described as
A)positive and weak.
B)negative and weak.
C)negative and strong.
D)positive and strong.
E)nonlinear.
سؤال
A small independent organic food store offers a variety of specialty coffees.To determine whether price has an impact on sales, the managers kept track of how many
Pounds of each variety of coffee were sold last month.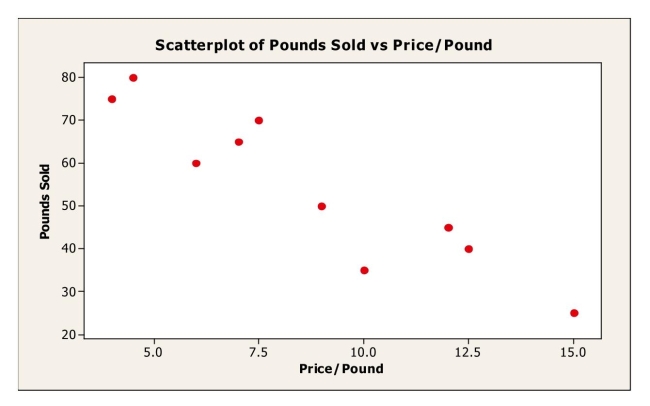 Based on the scatterplot, the linear relationship between number of pounds of coffee sold
Per week and price is
A)strong and positive.
B)strong and negative.
C)weak and negative.
D)weak and positive.
E)nonexistent.
Pounds of each variety of coffee were sold last month.
Based on the scatterplot, the linear relationship between number of pounds of coffee soldPer week and price is
A)strong and positive.
B)strong and negative.
C)weak and negative.
D)weak and positive.
E)nonexistent.
سؤال
سؤال
Shown below is a correlation table showing correlation coefficients between stock
price, earnings per share (EPS), and price/earnings (P/E) ratio for a sample of 19 publicly
traded companies.
Correlations: Stock Price, EPS, PE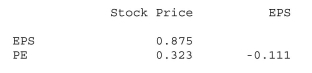 a.What is the correlation between stock price and EPS? Interpret.
b.What is the correlation between stock price and PE? Interpret.
c.What is the correlation between EPS and PE? Interpret.
price, earnings per share (EPS), and price/earnings (P/E) ratio for a sample of 19 publicly
traded companies.
Correlations: Stock Price, EPS, PE
a.What is the correlation between stock price and EPS? Interpret.b.What is the correlation between stock price and PE? Interpret.
c.What is the correlation between EPS and PE? Interpret.
سؤال
Data were collected on monthly sales revenues (in $1,000s) and monthly advertising expenditures ($100s) for a sample of drug stores.The regression line relating revenues
(Y) to advertising expenditure (X) is estimated to be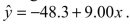 .The predicted
Sales revenue for a month in which $1,000 was spent on advertising is
A)$50,000.
B)$851.70.
C)$8,951.70.
D)$41,700.
E)$90,000.
(Y) to advertising expenditure (X) is estimated to be
.The predictedSales revenue for a month in which $1,000 was spent on advertising is
A)$50,000.
B)$851.70.
C)$8,951.70.
D)$41,700.
E)$90,000.
سؤال
سؤال
Use the following to answer questions
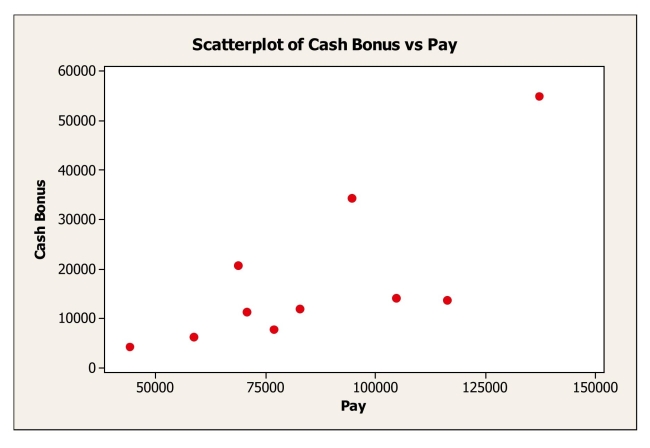
To determine whether the cash bonus paid by a company is related to annual pay, data
were gathered for 10 account executives at Johnson Financial Group who received cash
bonuses in 2007.The data, scatterplot, and summary statistics are shown below.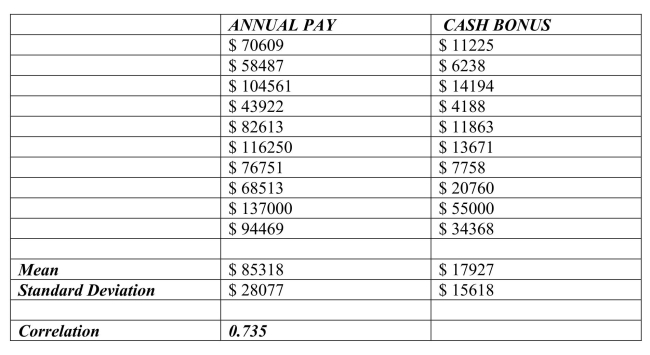
Using the estimated regression equation,
a.Estimate the cash bonus for an executive at Johnson Financial earning $82, 613 a year.
b.What is the residual for this estimate?
سؤال
A consumer research group examining the relationship between the price of meat (per pound) and fat content (in grams) gathered data that produced the following scatterplot. 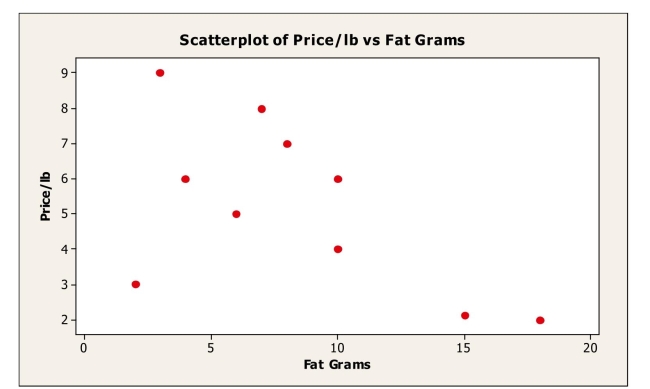 If the point in the lower left hand corner (2 grams of fat; $3.00 per pound) is removed, the
Correlation would most likely
A)remain the same.
B)become positive.
C)become weaker negative.
D)become stronger negative.
E)become zero.
If the point in the lower left hand corner (2 grams of fat; $3.00 per pound) is removed, theCorrelation would most likely
A)remain the same.
B)become positive.
C)become weaker negative.
D)become stronger negative.
E)become zero.
سؤال
Use the following to answer questions
To determine whether the cash bonus paid by a company is related to annual pay, data
were gathered for 10 account executives at Johnson Financial Group who received cash
bonuses in 2007.The data, scatterplot, and summary statistics are shown below.
Estimate the linear regression model that relates the response variable (cash bonus) to
the predictor variable (annual pay).
a.Find the slope of the regression line.
b.Find the intercept of the regression line.
c.Write the equation of the linear model.
سؤال
سؤال
Data were collected on monthly sales revenues (in $1,000s) and monthly advertising expenditures ($100s) for a sample of drug stores.The regression line relating revenues
(Y) to advertising expenditure (X) is estimated to be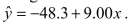 .The correct
Interpretation of the slope is that for each additional
A)$1 spent on advertising, predicted sales revenue increases by $9,000.
B)$100 spent on advertising, predicted sales revenue increases by $9,000.
C)$100 spent on advertising, predicted sales revenue decreases by $9,000.
D)$1,000 in sales revenue, advertising expenditures decrease by $48.30.
E)$100 in sales revenue, advertising expenditures decrease by $48.30.
(Y) to advertising expenditure (X) is estimated to be
.The correctInterpretation of the slope is that for each additional
A)$1 spent on advertising, predicted sales revenue increases by $9,000.
B)$100 spent on advertising, predicted sales revenue increases by $9,000.
C)$100 spent on advertising, predicted sales revenue decreases by $9,000.
D)$1,000 in sales revenue, advertising expenditures decrease by $48.30.
E)$100 in sales revenue, advertising expenditures decrease by $48.30.
سؤال
Use the following to answer questions
To determine whether the cash bonus paid by a company is related to annual pay, data
were gathered for 10 account executives at Johnson Financial Group who received cash
bonuses in 2007.The data, scatterplot, and summary statistics are shown below.
Comment on whether each of the following conditions for correlation / linear
regression is met.
a.Quantitative variable condition.
b.Linearity condition.
c.Outlier condition.
سؤال
سؤال
A small independent organic food store offers a variety of specialty coffees.To determine whether price has an impact on sales, the managers kept track of how many
Pounds of each variety of coffee were sold last month.Based on the scatterplot shown
Below, which of the following statements is true?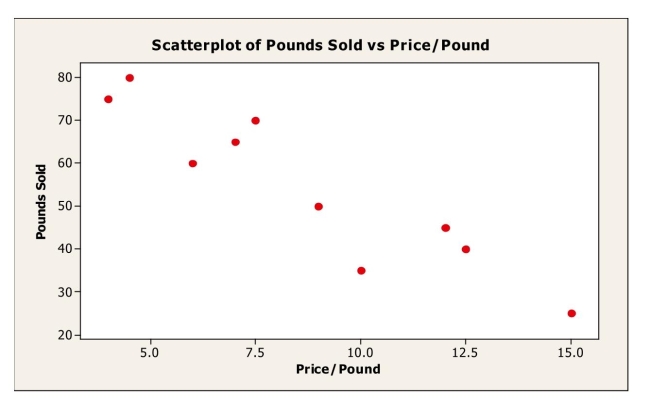
A)The quantitative variable condition is satisfied.
B)The linearity condition is satisfied.
C)There are no obvious outliers.
D)All of the above.
E)None of the above.
سؤال
A company studying the productivity of their employees on a new information system was interested in determining if the age (X) of data entry operators influenced the number
Of completed entries made per hour (Y).The regression equation is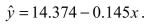 If
If 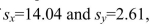 =2.61, then the correlation coefficient between age and productivity is
A).779
B)-.236
C).575
D)-.929
E)-.779
Of completed entries made per hour (Y).The regression equation is
If =2.61, then the correlation coefficient between age and productivity isA).779
B)-.236
C).575
D)-.929
E)-.779
سؤال
سؤال
Linear regression was used to describe the trend in world population over time. Below is a plot of the residuals versus predicted values.What does the plot of residuals
Suggest?
A)An outlier is present in the data set.
B)The linearity condition is not satisfied.
C)A high leverage point is present in the data set.
D)The data are not normal.
E)The equal spread condition is not satisfied.
Suggest?
A)An outlier is present in the data set.
B)The linearity condition is not satisfied.
C)A high leverage point is present in the data set.
D)The data are not normal.
E)The equal spread condition is not satisfied.
سؤال
سؤال
For the following scatterplot, 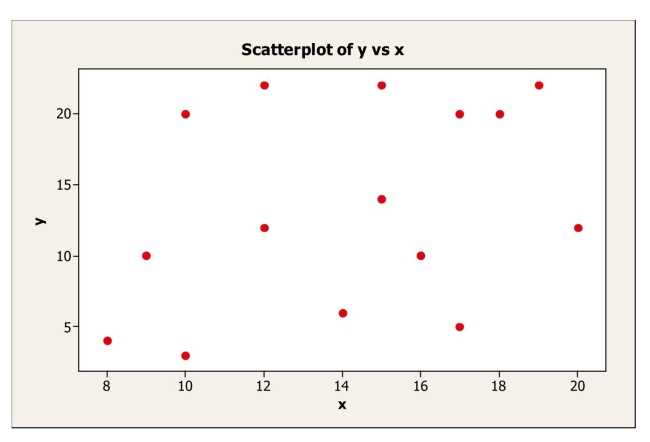
A)+0.35
B)+0.90
C)+0.77
D)-0.89
E)-1.00
A)+0.35
B)+0.90
C)+0.77
D)-0.89
E)-1.00
سؤال
Based on the following residual plot, which condition / assumption for linear regression is not satisfied? 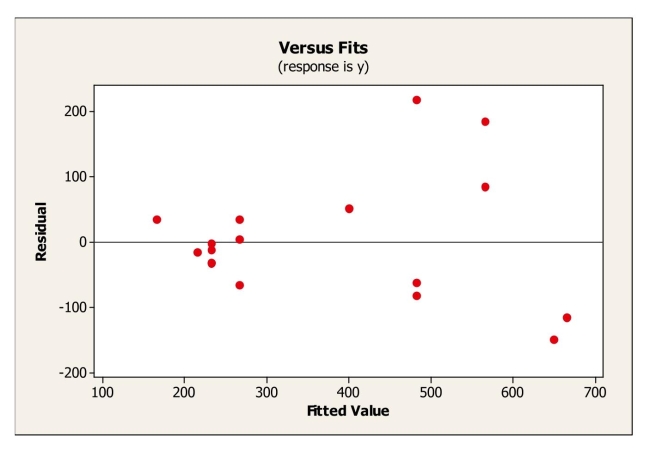
A)Linearity.
B)Quantitative Variables.
C)Equal Spread.
D)Outlier.
E)None of the above; all conditions are satisfied.
A)Linearity.
B)Quantitative Variables.
C)Equal Spread.
D)Outlier.
E)None of the above; all conditions are satisfied.

فتح الحزمة
قم بالتسجيل لفتح البطاقات في هذه المجموعة!
Unlock Deck
Unlock Deck
1/24
العب
ملء الشاشة (f)
Deck 6: Correlation and Linear Regression
1
The scatterplot shows monthly sales figures (in units) and number of months of experience for a sample of salespeople. The correlation between monthly sales and level of experience is most likely
A)-.235.
B)0.
C).180.
D)-.914.
E).914.
The correlation between monthly sales and level of experience is most likelyA)-.235.
B)0.
C).180.
D)-.914.
E).914.
E
2
The following scatterplot shows monthly sales figures (in units) and number of
months of experience on the job for a sample of 19 salespeople. a.Describe the association between monthly sales and level of experience.
b.Do these data satisfy the conditions for computing a correlation coefficient? Explain.
c.Estimate the correlation.
months of experience on the job for a sample of 19 salespeople.
a.Describe the association between monthly sales and level of experience.b.Do these data satisfy the conditions for computing a correlation coefficient? Explain.
c.Estimate the correlation.
a.Positive and strong.
b.Yes: variables are quantitative, the relationship is straight enough, and there are no
apparent outliers.
c..914 is the correlation; a value between .85 and .95 is acceptable.
b.Yes: variables are quantitative, the relationship is straight enough, and there are no
apparent outliers.
c..914 is the correlation; a value between .85 and .95 is acceptable.
3
A company studying the productivity of its employees on a new information system was interested in determining if the age (X) of data entry operators influenced the number
Of completed entries made per hour (Y).The regression equation is Suppose the actual completed entries per hour for an operator who is 35 years old was 8.
The residual is
A)-1.3
B)2.6
C)-3.5
D)1.3
E)-2.2
Of completed entries made per hour (Y).The regression equation is
Suppose the actual completed entries per hour for an operator who is 35 years old was 8.The residual is
A)-1.3
B)2.6
C)-3.5
D)1.3
E)-2.2
A
4
Shown below is a correlation table showing correlation coefficients between stock price, earnings per share (EPS) and price/earnings (P/E) ratio for a sample of 19
Publicly traded companies.Which of the following statements is false?
Correlations: Stock Price, EPS, PE
A)EPS is the best predictor of stock price.
B)The strongest correlation is between EPS and stock price.
C)There is a weak negative association between PE and EPS.
D)PE is the best predictor of stock price.
E)The weakest correlation is between PE and EPS.
Publicly traded companies.Which of the following statements is false?
Correlations: Stock Price, EPS, PE
A)EPS is the best predictor of stock price.
B)The strongest correlation is between EPS and stock price.
C)There is a weak negative association between PE and EPS.
D)PE is the best predictor of stock price.
E)The weakest correlation is between PE and EPS.
فتح الحزمة
افتح القفل للوصول البطاقات البالغ عددها 24 في هذه المجموعة.
فتح الحزمة
k this deck
5
The scatterplot shows monthly sales figures (in units) and number of months of experience for a sample of salespeople.
The association between monthly sales and level of experience can be described as
A)positive and weak.
B)negative and weak.
C)negative and strong.
D)positive and strong.
E)nonlinear.
The association between monthly sales and level of experience can be described as
A)positive and weak.
B)negative and weak.
C)negative and strong.
D)positive and strong.
E)nonlinear.
فتح الحزمة
افتح القفل للوصول البطاقات البالغ عددها 24 في هذه المجموعة.
فتح الحزمة
k this deck
6
A small independent organic food store offers a variety of specialty coffees.To determine whether price has an impact on sales, the managers kept track of how many
Pounds of each variety of coffee were sold last month. Based on the scatterplot, the linear relationship between number of pounds of coffee sold
Per week and price is
A)strong and positive.
B)strong and negative.
C)weak and negative.
D)weak and positive.
E)nonexistent.
Pounds of each variety of coffee were sold last month.
Based on the scatterplot, the linear relationship between number of pounds of coffee soldPer week and price is
A)strong and positive.
B)strong and negative.
C)weak and negative.
D)weak and positive.
E)nonexistent.
فتح الحزمة
افتح القفل للوصول البطاقات البالغ عددها 24 في هذه المجموعة.
فتح الحزمة
k this deck
7
A study examined consumption levels of oil and carbon dioxide emissions for sample of counties.The response variable in this study is
A)oil.
B)oil consumption.
C)carbon dioxide emissions.
D)countries.
E)none of the above.
A)oil.
B)oil consumption.
C)carbon dioxide emissions.
D)countries.
E)none of the above.
فتح الحزمة
افتح القفل للوصول البطاقات البالغ عددها 24 في هذه المجموعة.
فتح الحزمة
k this deck
8
Shown below is a correlation table showing correlation coefficients between stock
price, earnings per share (EPS), and price/earnings (P/E) ratio for a sample of 19 publicly
traded companies.
Correlations: Stock Price, EPS, PE a.What is the correlation between stock price and EPS? Interpret.
b.What is the correlation between stock price and PE? Interpret.
c.What is the correlation between EPS and PE? Interpret.
price, earnings per share (EPS), and price/earnings (P/E) ratio for a sample of 19 publicly
traded companies.
Correlations: Stock Price, EPS, PE
a.What is the correlation between stock price and EPS? Interpret.b.What is the correlation between stock price and PE? Interpret.
c.What is the correlation between EPS and PE? Interpret.
فتح الحزمة
افتح القفل للوصول البطاقات البالغ عددها 24 في هذه المجموعة.
فتح الحزمة
k this deck
9
Data were collected on monthly sales revenues (in $1,000s) and monthly advertising expenditures ($100s) for a sample of drug stores.The regression line relating revenues
(Y) to advertising expenditure (X) is estimated to be .The predicted
Sales revenue for a month in which $1,000 was spent on advertising is
A)$50,000.
B)$851.70.
C)$8,951.70.
D)$41,700.
E)$90,000.
(Y) to advertising expenditure (X) is estimated to be
.The predictedSales revenue for a month in which $1,000 was spent on advertising is
A)$50,000.
B)$851.70.
C)$8,951.70.
D)$41,700.
E)$90,000.
فتح الحزمة
افتح القفل للوصول البطاقات البالغ عددها 24 في هذه المجموعة.
فتح الحزمة
k this deck
10
A supermarket chain gathers data on the amount they spend on promotional material (e.g., coupons, etc.) and sales revenue generated each quarter.The predictor variable is
A)sales revenue.
B)amount spent on promotional material.
C)number of coupons offered.
D)supermarket chains.
E)none of the above.
A)sales revenue.
B)amount spent on promotional material.
C)number of coupons offered.
D)supermarket chains.
E)none of the above.
فتح الحزمة
افتح القفل للوصول البطاقات البالغ عددها 24 في هذه المجموعة.
فتح الحزمة
k this deck
11
Use the following to answer questions
To determine whether the cash bonus paid by a company is related to annual pay, data
were gathered for 10 account executives at Johnson Financial Group who received cash
bonuses in 2007.The data, scatterplot, and summary statistics are shown below.
Using the estimated regression equation,
a.Estimate the cash bonus for an executive at Johnson Financial earning $82, 613 a year.
b.What is the residual for this estimate?
فتح الحزمة
افتح القفل للوصول البطاقات البالغ عددها 24 في هذه المجموعة.
فتح الحزمة
k this deck
12
A consumer research group examining the relationship between the price of meat (per pound) and fat content (in grams) gathered data that produced the following scatterplot. If the point in the lower left hand corner (2 grams of fat; $3.00 per pound) is removed, the
Correlation would most likely
A)remain the same.
B)become positive.
C)become weaker negative.
D)become stronger negative.
E)become zero.
If the point in the lower left hand corner (2 grams of fat; $3.00 per pound) is removed, theCorrelation would most likely
A)remain the same.
B)become positive.
C)become weaker negative.
D)become stronger negative.
E)become zero.
فتح الحزمة
افتح القفل للوصول البطاقات البالغ عددها 24 في هذه المجموعة.
فتح الحزمة
k this deck
13
Use the following to answer questions
To determine whether the cash bonus paid by a company is related to annual pay, data
were gathered for 10 account executives at Johnson Financial Group who received cash
bonuses in 2007.The data, scatterplot, and summary statistics are shown below.
Estimate the linear regression model that relates the response variable (cash bonus) to
the predictor variable (annual pay).
a.Find the slope of the regression line.
b.Find the intercept of the regression line.
c.Write the equation of the linear model.
فتح الحزمة
افتح القفل للوصول البطاقات البالغ عددها 24 في هذه المجموعة.
فتح الحزمة
k this deck
14
For each of the following scenarios indicate which is the predictor variable and which
is the response variable.
a.A study examined consumption levels of oil and carbon dioxide emissions for a sample
of counties.
b.Data were collected on job performance rating and hours of training for a sample of
employees at a telecommunications repair facility.
c.Salary data as well as years of managerial experience were collected for a sample of
executives in the high tech industry.
فتح الحزمة
افتح القفل للوصول البطاقات البالغ عددها 24 في هذه المجموعة.
فتح الحزمة
k this deck
15
Data were collected on monthly sales revenues (in $1,000s) and monthly advertising expenditures ($100s) for a sample of drug stores.The regression line relating revenues
(Y) to advertising expenditure (X) is estimated to be .The correct
Interpretation of the slope is that for each additional
A)$1 spent on advertising, predicted sales revenue increases by $9,000.
B)$100 spent on advertising, predicted sales revenue increases by $9,000.
C)$100 spent on advertising, predicted sales revenue decreases by $9,000.
D)$1,000 in sales revenue, advertising expenditures decrease by $48.30.
E)$100 in sales revenue, advertising expenditures decrease by $48.30.
(Y) to advertising expenditure (X) is estimated to be
.The correctInterpretation of the slope is that for each additional
A)$1 spent on advertising, predicted sales revenue increases by $9,000.
B)$100 spent on advertising, predicted sales revenue increases by $9,000.
C)$100 spent on advertising, predicted sales revenue decreases by $9,000.
D)$1,000 in sales revenue, advertising expenditures decrease by $48.30.
E)$100 in sales revenue, advertising expenditures decrease by $48.30.
فتح الحزمة
افتح القفل للوصول البطاقات البالغ عددها 24 في هذه المجموعة.
فتح الحزمة
k this deck
16
Use the following to answer questions
To determine whether the cash bonus paid by a company is related to annual pay, data
were gathered for 10 account executives at Johnson Financial Group who received cash
bonuses in 2007.The data, scatterplot, and summary statistics are shown below.
Comment on whether each of the following conditions for correlation / linear
regression is met.
a.Quantitative variable condition.
b.Linearity condition.
c.Outlier condition.
فتح الحزمة
افتح القفل للوصول البطاقات البالغ عددها 24 في هذه المجموعة.
فتح الحزمة
k this deck
17
In discussing how its customers use online services, a bank manager noted "there
seems to be a strong correlation between the use of the online bill paying feature and
gender." Comment on this statement.
seems to be a strong correlation between the use of the online bill paying feature and
gender." Comment on this statement.
فتح الحزمة
افتح القفل للوصول البطاقات البالغ عددها 24 في هذه المجموعة.
فتح الحزمة
k this deck
18
A small independent organic food store offers a variety of specialty coffees.To determine whether price has an impact on sales, the managers kept track of how many
Pounds of each variety of coffee were sold last month.Based on the scatterplot shown
Below, which of the following statements is true?
A)The quantitative variable condition is satisfied.
B)The linearity condition is satisfied.
C)There are no obvious outliers.
D)All of the above.
E)None of the above.
فتح الحزمة
افتح القفل للوصول البطاقات البالغ عددها 24 في هذه المجموعة.
فتح الحزمة
k this deck
19
A company studying the productivity of their employees on a new information system was interested in determining if the age (X) of data entry operators influenced the number
Of completed entries made per hour (Y).The regression equation is If =2.61, then the correlation coefficient between age and productivity is
A).779
B)-.236
C).575
D)-.929
E)-.779
Of completed entries made per hour (Y).The regression equation is
If =2.61, then the correlation coefficient between age and productivity isA).779
B)-.236
C).575
D)-.929
E)-.779
فتح الحزمة
افتح القفل للوصول البطاقات البالغ عددها 24 في هذه المجموعة.
فتح الحزمة
k this deck
20
Suppose the correlation, r, between two variables x and y is -0.44.What would you predict about a y value if the x value is 2 standard deviations above its mean?
A)It will be .88 standard deviations below its mean.
B)It will be .88 standard deviations above its mean.
C)It will be 2 standard deviations below its mean.
D)It will be .44 standard deviations below its mean.
E)It will be .44 standard deviations above its mean.
A)It will be .88 standard deviations below its mean.
B)It will be .88 standard deviations above its mean.
C)It will be 2 standard deviations below its mean.
D)It will be .44 standard deviations below its mean.
E)It will be .44 standard deviations above its mean.
فتح الحزمة
افتح القفل للوصول البطاقات البالغ عددها 24 في هذه المجموعة.
فتح الحزمة
k this deck
21
Linear regression was used to describe the trend in world population over time. Below is a plot of the residuals versus predicted values.What does the plot of residuals
Suggest?
A)An outlier is present in the data set.
B)The linearity condition is not satisfied.
C)A high leverage point is present in the data set.
D)The data are not normal.
E)The equal spread condition is not satisfied.
Suggest?
A)An outlier is present in the data set.
B)The linearity condition is not satisfied.
C)A high leverage point is present in the data set.
D)The data are not normal.
E)The equal spread condition is not satisfied.
فتح الحزمة
افتح القفل للوصول البطاقات البالغ عددها 24 في هذه المجموعة.
فتح الحزمة
k this deck
22
Suppose the correlation, r, between two variables x and y is -0.44.What percentage of the variability in y cannot be explained by x?
A)19%
B)44%
C)81%
D)88%
E)12%
A)19%
B)44%
C)81%
D)88%
E)12%
فتح الحزمة
افتح القفل للوصول البطاقات البالغ عددها 24 في هذه المجموعة.
فتح الحزمة
k this deck
23
For the following scatterplot,
A)+0.35
B)+0.90
C)+0.77
D)-0.89
E)-1.00
A)+0.35
B)+0.90
C)+0.77
D)-0.89
E)-1.00
فتح الحزمة
افتح القفل للوصول البطاقات البالغ عددها 24 في هذه المجموعة.
فتح الحزمة
k this deck
24
Based on the following residual plot, which condition / assumption for linear regression is not satisfied?
A)Linearity.
B)Quantitative Variables.
C)Equal Spread.
D)Outlier.
E)None of the above; all conditions are satisfied.
A)Linearity.
B)Quantitative Variables.
C)Equal Spread.
D)Outlier.
E)None of the above; all conditions are satisfied.
فتح الحزمة
افتح القفل للوصول البطاقات البالغ عددها 24 في هذه المجموعة.
فتح الحزمة
k this deck
فتح الحزمة
افتح القفل للوصول البطاقات البالغ عددها 24 في هذه المجموعة.


