Deck 26: Multifactor Analysis of Variance
ملء الشاشة (f)
سؤال
a.Write the hypotheses tested by the Detergent F-ratio.Test the hypotheses and explain
b.Write the hypotheses tested by the Temp F-ratio.Test the
سؤال
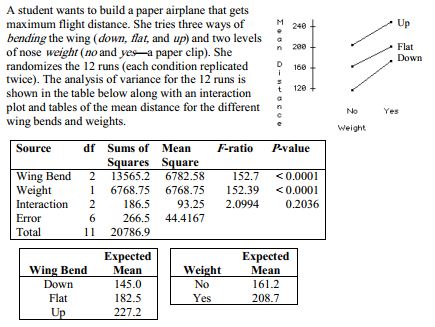
For a class project, students tested four different brands of laundry detergent (1, 2, 3, 4) in
three different water temperatures (hot, warm, cold) to see whether there were any
differences in how well the detergents could clean clothes.The students took 36 identical
pieces of cloth and made them dirty by staining them with coffee, dirt, and grass.The 36
pieces were randomly assigned to the 12 combinations of detergent and temperature so
that each combination had 3 replicates.After washing, the students rated how clean the
clothes were from 0 (no change) to 20 (completely spotless).The two factor ANOVA
table is shown below along with an interaction plot and residual plots.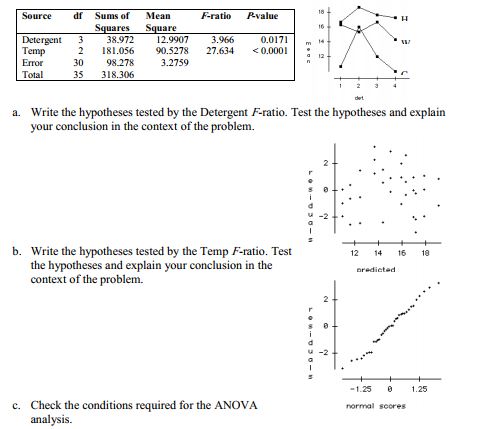

فتح الحزمة
قم بالتسجيل لفتح البطاقات في هذه المجموعة!
Unlock Deck
Unlock Deck
1/2
العب
ملء الشاشة (f)
Deck 26: Multifactor Analysis of Variance
a.Write the hypotheses tested by the Detergent F-ratio.Test the hypotheses and explain
b.Write the hypotheses tested by the Temp F-ratio.Test the
For a class project, students tested four different brands of laundry detergent (1, 2, 3, 4) in
three different water temperatures (hot, warm, cold) to see whether there were any
differences in how well the detergents could clean clothes.The students took 36 identical
pieces of cloth and made them dirty by staining them with coffee, dirt, and grass.The 36
pieces were randomly assigned to the 12 combinations of detergent and temperature so
that each combination had 3 replicates.After washing, the students rated how clean the
clothes were from 0 (no change) to 20 (completely spotless).The two factor ANOVA
table is shown below along with an interaction plot and residual plots.
three different water temperatures (hot, warm, cold) to see whether there were any
differences in how well the detergents could clean clothes.The students took 36 identical
pieces of cloth and made them dirty by staining them with coffee, dirt, and grass.The 36
pieces were randomly assigned to the 12 combinations of detergent and temperature so
that each combination had 3 replicates.After washing, the students rated how clean the
clothes were from 0 (no change) to 20 (completely spotless).The two factor ANOVA
table is shown below along with an interaction plot and residual plots.
For a class project, students tested four different brands of laundry detergent (1, 2, 3, 4)
in three different water temperatures (hot, warm, cold) to see whether there were any
differences in how well the detergents could clean clothes. The students took 36 identical
pieces of cloth and made them dirty by staining them with coffee, dirt, and grass. The 36
pieces were randomly assigned to the 12 combinations of detergent and temperature so
that each combination had 3 replicates. After washing, the students rated how clean the
clothes were from 0 (no change) to 20 (completely spotless). The two factor ANOVA
table is shown below along with an interaction plot and residual plots.
table is shown below along with an interaction plot and residual plots.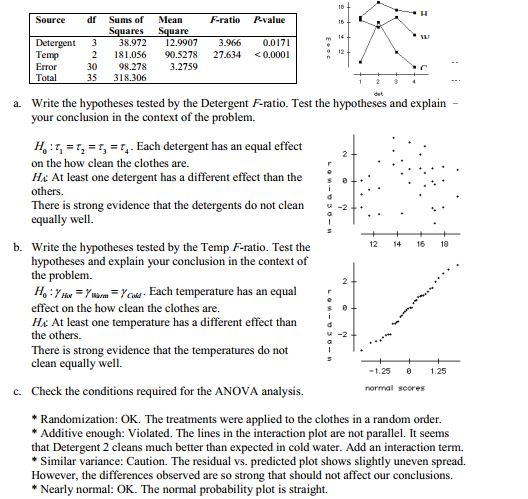
فتح الحزمة
افتح القفل للوصول البطاقات البالغ عددها 2 في هذه المجموعة.


