Deck 4: Describing the Relation Between Two Variables
ملء الشاشة (f)
سؤال
Write the word or phrase that best completes each statement or answers the question.
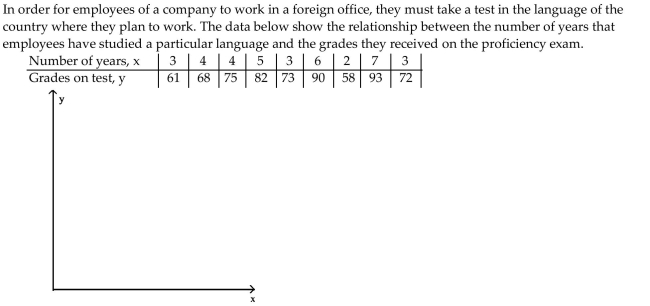
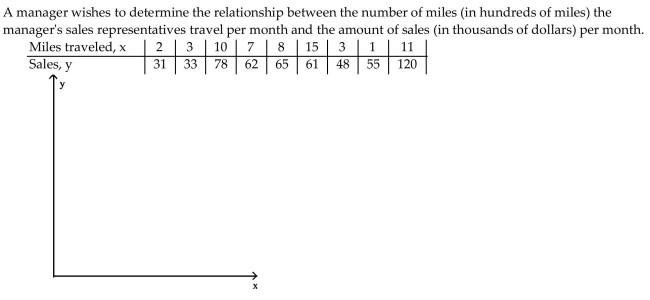
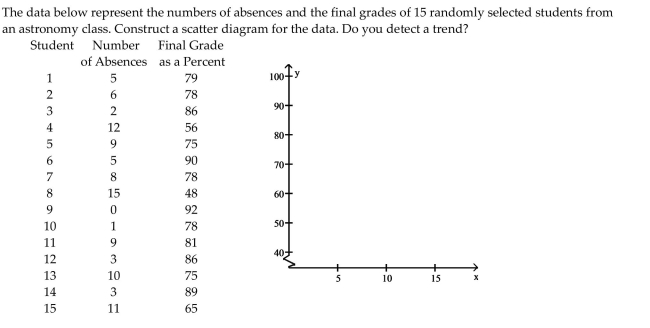
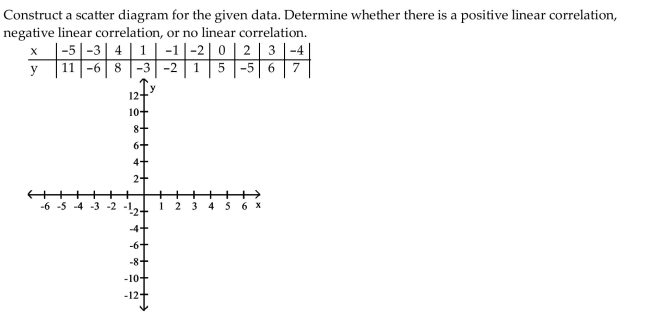
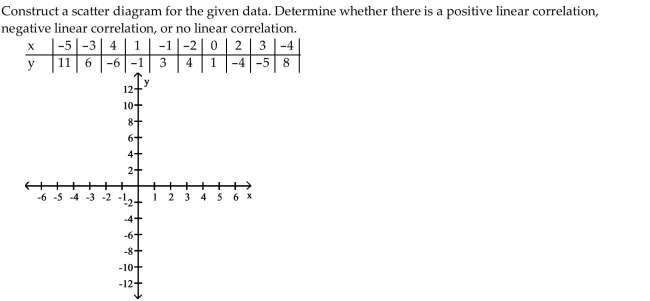
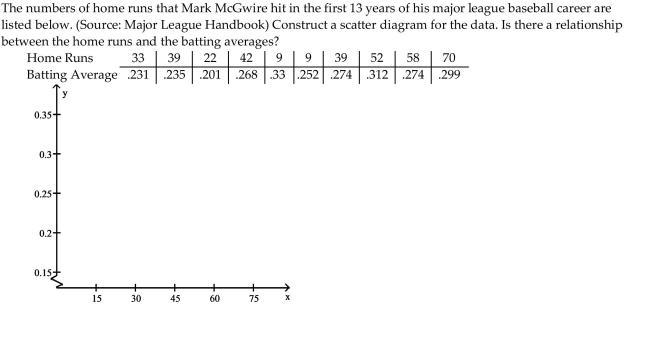
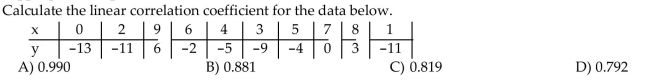
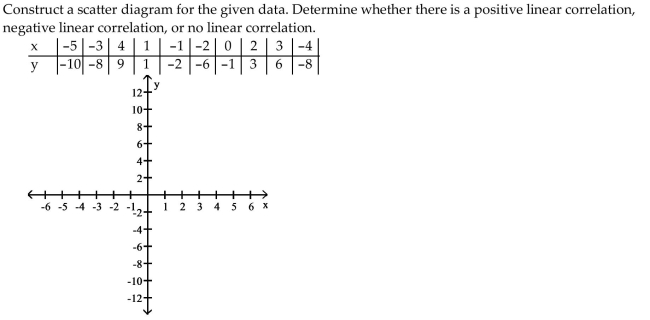
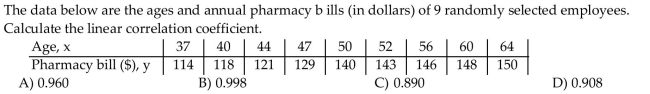
Construct a scatter diagram for the data.
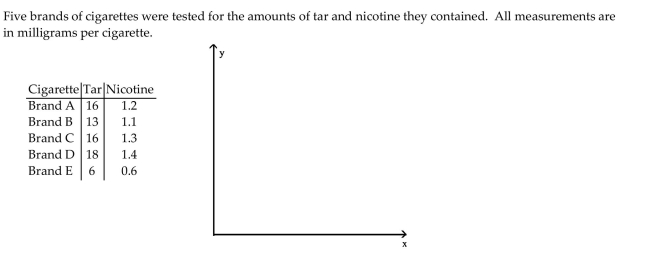
Construct a scatter diagram for the data.
سؤال
Choose the one alternative that best completes the statement or answers the question.
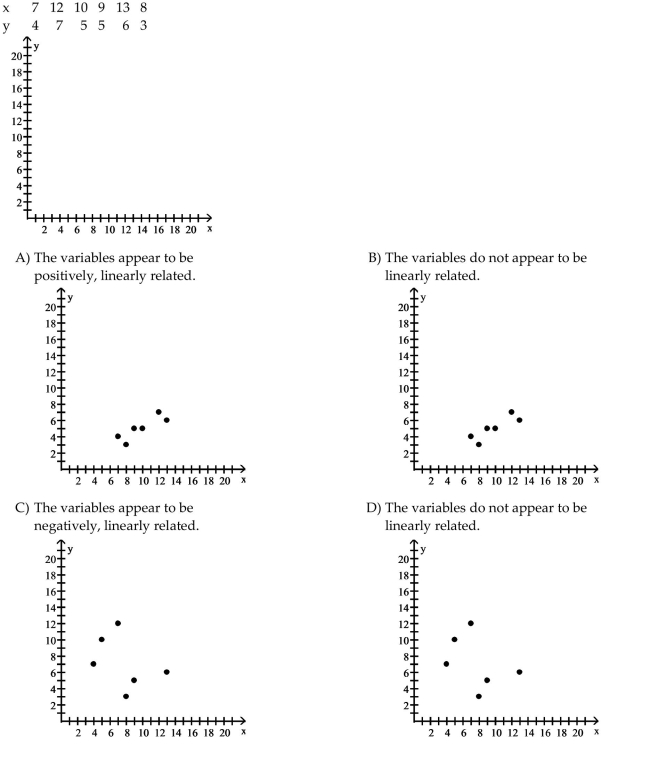
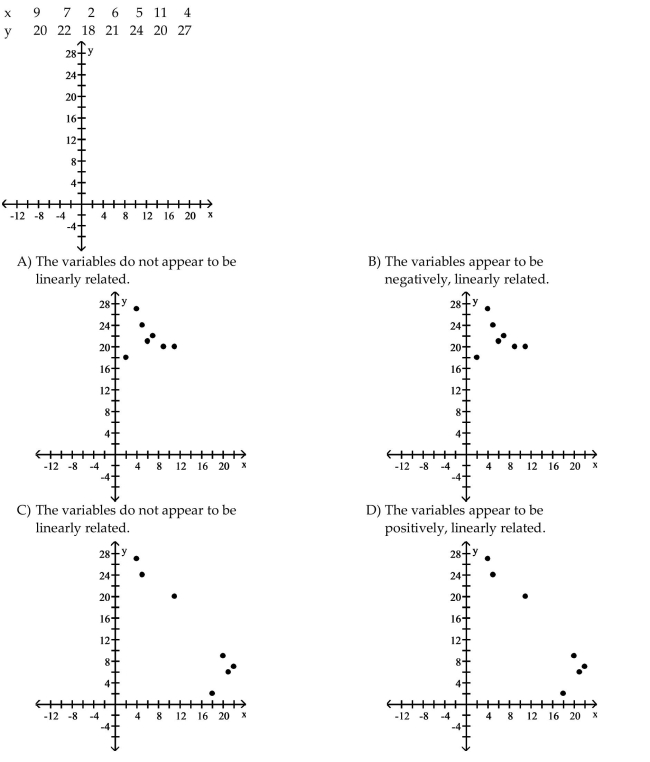
Make a scatter diagram for the data. Use the scatter diagram to describe how, if at all, the variables are related.
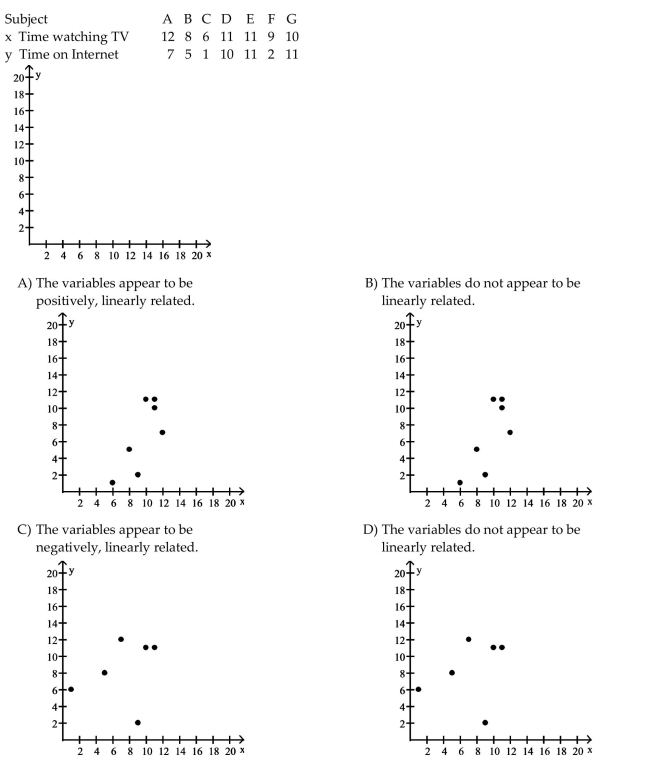
Make a scatter diagram for the data. Use the scatter diagram to describe how, if at all, the variables are related.
سؤال
The scatter diagram shows the relationship between average number of years of education and births per woman ofchild bearing age in selected countries. Use the scatter plot to determine whether the statement is true or false.
There is a strong positive correlation between years of education and births per woman.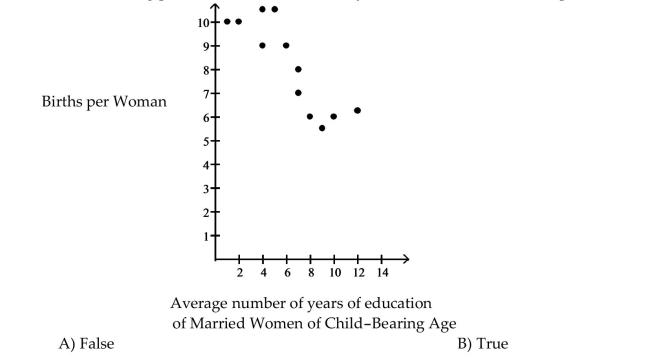
There is a strong positive correlation between years of education and births per woman.
سؤال
Write the word or phrase that best completes each statement or answers the question.
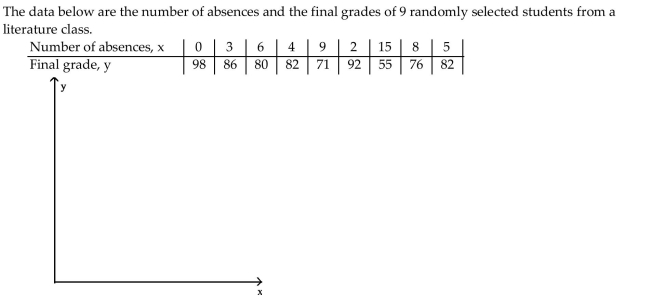
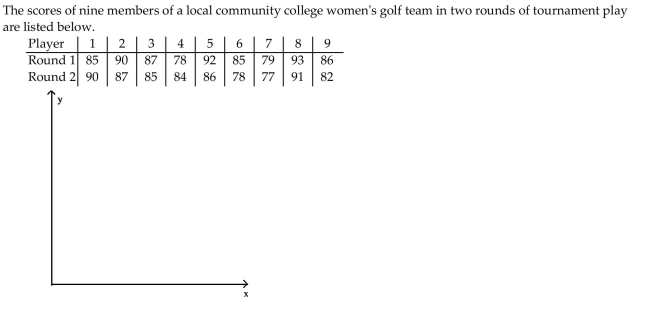
Construct a scatter diagram for the data.
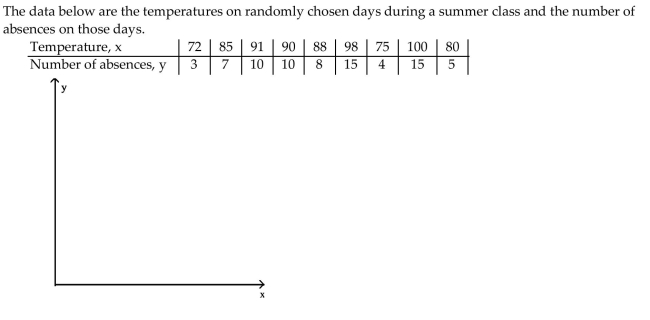
Construct a scatter diagram for the data.
سؤال
Write the word or phrase that best completes each statement or answers the question.
Construct a scatter diagram for the data.
Construct a scatter diagram for the data.
سؤال
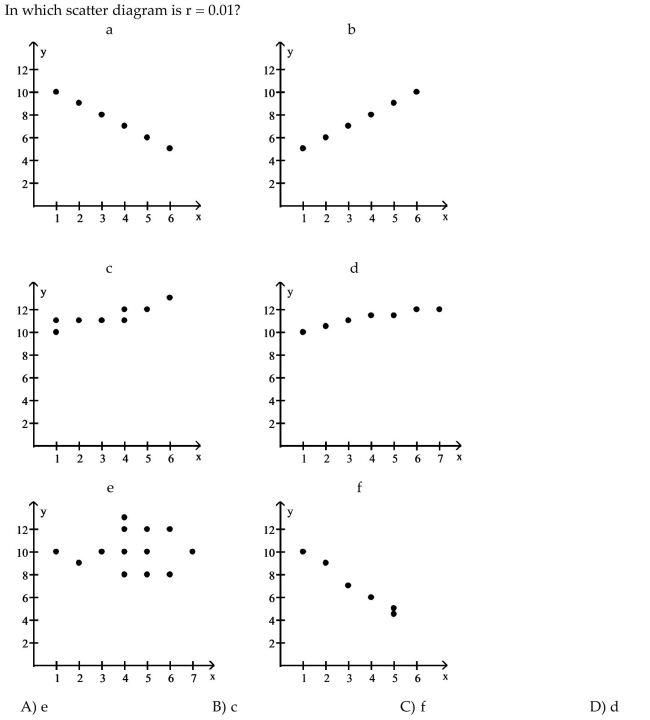
Use the scatter diagrams shown, labeled a through f to solve the problem.
In which scatter diagram is r = 1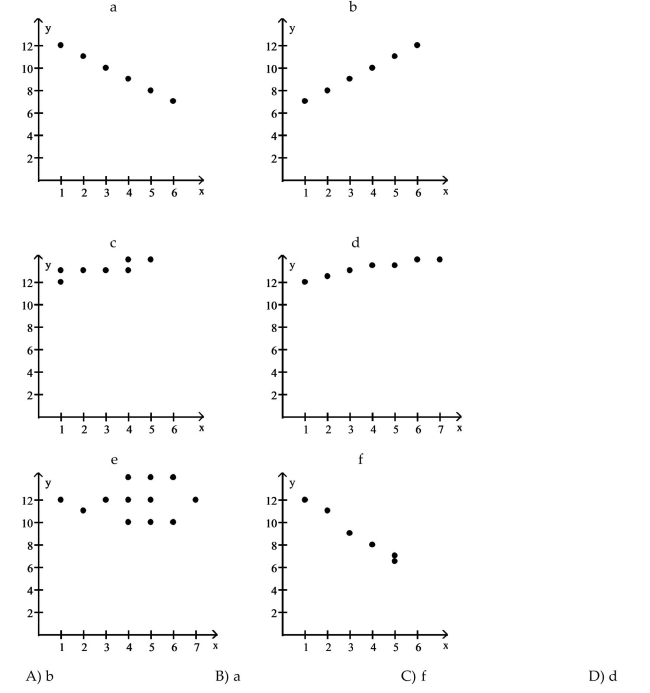
In which scatter diagram is r = 1
سؤال
Write the word or phrase that best completes each statement or answers the question.
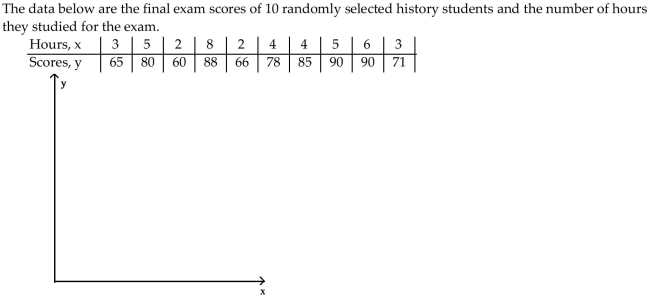
Construct a scatter diagram for the data.
Construct a scatter diagram for the data.
سؤال
Choose the one alternative that best completes the statement or answers the question.
Make a scatter diagram for the data. Use the scatter diagram to describe how, if at all, the variables are related.
Make a scatter diagram for the data. Use the scatter diagram to describe how, if at all, the variables are related.
سؤال
Write the word or phrase that best completes each statement or answers the question.
Construct a scatter diagram for the data.
Construct a scatter diagram for the data.
سؤال
Write the word or phrase that best completes each statement or answers the question.
Construct a scatter diagram for the data.
Construct a scatter diagram for the data.
سؤال
Use the scatter diagrams shown, labeled a through f to solve the problem.
سؤال
Write the word or phrase that best completes each statement or answers the question.
Construct a scatter diagram for the data.
Construct a scatter diagram for the data.
سؤال
The scatter diagram shows the relationship between average number of years of education and births per woman ofchild bearing age in selected countries. Use the scatter plot to determine whether the statement is true or false.
There is no correlation between years of education and births per woman.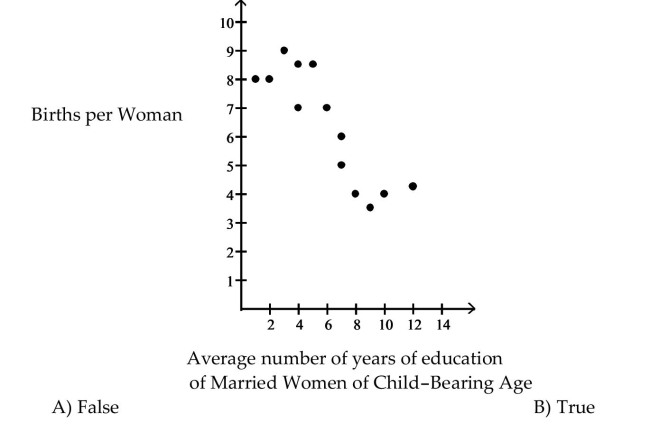
There is no correlation between years of education and births per woman.
سؤال
سؤال
Write the word or phrase that best completes each statement or answers the question.
Construct a scatter diagram for the data.
Construct a scatter diagram for the data.
سؤال
Write the word or phrase that best completes each statement or answers the question.
Construct a scatter diagram for the data.
Construct a scatter diagram for the data.
سؤال
سؤال
سؤال
Use the scatter diagrams shown, labeled a through f to solve the problem.
In which scatter diagram is r = -1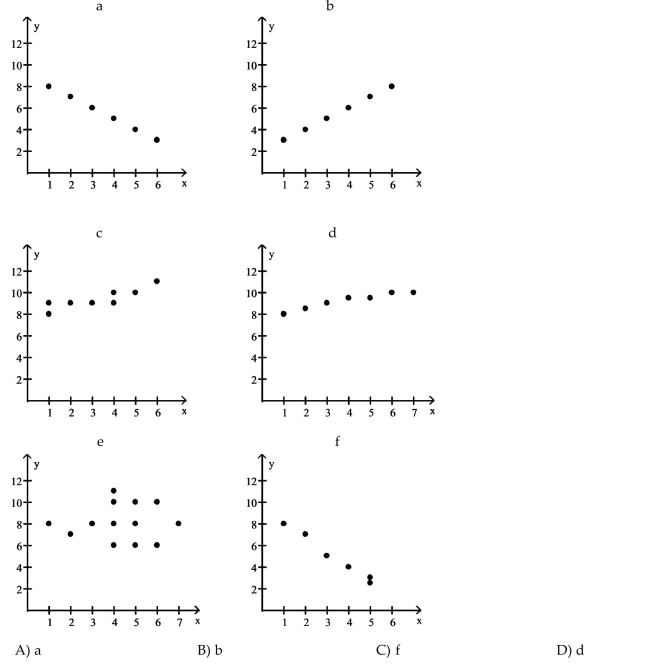
In which scatter diagram is r = -1
سؤال
Choose the one alternative that best completes the statement or answers the question.
Make a scatter diagram for the data. Use the scatter diagram to describe how, if at all, the variables are related.
Make a scatter diagram for the data. Use the scatter diagram to describe how, if at all, the variables are related.
سؤال
Write the word or phrase that best completes each statement or answers the question.
Provide an appropriate response.
Provide an appropriate response.
سؤال
سؤال
سؤال
سؤال
سؤال
Provide an appropriate response.
سؤال
Write the word or phrase that best completes each statement or answers the question.
Provide an appropriate response.
Provide an appropriate response.
سؤال
Provide an appropriate response.
سؤال
Provide an appropriate response.
سؤال
The scatter diagram shows the relationship between average number of years of education and births per woman ofchild bearing age in selected countries. Use the scatter plot to determine whether the statement is true or false.
There is a strong negative correlation between years of education and births per woman.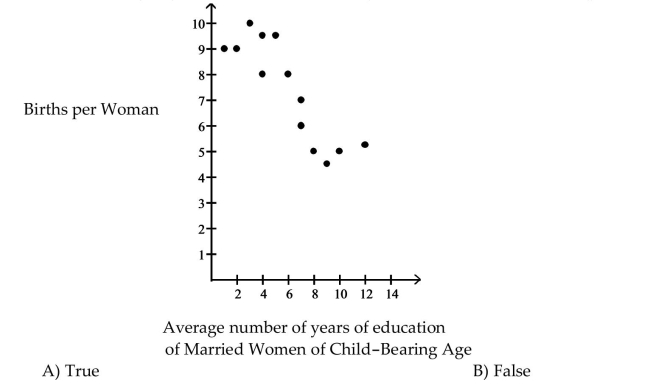
There is a strong negative correlation between years of education and births per woman.
سؤال
Choose the one alternative that best completes the statement or answers the question.
Use the scatter diagrams shown, labeled a through f to solve the problem.
Which scatter diagram indicates a perfect positive correlation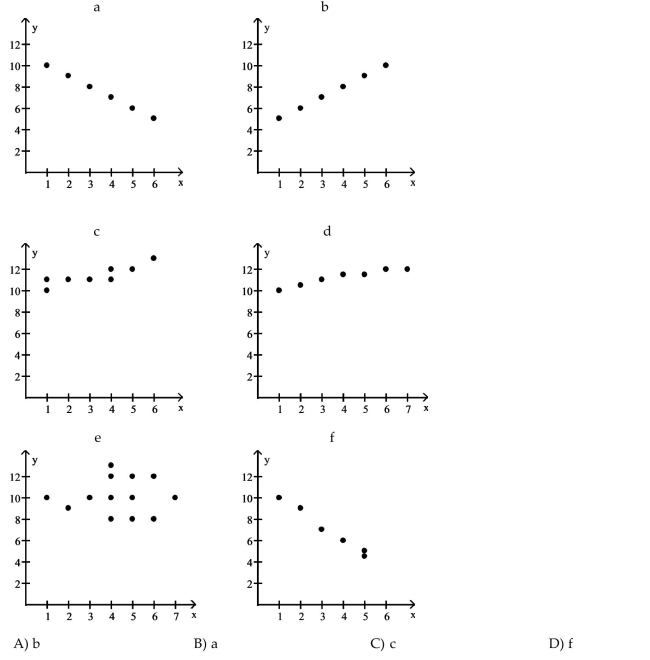
Use the scatter diagrams shown, labeled a through f to solve the problem.
Which scatter diagram indicates a perfect positive correlation
سؤال
سؤال
Write the word or phrase that best completes each statement or answers the question.
Provide an appropriate response.
Provide an appropriate response.
سؤال
Provide an appropriate response.
سؤال
The scatter diagram shows the relationship between average number of years of education and births per woman ofchild bearing age in selected countries. Use the scatter plot to determine whether the statement is true or false.
There is a causal relationship between years of education and births per woman.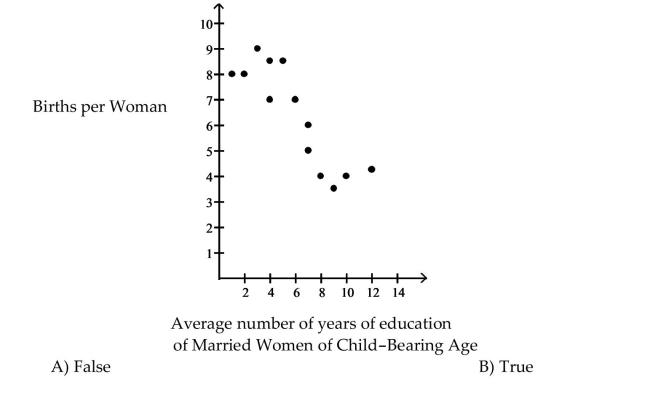
There is a causal relationship between years of education and births per woman.
سؤال
Write the word or phrase that best completes each statement or answers the question.
Provide an appropriate response.
Provide an appropriate response.
سؤال
سؤال
Provide an appropriate response.
سؤال
سؤال
Write the word or phrase that best completes each statement or answers the question.
Provide an appropriate response.
Provide an appropriate response.
سؤال
سؤال
سؤال
Provide an appropriate response.
سؤال
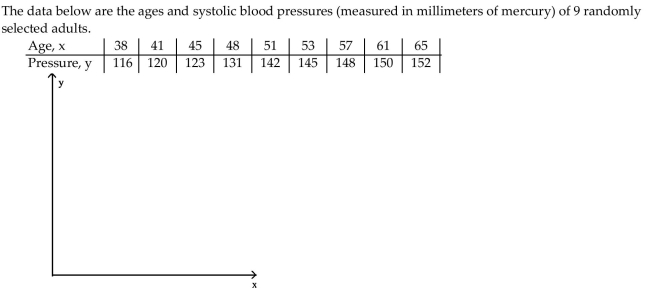
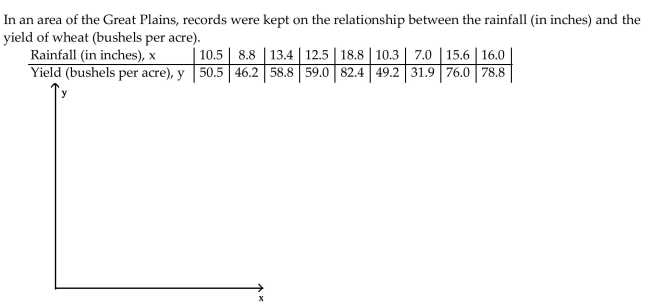
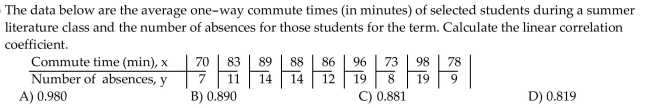
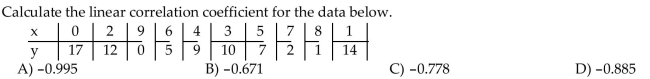
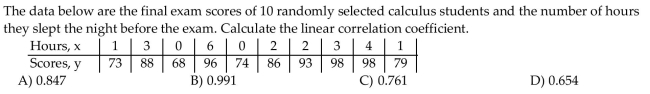
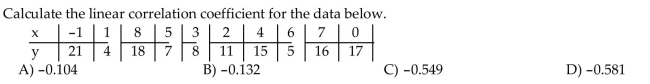
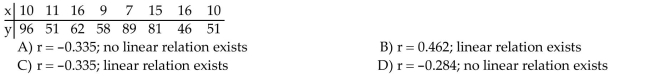
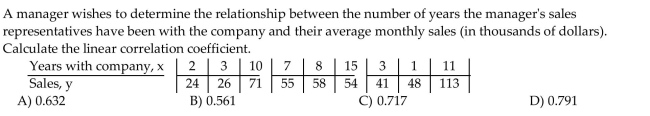
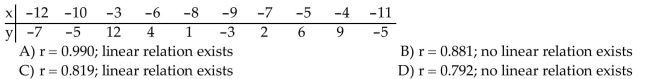
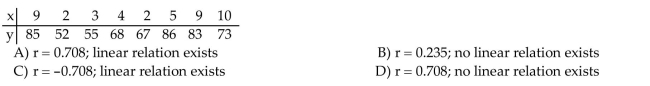
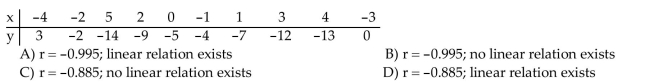
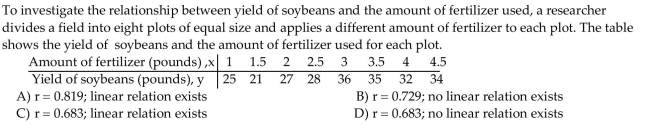
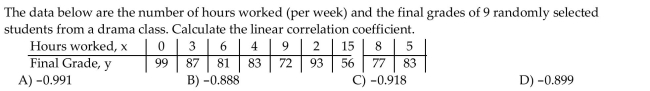
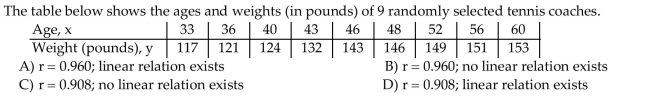
Compute the linear correlation coefficient between the two variables and determine whether a linear relation exists.
سؤال
Provide an appropriate response.
سؤال
Provide an appropriate response.
سؤال
سؤال
Write the word or phrase that best completes each statement or answers the question.
سؤال
سؤال
Compute the linear correlation coefficient between the two variables and determine whether a linear relation exists.
سؤال
Provide an appropriate response.
سؤال
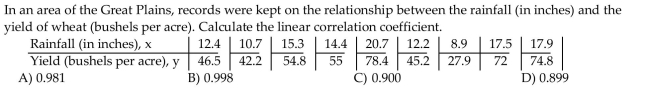
Compute the linear correlation coefficient between the two variables and determine whether a linear relation exists.
سؤال
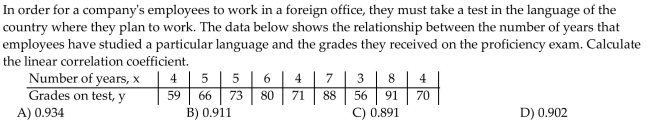
Compute the linear correlation coefficient between the two variables and determine whether a linear relation exists.
سؤال
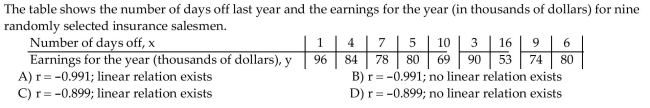
Compute the linear correlation coefficient between the two variables and determine whether a linear relation exists.
سؤال
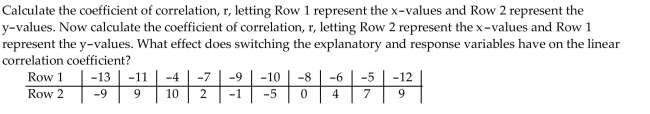
Compute the linear correlation coefficient between the two variables and determine whether a linear relation exists.
سؤال
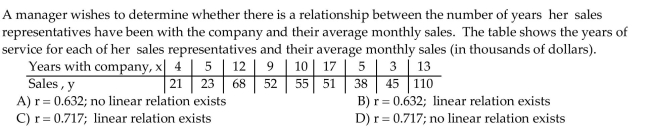
Compute the linear correlation coefficient between the two variables and determine whether a linear relation exists.
سؤال
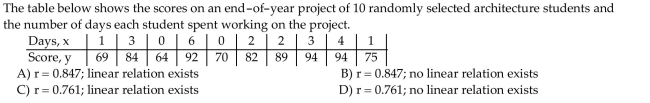
Compute the linear correlation coefficient between the two variables and determine whether a linear relation exists.
سؤال
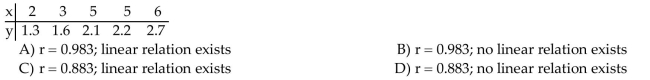
Compute the linear correlation coefficient between the two variables and determine whether a linear relation exists.
سؤال
Provide an appropriate response.
سؤال
Compute the linear correlation coefficient between the two variables and determine whether a linear relation exists.
سؤال
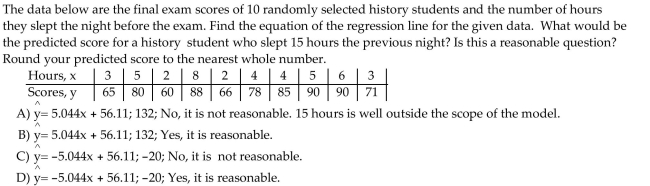
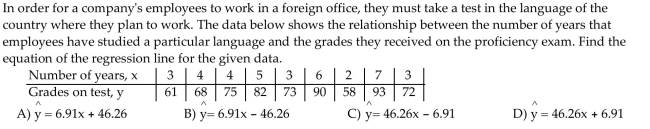
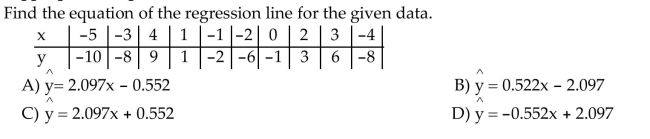
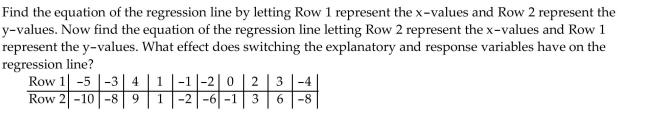
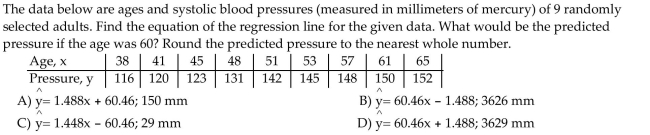
Find the Least-Squares Regression Line and Use the Line to Make Predictions
سؤال
Find the Least-Squares Regression Line and Use the Line to Make Predictions
سؤال
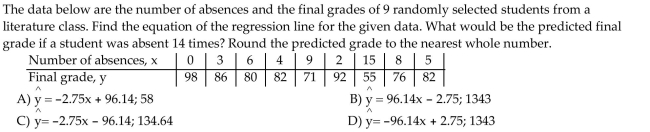
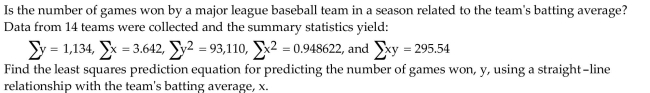
Find the Least-Squares Regression Line and Use the Line to Make Predictions
سؤال
سؤال
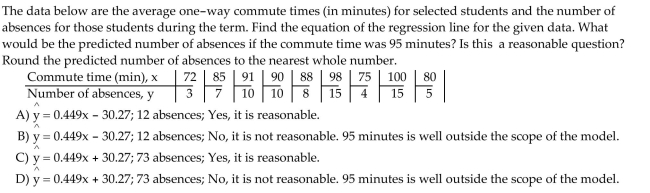
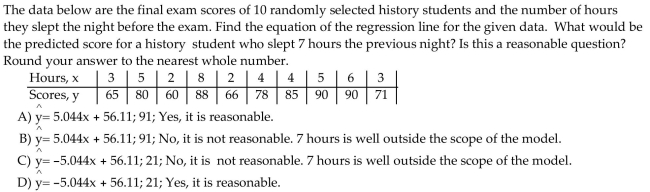
Find the Least-Squares Regression Line and Use the Line to Make Predictions
سؤال
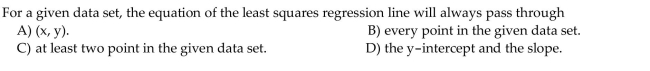
Interpret the Slope and the y-intercept of the Least-Squares Regression Line
سؤال
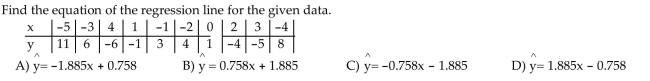
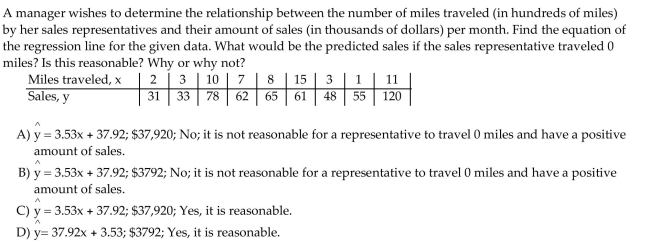
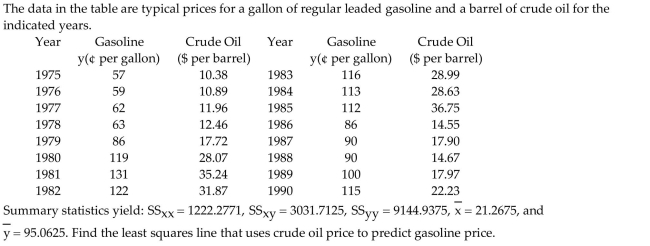
Find the Least-Squares Regression Line and Use the Line to Make Predictions
سؤال
Find the Least-Squares Regression Line and Use the Line to Make Predictions
سؤال
Find the Least-Squares Regression Line and Use the Line to Make Predictions
سؤال
Find the Least-Squares Regression Line and Use the Line to Make Predictions
سؤال
Find the Least-Squares Regression Line and Use the Line to Make Predictions
سؤال
سؤال
Choose the one alternative that best completes the statement or answers the question.
سؤال
Write the word or phrase that best completes each statement or answers the question.
سؤال
Write the word or phrase that best completes each statement or answers the question.
سؤال
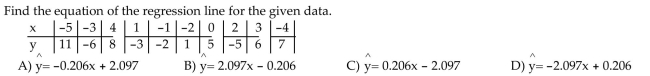
Find the Least-Squares Regression Line and Use the Line to Make Predictions
سؤال
Find the Least-Squares Regression Line and Use the Line to Make Predictions
سؤال
Find the Least-Squares Regression Line and Use the Line to Make Predictions
سؤال
Find the Least-Squares Regression Line and Use the Line to Make Predictions
سؤال
Write the word or phrase that best completes each statement or answers the question.

فتح الحزمة
قم بالتسجيل لفتح البطاقات في هذه المجموعة!
Unlock Deck
Unlock Deck
1/183
العب
ملء الشاشة (f)
Deck 4: Describing the Relation Between Two Variables
1
Write the word or phrase that best completes each statement or answers the question.
Construct a scatter diagram for the data.
Construct a scatter diagram for the data.
2
Choose the one alternative that best completes the statement or answers the question.
Make a scatter diagram for the data. Use the scatter diagram to describe how, if at all, the variables are related.
Make a scatter diagram for the data. Use the scatter diagram to describe how, if at all, the variables are related.
A
3
The scatter diagram shows the relationship between average number of years of education and births per woman ofchild bearing age in selected countries. Use the scatter plot to determine whether the statement is true or false.
There is a strong positive correlation between years of education and births per woman.
There is a strong positive correlation between years of education and births per woman.
A
4
Write the word or phrase that best completes each statement or answers the question.
Construct a scatter diagram for the data.
Construct a scatter diagram for the data.
فتح الحزمة
افتح القفل للوصول البطاقات البالغ عددها 183 في هذه المجموعة.
فتح الحزمة
k this deck
5
Write the word or phrase that best completes each statement or answers the question.
Construct a scatter diagram for the data.
Construct a scatter diagram for the data.
فتح الحزمة
افتح القفل للوصول البطاقات البالغ عددها 183 في هذه المجموعة.
فتح الحزمة
k this deck
6
Use the scatter diagrams shown, labeled a through f to solve the problem.
In which scatter diagram is r = 1
In which scatter diagram is r = 1
فتح الحزمة
افتح القفل للوصول البطاقات البالغ عددها 183 في هذه المجموعة.
فتح الحزمة
k this deck
7
Write the word or phrase that best completes each statement or answers the question.
Construct a scatter diagram for the data.
Construct a scatter diagram for the data.
فتح الحزمة
افتح القفل للوصول البطاقات البالغ عددها 183 في هذه المجموعة.
فتح الحزمة
k this deck
8
Choose the one alternative that best completes the statement or answers the question.
Make a scatter diagram for the data. Use the scatter diagram to describe how, if at all, the variables are related.
Make a scatter diagram for the data. Use the scatter diagram to describe how, if at all, the variables are related.
فتح الحزمة
افتح القفل للوصول البطاقات البالغ عددها 183 في هذه المجموعة.
فتح الحزمة
k this deck
9
Write the word or phrase that best completes each statement or answers the question.
Construct a scatter diagram for the data.
Construct a scatter diagram for the data.
فتح الحزمة
افتح القفل للوصول البطاقات البالغ عددها 183 في هذه المجموعة.
فتح الحزمة
k this deck
10
Write the word or phrase that best completes each statement or answers the question.
Construct a scatter diagram for the data.
Construct a scatter diagram for the data.
فتح الحزمة
افتح القفل للوصول البطاقات البالغ عددها 183 في هذه المجموعة.
فتح الحزمة
k this deck
11
Use the scatter diagrams shown, labeled a through f to solve the problem.
فتح الحزمة
افتح القفل للوصول البطاقات البالغ عددها 183 في هذه المجموعة.
فتح الحزمة
k this deck
12
Write the word or phrase that best completes each statement or answers the question.
Construct a scatter diagram for the data.
Construct a scatter diagram for the data.
فتح الحزمة
افتح القفل للوصول البطاقات البالغ عددها 183 في هذه المجموعة.
فتح الحزمة
k this deck
13
The scatter diagram shows the relationship between average number of years of education and births per woman ofchild bearing age in selected countries. Use the scatter plot to determine whether the statement is true or false.
There is no correlation between years of education and births per woman.
There is no correlation between years of education and births per woman.
فتح الحزمة
افتح القفل للوصول البطاقات البالغ عددها 183 في هذه المجموعة.
فتح الحزمة
k this deck
14
Write the word or phrase that best completes each statement or answers the question.
Provide an appropriate response.
A college counselor wants to determine if the number of hours spent studying for a test can be used to predict the grades on a test. Identify the predictor variable and the response variable.
Provide an appropriate response.
A college counselor wants to determine if the number of hours spent studying for a test can be used to predict the grades on a test. Identify the predictor variable and the response variable.
فتح الحزمة
افتح القفل للوصول البطاقات البالغ عددها 183 في هذه المجموعة.
فتح الحزمة
k this deck
15
Write the word or phrase that best completes each statement or answers the question.
Construct a scatter diagram for the data.
Construct a scatter diagram for the data.
فتح الحزمة
افتح القفل للوصول البطاقات البالغ عددها 183 في هذه المجموعة.
فتح الحزمة
k this deck
16
Write the word or phrase that best completes each statement or answers the question.
Construct a scatter diagram for the data.
Construct a scatter diagram for the data.
فتح الحزمة
افتح القفل للوصول البطاقات البالغ عددها 183 في هذه المجموعة.
فتح الحزمة
k this deck
17
Write the word or phrase that best completes each statement or answers the question.
Provide an appropriate response.
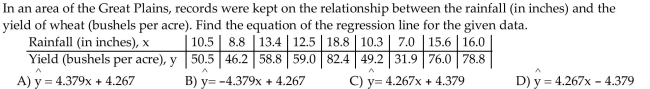
An agricultural business wants to determine if the rainfall in inches can be used to predict the yield per acre on a wheat farm. Identify the predictor variable and the response variable.
Provide an appropriate response.
An agricultural business wants to determine if the rainfall in inches can be used to predict the yield per acre on a wheat farm. Identify the predictor variable and the response variable.
فتح الحزمة
افتح القفل للوصول البطاقات البالغ عددها 183 في هذه المجموعة.
فتح الحزمة
k this deck
18
Choose the one alternative that best completes the statement or answers the question.
The variable is the variable whose value can be explained by the variable.
A) response; predictor
B) response; lurking
C) lurking; response
D) predictor Response
The variable is the variable whose value can be explained by the variable.
A) response; predictor
B) response; lurking
C) lurking; response
D) predictor Response
فتح الحزمة
افتح القفل للوصول البطاقات البالغ عددها 183 في هذه المجموعة.
فتح الحزمة
k this deck
19
Use the scatter diagrams shown, labeled a through f to solve the problem.
In which scatter diagram is r = -1
In which scatter diagram is r = -1
فتح الحزمة
افتح القفل للوصول البطاقات البالغ عددها 183 في هذه المجموعة.
فتح الحزمة
k this deck
20
Choose the one alternative that best completes the statement or answers the question.
Make a scatter diagram for the data. Use the scatter diagram to describe how, if at all, the variables are related.
Make a scatter diagram for the data. Use the scatter diagram to describe how, if at all, the variables are related.
فتح الحزمة
افتح القفل للوصول البطاقات البالغ عددها 183 في هذه المجموعة.
فتح الحزمة
k this deck
21
Write the word or phrase that best completes each statement or answers the question.
Provide an appropriate response.
Provide an appropriate response.
فتح الحزمة
افتح القفل للوصول البطاقات البالغ عددها 183 في هذه المجموعة.
فتح الحزمة
k this deck
22
Choose the one alternative that best completes the statement or answers the question.
Use the scatter diagrams shown, labeled a through f to solve the problem.
An instructor wishes to determine if there is a relationship between the number of absences from his class and a studentʹs final grade in the course. What is the predictor variable
A) Absences
B) Final Grade
C) The instructorʹs point scale for attendance
D) Studentʹs performance on the final examination
فتح الحزمة
افتح القفل للوصول البطاقات البالغ عددها 183 في هذه المجموعة.
فتح الحزمة
k this deck
23
Choose the one alternative that best completes the statement or answers the question.
Use the scatter diagrams shown, labeled a through f to solve the problem.
A traffic officer is compiling information about the relationship between the hour or the day and the speed over the limit at which the motorist is ticketed. He computes a correlation coefficient of 0.12. What does this tell the officer
A) There is a weak positive linear correlation.
B) There is a moderate positive linear correlation.
C) There is a moderate negative linear correlation.
D) There is insufficient evidence to make any conclusions about the relationship between the variables.
فتح الحزمة
افتح القفل للوصول البطاقات البالغ عددها 183 في هذه المجموعة.
فتح الحزمة
k this deck
24
Choose the one alternative that best completes the statement or answers the question.
Use the scatter diagrams shown, labeled a through f to solve the problem.
A researcher determines that the linear correlation coefficient is 0.85 for a paired data set. This indicates that there is
A) a strong positive linear correlation.
B) a strong negative linear correlation.
C) no linear correlation but that there may be some other relationship.
D) insufficient evidence to make any decision about the correlation of the data.
فتح الحزمة
افتح القفل للوصول البطاقات البالغ عددها 183 في هذه المجموعة.
فتح الحزمة
k this deck
25
Choose the one alternative that best completes the statement or answers the question.
Use the scatter diagrams shown, labeled a through f to solve the problem.
A medical researcher wishes to determine if there is a relationship between the number of prescriptions written by medical professionals, per 100, children and the childʹs age. She surveys all the pediatricianʹs in a geographical region to collect her data. What is the response variable
A) Age of the child
B) Number of prescriptions written
C) Pediatricians surveyed
D) 100 prescriptions
فتح الحزمة
افتح القفل للوصول البطاقات البالغ عددها 183 في هذه المجموعة.
فتح الحزمة
k this deck
26
Provide an appropriate response.
فتح الحزمة
افتح القفل للوصول البطاقات البالغ عددها 183 في هذه المجموعة.
فتح الحزمة
k this deck
27
Write the word or phrase that best completes each statement or answers the question.
Provide an appropriate response.
Provide an appropriate response.
فتح الحزمة
افتح القفل للوصول البطاقات البالغ عددها 183 في هذه المجموعة.
فتح الحزمة
k this deck
28
Provide an appropriate response.
فتح الحزمة
افتح القفل للوصول البطاقات البالغ عددها 183 في هذه المجموعة.
فتح الحزمة
k this deck
29
Provide an appropriate response.
فتح الحزمة
افتح القفل للوصول البطاقات البالغ عددها 183 في هذه المجموعة.
فتح الحزمة
k this deck
30
The scatter diagram shows the relationship between average number of years of education and births per woman ofchild bearing age in selected countries. Use the scatter plot to determine whether the statement is true or false.
There is a strong negative correlation between years of education and births per woman.
There is a strong negative correlation between years of education and births per woman.
فتح الحزمة
افتح القفل للوصول البطاقات البالغ عددها 183 في هذه المجموعة.
فتح الحزمة
k this deck
31
Choose the one alternative that best completes the statement or answers the question.
Use the scatter diagrams shown, labeled a through f to solve the problem.
Which scatter diagram indicates a perfect positive correlation
Use the scatter diagrams shown, labeled a through f to solve the problem.
Which scatter diagram indicates a perfect positive correlation
فتح الحزمة
افتح القفل للوصول البطاقات البالغ عددها 183 في هذه المجموعة.
فتح الحزمة
k this deck
32
Choose the one alternative that best completes the statement or answers the question.
Use the scatter diagrams shown, labeled a through f to solve the problem.
A history instructor has given the same pretest and the same final examination each semester. He is interested in determining if there is a relationship between the scores of the two tests. He computes the linear correlation coefficient and notes that it is 1.15. What does this correlation coefficient value tell the instructor
A) The history instructor has made a computational error.
B) There is a strong positive correlation between the tests.
C) There is a strong negative correlation between the tests.
D) The correlation is something other than linear.
فتح الحزمة
افتح القفل للوصول البطاقات البالغ عددها 183 في هذه المجموعة.
فتح الحزمة
k this deck
33
Write the word or phrase that best completes each statement or answers the question.
Provide an appropriate response.
Provide an appropriate response.
فتح الحزمة
افتح القفل للوصول البطاقات البالغ عددها 183 في هذه المجموعة.
فتح الحزمة
k this deck
34
Provide an appropriate response.
فتح الحزمة
افتح القفل للوصول البطاقات البالغ عددها 183 في هذه المجموعة.
فتح الحزمة
k this deck
35
The scatter diagram shows the relationship between average number of years of education and births per woman ofchild bearing age in selected countries. Use the scatter plot to determine whether the statement is true or false.
There is a causal relationship between years of education and births per woman.
There is a causal relationship between years of education and births per woman.
فتح الحزمة
افتح القفل للوصول البطاقات البالغ عددها 183 في هذه المجموعة.
فتح الحزمة
k this deck
36
Write the word or phrase that best completes each statement or answers the question.
Provide an appropriate response.
Provide an appropriate response.
فتح الحزمة
افتح القفل للوصول البطاقات البالغ عددها 183 في هذه المجموعة.
فتح الحزمة
k this deck
37
Choose the one alternative that best completes the statement or answers the question.
Use the scatter diagrams shown, labeled a through f to solve the problem.
A doctor wishes to determine the relationship between a maleʹs age and that maleʹs total cholesterol level. He tests 200 males and records each maleʹs age and that maleʹs total cholesterol level. The males cholesterol level is the predictor variable
فتح الحزمة
افتح القفل للوصول البطاقات البالغ عددها 183 في هذه المجموعة.
فتح الحزمة
k this deck
38
Provide an appropriate response.
فتح الحزمة
افتح القفل للوصول البطاقات البالغ عددها 183 في هذه المجموعة.
فتح الحزمة
k this deck
39
Choose the one alternative that best completes the statement or answers the question.
Use the scatter diagrams shown, labeled a through f to solve the problem.
A scatter diagram locates a point in a two dimensional plane. The diagram locates the variable on the horizontal axis and the variable on the vertical axis.
A) predictor; response
B) response; predictor
C) response; study
D) study; predictor
فتح الحزمة
افتح القفل للوصول البطاقات البالغ عددها 183 في هذه المجموعة.
فتح الحزمة
k this deck
40
Write the word or phrase that best completes each statement or answers the question.
Provide an appropriate response.
Provide an appropriate response.
فتح الحزمة
افتح القفل للوصول البطاقات البالغ عددها 183 في هذه المجموعة.
فتح الحزمة
k this deck
41
Explain the Difference between Correlation and Causation .Provide an appropriate response.
A variable that is related to either the response variable or the predictor variable or both, but which is excluded from the analysis is a
A) lurking variable.
B) random variable.
C) discrete variable.
D) qualitative variable.
A variable that is related to either the response variable or the predictor variable or both, but which is excluded from the analysis is a
A) lurking variable.
B) random variable.
C) discrete variable.
D) qualitative variable.
فتح الحزمة
افتح القفل للوصول البطاقات البالغ عددها 183 في هذه المجموعة.
فتح الحزمة
k this deck
42
Write the word or phrase that best completes each statement or answers the question.
For a random sample of 100 American cities, the linear correlation coefficient between the number of robberies last year and the number of schools in the city was found to be r = 0.725. What does this imply Does this suggest that building more schools in a city could lead to more robberies Why or why not What is a likely lurking variable
For a random sample of 100 American cities, the linear correlation coefficient between the number of robberies last year and the number of schools in the city was found to be r = 0.725. What does this imply Does this suggest that building more schools in a city could lead to more robberies Why or why not What is a likely lurking variable
فتح الحزمة
افتح القفل للوصول البطاقات البالغ عددها 183 في هذه المجموعة.
فتح الحزمة
k this deck
43
Provide an appropriate response.
فتح الحزمة
افتح القفل للوصول البطاقات البالغ عددها 183 في هذه المجموعة.
فتح الحزمة
k this deck
44
Compute the linear correlation coefficient between the two variables and determine whether a linear relation exists.
فتح الحزمة
افتح القفل للوصول البطاقات البالغ عددها 183 في هذه المجموعة.
فتح الحزمة
k this deck
45
Provide an appropriate response.
فتح الحزمة
افتح القفل للوصول البطاقات البالغ عددها 183 في هذه المجموعة.
فتح الحزمة
k this deck
46
Provide an appropriate response.
فتح الحزمة
افتح القفل للوصول البطاقات البالغ عددها 183 في هذه المجموعة.
فتح الحزمة
k this deck
47
Write the word or phrase that best completes each statement or answers the question.
A random sample of 200 men aged between 20 and 60 was selected from a certain city. The linear correlation coefficient between income and blood pressure was found to be r = 0.807. What does this imply Does this suggest that if a man gets a salary raise his blood pressure is likely to rise Why or why not What are likely lurking variables
A random sample of 200 men aged between 20 and 60 was selected from a certain city. The linear correlation coefficient between income and blood pressure was found to be r = 0.807. What does this imply Does this suggest that if a man gets a salary raise his blood pressure is likely to rise Why or why not What are likely lurking variables
فتح الحزمة
افتح القفل للوصول البطاقات البالغ عددها 183 في هذه المجموعة.
فتح الحزمة
k this deck
48
Write the word or phrase that best completes each statement or answers the question.
فتح الحزمة
افتح القفل للوصول البطاقات البالغ عددها 183 في هذه المجموعة.
فتح الحزمة
k this deck
49
Write the word or phrase that best completes each statement or answers the question.
For a random sample of 30 countries, the linear correlation coefficient between the infant mortality rate and the average number of cars per capita was found to be r = -0.717. What does this imply Does this suggest that if people buy more cars, this could lower the infant mortality rate Why or why not What is a likely lurking variable
For a random sample of 30 countries, the linear correlation coefficient between the infant mortality rate and the average number of cars per capita was found to be r = -0.717. What does this imply Does this suggest that if people buy more cars, this could lower the infant mortality rate Why or why not What is a likely lurking variable
فتح الحزمة
افتح القفل للوصول البطاقات البالغ عددها 183 في هذه المجموعة.
فتح الحزمة
k this deck
50
Compute the linear correlation coefficient between the two variables and determine whether a linear relation exists.
فتح الحزمة
افتح القفل للوصول البطاقات البالغ عددها 183 في هذه المجموعة.
فتح الحزمة
k this deck
51
Provide an appropriate response.
فتح الحزمة
افتح القفل للوصول البطاقات البالغ عددها 183 في هذه المجموعة.
فتح الحزمة
k this deck
52
Compute the linear correlation coefficient between the two variables and determine whether a linear relation exists.
فتح الحزمة
افتح القفل للوصول البطاقات البالغ عددها 183 في هذه المجموعة.
فتح الحزمة
k this deck
53
Compute the linear correlation coefficient between the two variables and determine whether a linear relation exists.
فتح الحزمة
افتح القفل للوصول البطاقات البالغ عددها 183 في هذه المجموعة.
فتح الحزمة
k this deck
54
Compute the linear correlation coefficient between the two variables and determine whether a linear relation exists.
فتح الحزمة
افتح القفل للوصول البطاقات البالغ عددها 183 في هذه المجموعة.
فتح الحزمة
k this deck
55
Compute the linear correlation coefficient between the two variables and determine whether a linear relation exists.
فتح الحزمة
افتح القفل للوصول البطاقات البالغ عددها 183 في هذه المجموعة.
فتح الحزمة
k this deck
56
Compute the linear correlation coefficient between the two variables and determine whether a linear relation exists.
فتح الحزمة
افتح القفل للوصول البطاقات البالغ عددها 183 في هذه المجموعة.
فتح الحزمة
k this deck
57
Compute the linear correlation coefficient between the two variables and determine whether a linear relation exists.
فتح الحزمة
افتح القفل للوصول البطاقات البالغ عددها 183 في هذه المجموعة.
فتح الحزمة
k this deck
58
Compute the linear correlation coefficient between the two variables and determine whether a linear relation exists.
فتح الحزمة
افتح القفل للوصول البطاقات البالغ عددها 183 في هذه المجموعة.
فتح الحزمة
k this deck
59
Provide an appropriate response.
فتح الحزمة
افتح القفل للوصول البطاقات البالغ عددها 183 في هذه المجموعة.
فتح الحزمة
k this deck
60
Compute the linear correlation coefficient between the two variables and determine whether a linear relation exists.
فتح الحزمة
افتح القفل للوصول البطاقات البالغ عددها 183 في هذه المجموعة.
فتح الحزمة
k this deck
61
Find the Least-Squares Regression Line and Use the Line to Make Predictions
فتح الحزمة
افتح القفل للوصول البطاقات البالغ عددها 183 في هذه المجموعة.
فتح الحزمة
k this deck
62
Find the Least-Squares Regression Line and Use the Line to Make Predictions
فتح الحزمة
افتح القفل للوصول البطاقات البالغ عددها 183 في هذه المجموعة.
فتح الحزمة
k this deck
63
Find the Least-Squares Regression Line and Use the Line to Make Predictions
فتح الحزمة
افتح القفل للوصول البطاقات البالغ عددها 183 في هذه المجموعة.
فتح الحزمة
k this deck
64
Choose the one alternative that best completes the statement or answers the question.
A residual is the difference between
A) the observed value of y and the predicted value of y.
B) the observed value of x and the predicted value of x.
C) the observed value of y and the predicted value of x.
D) the observed value of x and the predicted value of y.
A residual is the difference between
A) the observed value of y and the predicted value of y.
B) the observed value of x and the predicted value of x.
C) the observed value of y and the predicted value of x.
D) the observed value of x and the predicted value of y.
فتح الحزمة
افتح القفل للوصول البطاقات البالغ عددها 183 في هذه المجموعة.
فتح الحزمة
k this deck
65
Find the Least-Squares Regression Line and Use the Line to Make Predictions
فتح الحزمة
افتح القفل للوصول البطاقات البالغ عددها 183 في هذه المجموعة.
فتح الحزمة
k this deck
66
Interpret the Slope and the y-intercept of the Least-Squares Regression Line
فتح الحزمة
افتح القفل للوصول البطاقات البالغ عددها 183 في هذه المجموعة.
فتح الحزمة
k this deck
67
Find the Least-Squares Regression Line and Use the Line to Make Predictions
فتح الحزمة
افتح القفل للوصول البطاقات البالغ عددها 183 في هذه المجموعة.
فتح الحزمة
k this deck
68
Find the Least-Squares Regression Line and Use the Line to Make Predictions
فتح الحزمة
افتح القفل للوصول البطاقات البالغ عددها 183 في هذه المجموعة.
فتح الحزمة
k this deck
69
Find the Least-Squares Regression Line and Use the Line to Make Predictions
فتح الحزمة
افتح القفل للوصول البطاقات البالغ عددها 183 في هذه المجموعة.
فتح الحزمة
k this deck
70
Find the Least-Squares Regression Line and Use the Line to Make Predictions
فتح الحزمة
افتح القفل للوصول البطاقات البالغ عددها 183 في هذه المجموعة.
فتح الحزمة
k this deck
71
Find the Least-Squares Regression Line and Use the Line to Make Predictions
فتح الحزمة
افتح القفل للوصول البطاقات البالغ عددها 183 في هذه المجموعة.
فتح الحزمة
k this deck
72
Choose the one alternative that best completes the statement or answers the question.
The least squares regression line
A) minimizes the sum of the residuals squared.
B) maximizes the sum of the residuals squared.
C) minimizes the mean difference between the residuals squared.
D) maximizes the mean difference between the residuals squared.
The least squares regression line
A) minimizes the sum of the residuals squared.
B) maximizes the sum of the residuals squared.
C) minimizes the mean difference between the residuals squared.
D) maximizes the mean difference between the residuals squared.
فتح الحزمة
افتح القفل للوصول البطاقات البالغ عددها 183 في هذه المجموعة.
فتح الحزمة
k this deck
73
Choose the one alternative that best completes the statement or answers the question.
فتح الحزمة
افتح القفل للوصول البطاقات البالغ عددها 183 في هذه المجموعة.
فتح الحزمة
k this deck
74
Write the word or phrase that best completes each statement or answers the question.
فتح الحزمة
افتح القفل للوصول البطاقات البالغ عددها 183 في هذه المجموعة.
فتح الحزمة
k this deck
75
Write the word or phrase that best completes each statement or answers the question.
فتح الحزمة
افتح القفل للوصول البطاقات البالغ عددها 183 في هذه المجموعة.
فتح الحزمة
k this deck
76
Find the Least-Squares Regression Line and Use the Line to Make Predictions
فتح الحزمة
افتح القفل للوصول البطاقات البالغ عددها 183 في هذه المجموعة.
فتح الحزمة
k this deck
77
Find the Least-Squares Regression Line and Use the Line to Make Predictions
فتح الحزمة
افتح القفل للوصول البطاقات البالغ عددها 183 في هذه المجموعة.
فتح الحزمة
k this deck
78
Find the Least-Squares Regression Line and Use the Line to Make Predictions
فتح الحزمة
افتح القفل للوصول البطاقات البالغ عددها 183 في هذه المجموعة.
فتح الحزمة
k this deck
79
Find the Least-Squares Regression Line and Use the Line to Make Predictions
فتح الحزمة
افتح القفل للوصول البطاقات البالغ عددها 183 في هذه المجموعة.
فتح الحزمة
k this deck
80
Write the word or phrase that best completes each statement or answers the question.
فتح الحزمة
افتح القفل للوصول البطاقات البالغ عددها 183 في هذه المجموعة.
فتح الحزمة
k this deck
فتح الحزمة
افتح القفل للوصول البطاقات البالغ عددها 183 في هذه المجموعة.


