Deck 3: Numerically Summarizing Data
ملء الشاشة (f)
سؤال
Provide an appropriate response.
Describe the shape of the histogram. The data set: round-trip commuting times (in minutes) of 20 randomly selected employees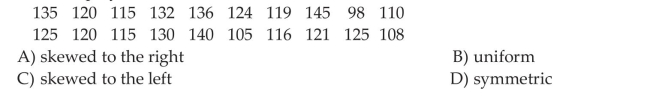
Describe the shape of the histogram. The data set: round-trip commuting times (in minutes) of 20 randomly selected employees
سؤال
Determine the Median of a Variable from Raw Data
The annual profits of ten internet businesses are listed below. Find the mean and median profits. Round the median to the nearest dollar. Which measure- the mean or the median- best represents the data Explain your reasoning.
The annual profits of ten internet businesses are listed below. Find the mean and median profits. Round the median to the nearest dollar. Which measure- the mean or the median- best represents the data Explain your reasoning.
سؤال
Provide an appropriate response.
سؤال
Determine the Median of a Variable from Raw Data
The number of students enrolled in a physics class for the last ten semesters are listed below. Find the median number of students.
The number of students enrolled in a physics class for the last ten semesters are listed below. Find the median number of students.
سؤال
Determine the Median of a Variable from Raw Data
The number of homework points earned by twelve students in a history class over one term are listed below. Find the mean and median number of points. Round the mean to the nearest whole number. Which measure of central tendency- the mean or the median- best represents the data Explain your reasoning.
The number of homework points earned by twelve students in a history class over one term are listed below. Find the mean and median number of points. Round the mean to the nearest whole number. Which measure of central tendency- the mean or the median- best represents the data Explain your reasoning.
سؤال
The heights of ten male students (in inches) in a college biology class are listed below. Find the mean. 
سؤال
Provide an appropriate response.
Describe the shape of the histogram. The data set: Pick-Three lottery results for 10 consecutive weeks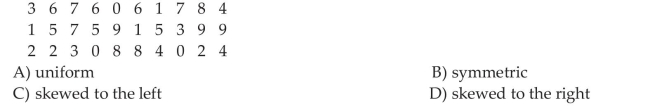
Describe the shape of the histogram. The data set: Pick-Three lottery results for 10 consecutive weeks
سؤال
Provide an appropriate response.
Describe the shape of the histogram. The data set: age of 20 household stereo systems randomly selected from a neighborhood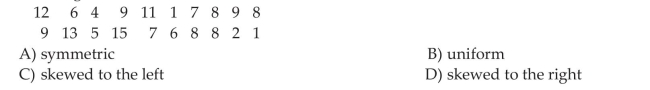
Describe the shape of the histogram. The data set: age of 20 household stereo systems randomly selected from a neighborhood
سؤال
Each year advertisers spend billions of dollars purchasing commercial time on network sports television. In the first 6 months of 1988, advertisers spent $1.1 billion. A recent article listed the top 10 leading spenders (in millions of dollars): 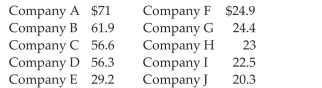 Calculate the mean amount spent.
A) 39.01 million dollars
B) 19.84 million dollars
C) 393.71 million dollars
D) 50.70 million dollars
Calculate the mean amount spent.A) 39.01 million dollars
B) 19.84 million dollars
C) 393.71 million dollars
D) 50.70 million dollars
سؤال
The heights of ten female students (in inches) in a college math class are listed below. Find the mean. 
سؤال
Determine the Median of a Variable from Raw Data
The following data represents a random sample of 15 complaints registered with the customer service department of a store. Determine the median complaint.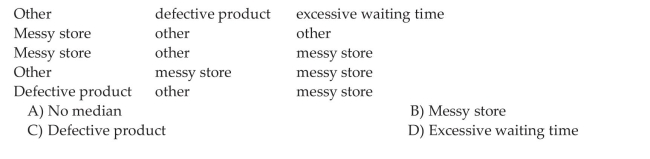
The following data represents a random sample of 15 complaints registered with the customer service department of a store. Determine the median complaint.
سؤال
سؤال
Determine the Median of a Variable from Raw Data
Each year advertisers spend billions of dollars purchasing commercial time on network sports television. In the first 6 months of 1988, advertisers spent $1.1 billion. A recent article listed the top 10 leading spenders (in millions of dollars):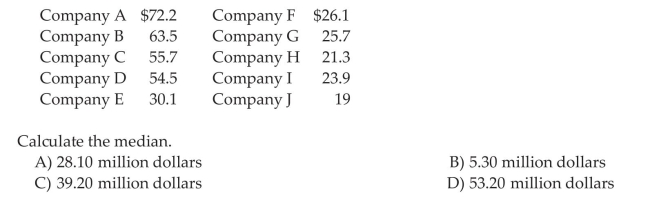
Each year advertisers spend billions of dollars purchasing commercial time on network sports television. In the first 6 months of 1988, advertisers spent $1.1 billion. A recent article listed the top 10 leading spenders (in millions of dollars):
سؤال
Determine the Median of a Variable from Raw Data
The commuting times (in minutes) of an employee for ten consecutive days are listed below. Find the median commute.
The commuting times (in minutes) of an employee for ten consecutive days are listed below. Find the median commute.
سؤال

سؤال

سؤال
Determine the Median of a Variable from Raw Data
The number of yards that a football player rushed in the first 13 games of his NFL career are listed below. Find the mean and median number of yards rushed. Round the mean to the nearest whole number. Which measure of central tendency-the mean or the median-better represents the data Explain your reasoning.
The number of yards that a football player rushed in the first 13 games of his NFL career are listed below. Find the mean and median number of yards rushed. Round the mean to the nearest whole number. Which measure of central tendency-the mean or the median-better represents the data Explain your reasoning.
سؤال
Provide an appropriate response.
In distributions that are skewed to the right, what is the relationship of the mean, median, and mode
In distributions that are skewed to the right, what is the relationship of the mean, median, and mode
سؤال
سؤال
سؤال
سؤال
Provide an appropriate response.
If the graph of a distribution of data shows that the graph is skewed to the left then the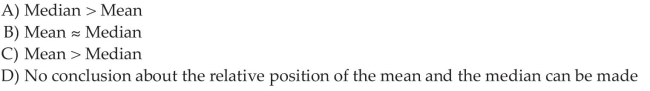
If the graph of a distribution of data shows that the graph is skewed to the left then the
سؤال
Provide an appropriate response.
The annual profits of five large corporations in a certain area are given below. Which measure of central tendency should be used
A) median
B) mean
C) mode
D) midrange
The annual profits of five large corporations in a certain area are given below. Which measure of central tendency should be used
A) median
B) mean
C) mode
D) midrange
سؤال
Determine the Mode of a Variable from Raw Data

سؤال
Determine the Mode of a Variable from Raw Data
Calculate the mean, median, and mode for the following sample: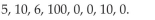
Calculate the mean, median, and mode for the following sample:
سؤال
Determine the Mode of a Variable from Raw Data
Calculate the mean, median, and mode for the following sample: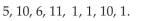
Calculate the mean, median, and mode for the following sample:
سؤال
Determine the Mode of a Variable from Raw Data
Find the mean, median, and mode of the following statistic students test scores:
Find the mean, median, and mode of the following statistic students test scores:
سؤال
Determine the Mode of a Variable from Raw Data

سؤال
سؤال
Determine the Mode of a Variable from Raw Data
The accompanying data set contains quiz scores for 12 students in a chemistry class: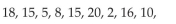
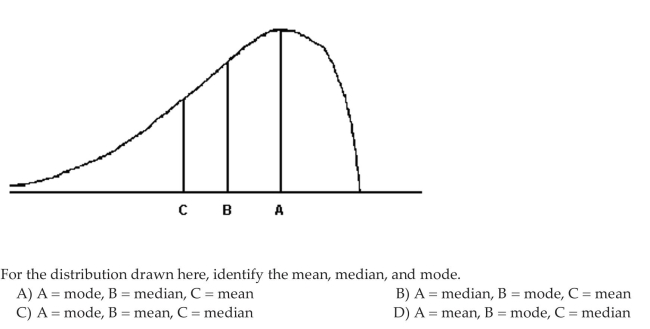
 a. Find a measure of central tendency that separates the data into two groups such that each group consists of 50% of the scores above and 50% of the scores below that measure. b. Find a measure of central tendency that represents the quiz score that occurs most often. c. Find a measure of central tendency that represents the average of the 12 quiz scores.
The accompanying data set contains quiz scores for 12 students in a chemistry class:
a. Find a measure of central tendency that separates the data into two groups such that each group consists of 50% of the scores above and 50% of the scores below that measure. b. Find a measure of central tendency that represents the quiz score that occurs most often. c. Find a measure of central tendency that represents the average of the 12 quiz scores. سؤال
Provide an appropriate response.
In distributions that are skewed to the left, what is the relationship of the mean, median, and mode
In distributions that are skewed to the left, what is the relationship of the mean, median, and mode
سؤال
Determine the Mode of a Variable from Raw Data

سؤال
Provide an appropriate response.
The output below gives the mean and median for the national dropout rates for high school students in 1982 and 1984.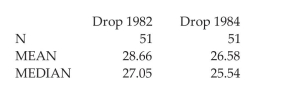 Use the sample information to determine the shape of the distributions of the high school dropout rates in 1982 and 1984.
The output below gives the mean and median for the national dropout rates for high school students in 1982 and 1984.
Use the sample information to determine the shape of the distributions of the high school dropout rates in 1982 and 1984. سؤال
سؤال
Provide an appropriate response.
A severe drought affected several western states for 3 years. A Christmas tree farmer is worried about the drought s effect on the size of his trees. To decide whether the growth of the trees has been retarded, the farmer decides to take a sample of the heights of 25 trees and obtains the following results (recorded in inches): Which measure of central tendency would be considered the best measure to use in this problem
A) mean
B) median
C) mode
D) range
A severe drought affected several western states for 3 years. A Christmas tree farmer is worried about the drought s effect on the size of his trees. To decide whether the growth of the trees has been retarded, the farmer decides to take a sample of the heights of 25 trees and obtains the following results (recorded in inches):
Which measure of central tendency would be considered the best measure to use in this problemA) mean
B) median
C) mode
D) range
سؤال
سؤال
Determine the Mode of a Variable from Raw Data
The commuting times of ten employees (in minutes) are listed below. Find the mode score.
The commuting times of ten employees (in minutes) are listed below. Find the mode score.
سؤال
سؤال
Determine the Mode of a Variable from Raw Data
The February utility bills (in dollars) for ten residents of a large city are listed below. Find the mode amount.
The February utility bills (in dollars) for ten residents of a large city are listed below. Find the mode amount.
سؤال
Provide an appropriate response.
If the graph of a distribution of data shows that the graph is skewed to the right then the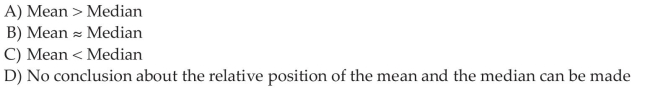
If the graph of a distribution of data shows that the graph is skewed to the right then the
سؤال
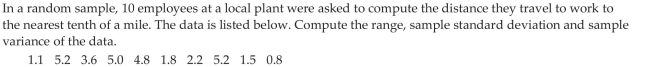
Compute the Range of a Variable from Raw Data

سؤال
Compute the Range of a Variable from Raw Data

سؤال
Compute the Range of a Variable from Raw Data

سؤال
Compute the Range of a Variable from Raw Data

سؤال
Compute the Range of a Variable from Raw Data

سؤال
Compute the Range of a Variable from Raw Data

سؤال
Compute the Range of a Variable from Raw Data

سؤال
سؤال
Compute the Range of a Variable from Raw Data

سؤال
سؤال
Provide an appropriate response.
سؤال
Compute the Range of a Variable from Raw Data

سؤال
سؤال
سؤال
Compute the Range of a Variable from Raw Data
سؤال
Compute the Range of a Variable from Raw Data

سؤال
سؤال
Compute the Range of a Variable from Raw Data

سؤال
Determine the Mode of a Variable from Raw Data
The following data represent the bachelor degrees of CEO s at area small businesses. Determine the mode degree.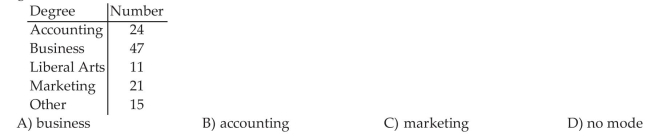
The following data represent the bachelor degrees of CEO s at area small businesses. Determine the mode degree.
سؤال
Determine the Mode of a Variable from Raw Data
The following data represent a random sample of 15 complaints registered with the customer service department of a store. Determine the mode complaint.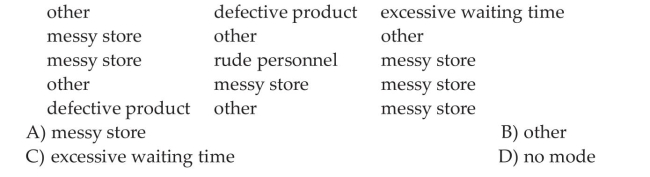
The following data represent a random sample of 15 complaints registered with the customer service department of a store. Determine the mode complaint.
سؤال
Provide an appropriate response.
Each year advertisers spend billions of dollars purchasing commercial time on network sports television. In the first 6 months of 1988, advertisers spent $1.1 billion. Who were the largest spenders In a recent article, listed the top 10 leading spenders (in million of dollars):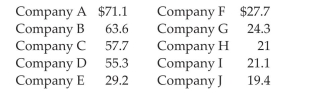 Calculate the sample variance.
A) 413.26
B) 20.33
C) 39.04
D) 51.70
Each year advertisers spend billions of dollars purchasing commercial time on network sports television. In the first 6 months of 1988, advertisers spent $1.1 billion. Who were the largest spenders In a recent article, listed the top 10 leading spenders (in million of dollars):
Calculate the sample variance.A) 413.26
B) 20.33
C) 39.04
D) 51.70
سؤال
سؤال
سؤال
سؤال
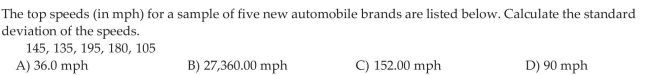
Compute the Standard Deviation of a Variable from Raw Data
سؤال
سؤال
سؤال
Compute the Standard Deviation of a Variable from Raw Data
سؤال
سؤال
Compute the Standard Deviation of a Variable from Raw Data
سؤال
سؤال
Provide an appropriate response.
For the data set given below the sample variance will be computed. How many degrees of freedom are there
A) 8
B) 9
C) 1
D) 10
For the data set given below the sample variance will be computed. How many degrees of freedom are there
A) 8
B) 9
C) 1
D) 10
سؤال
Compute the Standard Deviation of a Variable from Raw Data

سؤال
سؤال
Compute the Standard Deviation of a Variable from Raw Data

سؤال
سؤال
سؤال
Compute the Standard Deviation of a Variable from Raw Data

سؤال
سؤال
Compute the Standard Deviation of a Variable from Raw Data


فتح الحزمة
قم بالتسجيل لفتح البطاقات في هذه المجموعة!
Unlock Deck
Unlock Deck
1/158
العب
ملء الشاشة (f)
Deck 3: Numerically Summarizing Data
1
Provide an appropriate response.
Describe the shape of the histogram. The data set: round-trip commuting times (in minutes) of 20 randomly selected employees
Describe the shape of the histogram. The data set: round-trip commuting times (in minutes) of 20 randomly selected employees
A
2
Determine the Median of a Variable from Raw Data
The annual profits of ten internet businesses are listed below. Find the mean and median profits. Round the median to the nearest dollar. Which measure- the mean or the median- best represents the data Explain your reasoning.
The annual profits of ten internet businesses are listed below. Find the mean and median profits. Round the median to the nearest dollar. Which measure- the mean or the median- best represents the data Explain your reasoning.
mean: $315,767; median: $175,195; the median
3
Provide an appropriate response.
A
4
Determine the Median of a Variable from Raw Data
The number of students enrolled in a physics class for the last ten semesters are listed below. Find the median number of students.
The number of students enrolled in a physics class for the last ten semesters are listed below. Find the median number of students.
فتح الحزمة
افتح القفل للوصول البطاقات البالغ عددها 158 في هذه المجموعة.
فتح الحزمة
k this deck
5
Determine the Median of a Variable from Raw Data
The number of homework points earned by twelve students in a history class over one term are listed below. Find the mean and median number of points. Round the mean to the nearest whole number. Which measure of central tendency- the mean or the median- best represents the data Explain your reasoning.
The number of homework points earned by twelve students in a history class over one term are listed below. Find the mean and median number of points. Round the mean to the nearest whole number. Which measure of central tendency- the mean or the median- best represents the data Explain your reasoning.
فتح الحزمة
افتح القفل للوصول البطاقات البالغ عددها 158 في هذه المجموعة.
فتح الحزمة
k this deck
6
The heights of ten male students (in inches) in a college biology class are listed below. Find the mean.
فتح الحزمة
افتح القفل للوصول البطاقات البالغ عددها 158 في هذه المجموعة.
فتح الحزمة
k this deck
7
Provide an appropriate response.
Describe the shape of the histogram. The data set: Pick-Three lottery results for 10 consecutive weeks
Describe the shape of the histogram. The data set: Pick-Three lottery results for 10 consecutive weeks
فتح الحزمة
افتح القفل للوصول البطاقات البالغ عددها 158 في هذه المجموعة.
فتح الحزمة
k this deck
8
Provide an appropriate response.
Describe the shape of the histogram. The data set: age of 20 household stereo systems randomly selected from a neighborhood
Describe the shape of the histogram. The data set: age of 20 household stereo systems randomly selected from a neighborhood
فتح الحزمة
افتح القفل للوصول البطاقات البالغ عددها 158 في هذه المجموعة.
فتح الحزمة
k this deck
9
Each year advertisers spend billions of dollars purchasing commercial time on network sports television. In the first 6 months of 1988, advertisers spent $1.1 billion. A recent article listed the top 10 leading spenders (in millions of dollars): Calculate the mean amount spent.
A) 39.01 million dollars
B) 19.84 million dollars
C) 393.71 million dollars
D) 50.70 million dollars
Calculate the mean amount spent.A) 39.01 million dollars
B) 19.84 million dollars
C) 393.71 million dollars
D) 50.70 million dollars
فتح الحزمة
افتح القفل للوصول البطاقات البالغ عددها 158 في هذه المجموعة.
فتح الحزمة
k this deck
10
The heights of ten female students (in inches) in a college math class are listed below. Find the mean.
فتح الحزمة
افتح القفل للوصول البطاقات البالغ عددها 158 في هذه المجموعة.
فتح الحزمة
k this deck
11
Determine the Median of a Variable from Raw Data
The following data represents a random sample of 15 complaints registered with the customer service department of a store. Determine the median complaint.
The following data represents a random sample of 15 complaints registered with the customer service department of a store. Determine the median complaint.
فتح الحزمة
افتح القفل للوصول البطاقات البالغ عددها 158 في هذه المجموعة.
فتح الحزمة
k this deck
12
فتح الحزمة
افتح القفل للوصول البطاقات البالغ عددها 158 في هذه المجموعة.
فتح الحزمة
k this deck
13
Determine the Median of a Variable from Raw Data
Each year advertisers spend billions of dollars purchasing commercial time on network sports television. In the first 6 months of 1988, advertisers spent $1.1 billion. A recent article listed the top 10 leading spenders (in millions of dollars):
Each year advertisers spend billions of dollars purchasing commercial time on network sports television. In the first 6 months of 1988, advertisers spent $1.1 billion. A recent article listed the top 10 leading spenders (in millions of dollars):
فتح الحزمة
افتح القفل للوصول البطاقات البالغ عددها 158 في هذه المجموعة.
فتح الحزمة
k this deck
14
Determine the Median of a Variable from Raw Data
The commuting times (in minutes) of an employee for ten consecutive days are listed below. Find the median commute.
The commuting times (in minutes) of an employee for ten consecutive days are listed below. Find the median commute.
فتح الحزمة
افتح القفل للوصول البطاقات البالغ عددها 158 في هذه المجموعة.
فتح الحزمة
k this deck
15
فتح الحزمة
افتح القفل للوصول البطاقات البالغ عددها 158 في هذه المجموعة.
فتح الحزمة
k this deck
16
فتح الحزمة
افتح القفل للوصول البطاقات البالغ عددها 158 في هذه المجموعة.
فتح الحزمة
k this deck
17
Determine the Median of a Variable from Raw Data
The number of yards that a football player rushed in the first 13 games of his NFL career are listed below. Find the mean and median number of yards rushed. Round the mean to the nearest whole number. Which measure of central tendency-the mean or the median-better represents the data Explain your reasoning.
The number of yards that a football player rushed in the first 13 games of his NFL career are listed below. Find the mean and median number of yards rushed. Round the mean to the nearest whole number. Which measure of central tendency-the mean or the median-better represents the data Explain your reasoning.
فتح الحزمة
افتح القفل للوصول البطاقات البالغ عددها 158 في هذه المجموعة.
فتح الحزمة
k this deck
18
Provide an appropriate response.
In distributions that are skewed to the right, what is the relationship of the mean, median, and mode
In distributions that are skewed to the right, what is the relationship of the mean, median, and mode
فتح الحزمة
افتح القفل للوصول البطاقات البالغ عددها 158 في هذه المجموعة.
فتح الحزمة
k this deck
19
Determine the Median of a Variable from Raw Data
The median of a data set for a variable is the data value that
A) Lies in the middle of the data when the data is arranged in ascending order.
B) Appears the most often
C) Is the average, that is, the sum of all the data values of the variable divided by the number of observations
D) None of these
The median of a data set for a variable is the data value that
A) Lies in the middle of the data when the data is arranged in ascending order.
B) Appears the most often
C) Is the average, that is, the sum of all the data values of the variable divided by the number of observations
D) None of these
فتح الحزمة
افتح القفل للوصول البطاقات البالغ عددها 158 في هذه المجموعة.
فتح الحزمة
k this deck
20
Provide an appropriate response.
The distribution of salaries of professional basketball players is skewed to the right. Which measure of central tendency would be the best measure to determine the location of the center of the distribution
A) median
B) mode
C) mean
D) frequency
The distribution of salaries of professional basketball players is skewed to the right. Which measure of central tendency would be the best measure to determine the location of the center of the distribution
A) median
B) mode
C) mean
D) frequency
فتح الحزمة
افتح القفل للوصول البطاقات البالغ عددها 158 في هذه المجموعة.
فتح الحزمة
k this deck
21
Provide an appropriate response.
If the graph of a distribution of data shows that the graph is symmetric then the
A) Mean is a better measure of central tendency
B) Median is a better measure of central tendency
C) Mode is a better measure of central tendency
D) Midrange is a better measure of central tendency
If the graph of a distribution of data shows that the graph is symmetric then the
A) Mean is a better measure of central tendency
B) Median is a better measure of central tendency
C) Mode is a better measure of central tendency
D) Midrange is a better measure of central tendency
فتح الحزمة
افتح القفل للوصول البطاقات البالغ عددها 158 في هذه المجموعة.
فتح الحزمة
k this deck
22
Provide an appropriate response.
If the graph of a distribution of data shows that the graph is skewed to the left then the
If the graph of a distribution of data shows that the graph is skewed to the left then the
فتح الحزمة
افتح القفل للوصول البطاقات البالغ عددها 158 في هذه المجموعة.
فتح الحزمة
k this deck
23
Provide an appropriate response.
The annual profits of five large corporations in a certain area are given below. Which measure of central tendency should be used
A) median
B) mean
C) mode
D) midrange
The annual profits of five large corporations in a certain area are given below. Which measure of central tendency should be used
A) median
B) mean
C) mode
D) midrange
فتح الحزمة
افتح القفل للوصول البطاقات البالغ عددها 158 في هذه المجموعة.
فتح الحزمة
k this deck
24
Determine the Mode of a Variable from Raw Data
فتح الحزمة
افتح القفل للوصول البطاقات البالغ عددها 158 في هذه المجموعة.
فتح الحزمة
k this deck
25
Determine the Mode of a Variable from Raw Data
Calculate the mean, median, and mode for the following sample:
Calculate the mean, median, and mode for the following sample:
فتح الحزمة
افتح القفل للوصول البطاقات البالغ عددها 158 في هذه المجموعة.
فتح الحزمة
k this deck
26
Determine the Mode of a Variable from Raw Data
Calculate the mean, median, and mode for the following sample:
Calculate the mean, median, and mode for the following sample:
فتح الحزمة
افتح القفل للوصول البطاقات البالغ عددها 158 في هذه المجموعة.
فتح الحزمة
k this deck
27
Determine the Mode of a Variable from Raw Data
Find the mean, median, and mode of the following statistic students test scores:
Find the mean, median, and mode of the following statistic students test scores:
فتح الحزمة
افتح القفل للوصول البطاقات البالغ عددها 158 في هذه المجموعة.
فتح الحزمة
k this deck
28
Determine the Mode of a Variable from Raw Data
فتح الحزمة
افتح القفل للوصول البطاقات البالغ عددها 158 في هذه المجموعة.
فتح الحزمة
k this deck
29
Provide an appropriate response.
Which measure of central tendency is more representative of the typical observation if the graph of the data is skewed to the right
A) Median
B) Mean
C) Mode
D) Midrange
Which measure of central tendency is more representative of the typical observation if the graph of the data is skewed to the right
A) Median
B) Mean
C) Mode
D) Midrange
فتح الحزمة
افتح القفل للوصول البطاقات البالغ عددها 158 في هذه المجموعة.
فتح الحزمة
k this deck
30
Determine the Mode of a Variable from Raw Data
The accompanying data set contains quiz scores for 12 students in a chemistry class: a. Find a measure of central tendency that separates the data into two groups such that each group consists of 50% of the scores above and 50% of the scores below that measure. b. Find a measure of central tendency that represents the quiz score that occurs most often. c. Find a measure of central tendency that represents the average of the 12 quiz scores.
The accompanying data set contains quiz scores for 12 students in a chemistry class:
a. Find a measure of central tendency that separates the data into two groups such that each group consists of 50% of the scores above and 50% of the scores below that measure. b. Find a measure of central tendency that represents the quiz score that occurs most often. c. Find a measure of central tendency that represents the average of the 12 quiz scores. فتح الحزمة
افتح القفل للوصول البطاقات البالغ عددها 158 في هذه المجموعة.
فتح الحزمة
k this deck
31
Provide an appropriate response.
In distributions that are skewed to the left, what is the relationship of the mean, median, and mode
In distributions that are skewed to the left, what is the relationship of the mean, median, and mode
فتح الحزمة
افتح القفل للوصول البطاقات البالغ عددها 158 في هذه المجموعة.
فتح الحزمة
k this deck
32
Determine the Mode of a Variable from Raw Data
فتح الحزمة
افتح القفل للوصول البطاقات البالغ عددها 158 في هذه المجموعة.
فتح الحزمة
k this deck
33
Provide an appropriate response.
The output below gives the mean and median for the national dropout rates for high school students in 1982 and 1984. Use the sample information to determine the shape of the distributions of the high school dropout rates in 1982 and 1984.
The output below gives the mean and median for the national dropout rates for high school students in 1982 and 1984.
Use the sample information to determine the shape of the distributions of the high school dropout rates in 1982 and 1984. فتح الحزمة
افتح القفل للوصول البطاقات البالغ عددها 158 في هذه المجموعة.
فتح الحزمة
k this deck
34
Provide an appropriate response.
Which measure of central tendency is more representative of the typical observation if the graph of the data is skewed to the left
A) Median
B) Mean
C) Mode
D) Midrange
Which measure of central tendency is more representative of the typical observation if the graph of the data is skewed to the left
A) Median
B) Mean
C) Mode
D) Midrange
فتح الحزمة
افتح القفل للوصول البطاقات البالغ عددها 158 في هذه المجموعة.
فتح الحزمة
k this deck
35
Provide an appropriate response.
A severe drought affected several western states for 3 years. A Christmas tree farmer is worried about the drought s effect on the size of his trees. To decide whether the growth of the trees has been retarded, the farmer decides to take a sample of the heights of 25 trees and obtains the following results (recorded in inches): Which measure of central tendency would be considered the best measure to use in this problem
A) mean
B) median
C) mode
D) range
A severe drought affected several western states for 3 years. A Christmas tree farmer is worried about the drought s effect on the size of his trees. To decide whether the growth of the trees has been retarded, the farmer decides to take a sample of the heights of 25 trees and obtains the following results (recorded in inches):
Which measure of central tendency would be considered the best measure to use in this problemA) mean
B) median
C) mode
D) range
فتح الحزمة
افتح القفل للوصول البطاقات البالغ عددها 158 في هذه المجموعة.
فتح الحزمة
k this deck
36
Provide an appropriate response.
Parking at a large university has become a very big problem. University administrators are interested in determining the average parking time (e.g. the time it takes a student to find a parking spot) of its students. An administrator inconspicuously followed 270 students and carefully recorded their parking times. The parking times recorded followed a distribution that was skewed to the left. Based on this information, discuss the relationship between the mean and the median for the 270 student parking times collected.
Parking at a large university has become a very big problem. University administrators are interested in determining the average parking time (e.g. the time it takes a student to find a parking spot) of its students. An administrator inconspicuously followed 270 students and carefully recorded their parking times. The parking times recorded followed a distribution that was skewed to the left. Based on this information, discuss the relationship between the mean and the median for the 270 student parking times collected.
فتح الحزمة
افتح القفل للوصول البطاقات البالغ عددها 158 في هذه المجموعة.
فتح الحزمة
k this deck
37
Determine the Mode of a Variable from Raw Data
The commuting times of ten employees (in minutes) are listed below. Find the mode score.
The commuting times of ten employees (in minutes) are listed below. Find the mode score.
فتح الحزمة
افتح القفل للوصول البطاقات البالغ عددها 158 في هذه المجموعة.
فتح الحزمة
k this deck
38
Provide an appropriate response.
Many firms use on-the-job training to teach their employees new software. Suppose you work in the personnel department of a firm that just finished training a group of its employees in new software, and you have been requested to review the performance of one of the trainees on the final test that was given to all trainees. The mean of the test scores is 70. Additional information indicated that the median of the test scores was 76. What type of distribution most likely describes the shape of the test scores
A) skewed to the left
B) symmetric
C) skewed to the right
D) unable to determine with the information given
فتح الحزمة
افتح القفل للوصول البطاقات البالغ عددها 158 في هذه المجموعة.
فتح الحزمة
k this deck
39
Determine the Mode of a Variable from Raw Data
The February utility bills (in dollars) for ten residents of a large city are listed below. Find the mode amount.
The February utility bills (in dollars) for ten residents of a large city are listed below. Find the mode amount.
فتح الحزمة
افتح القفل للوصول البطاقات البالغ عددها 158 في هذه المجموعة.
فتح الحزمة
k this deck
40
Provide an appropriate response.
If the graph of a distribution of data shows that the graph is skewed to the right then the
If the graph of a distribution of data shows that the graph is skewed to the right then the
فتح الحزمة
افتح القفل للوصول البطاقات البالغ عددها 158 في هذه المجموعة.
فتح الحزمة
k this deck
41
Compute the Range of a Variable from Raw Data
فتح الحزمة
افتح القفل للوصول البطاقات البالغ عددها 158 في هذه المجموعة.
فتح الحزمة
k this deck
42
Compute the Range of a Variable from Raw Data
فتح الحزمة
افتح القفل للوصول البطاقات البالغ عددها 158 في هذه المجموعة.
فتح الحزمة
k this deck
43
Compute the Range of a Variable from Raw Data
فتح الحزمة
افتح القفل للوصول البطاقات البالغ عددها 158 في هذه المجموعة.
فتح الحزمة
k this deck
44
Compute the Range of a Variable from Raw Data
فتح الحزمة
افتح القفل للوصول البطاقات البالغ عددها 158 في هذه المجموعة.
فتح الحزمة
k this deck
45
Compute the Range of a Variable from Raw Data
فتح الحزمة
افتح القفل للوصول البطاقات البالغ عددها 158 في هذه المجموعة.
فتح الحزمة
k this deck
46
Compute the Range of a Variable from Raw Data
فتح الحزمة
افتح القفل للوصول البطاقات البالغ عددها 158 في هذه المجموعة.
فتح الحزمة
k this deck
47
Compute the Range of a Variable from Raw Data
فتح الحزمة
افتح القفل للوصول البطاقات البالغ عددها 158 في هذه المجموعة.
فتح الحزمة
k this deck
48
Determine the Mode of a Variable from Raw Data
Which measure of central tendency may not exist for all numeric data sets
A) Mode
B) Median
C) Mean
D) Midrange
Which measure of central tendency may not exist for all numeric data sets
A) Mode
B) Median
C) Mean
D) Midrange
فتح الحزمة
افتح القفل للوصول البطاقات البالغ عددها 158 في هذه المجموعة.
فتح الحزمة
k this deck
49
Compute the Range of a Variable from Raw Data
فتح الحزمة
افتح القفل للوصول البطاقات البالغ عددها 158 في هذه المجموعة.
فتح الحزمة
k this deck
50
Determine the Mode of a Variable from Raw Data
Which measure of central tendency is not resistant to extreme values in a numeric data set
A) Mean
B) Mode
C) Median
D) Parameters
Which measure of central tendency is not resistant to extreme values in a numeric data set
A) Mean
B) Mode
C) Median
D) Parameters
فتح الحزمة
افتح القفل للوصول البطاقات البالغ عددها 158 في هذه المجموعة.
فتح الحزمة
k this deck
51
Provide an appropriate response.
فتح الحزمة
افتح القفل للوصول البطاقات البالغ عددها 158 في هذه المجموعة.
فتح الحزمة
k this deck
52
Compute the Range of a Variable from Raw Data
فتح الحزمة
افتح القفل للوصول البطاقات البالغ عددها 158 في هذه المجموعة.
فتح الحزمة
k this deck
53
Determine the Mode of a Variable from Raw Data
The ________ of a variable is computed by determining the sum of all the values of the variable in the data set and dividing this sum by the number of observations in the data set.
A) Arithmetic mean
B) Median
C) Mode
D) Geometric mean
The ________ of a variable is computed by determining the sum of all the values of the variable in the data set and dividing this sum by the number of observations in the data set.
A) Arithmetic mean
B) Median
C) Mode
D) Geometric mean
فتح الحزمة
افتح القفل للوصول البطاقات البالغ عددها 158 في هذه المجموعة.
فتح الحزمة
k this deck
54
Determine the Mode of a Variable from Raw Data
Which measure of central tendency may have more than one value in a numeric data set
A) Mode
B) Median
C) Mean
D) Midrange
Which measure of central tendency may have more than one value in a numeric data set
A) Mode
B) Median
C) Mean
D) Midrange
فتح الحزمة
افتح القفل للوصول البطاقات البالغ عددها 158 في هذه المجموعة.
فتح الحزمة
k this deck
55
Compute the Range of a Variable from Raw Data
فتح الحزمة
افتح القفل للوصول البطاقات البالغ عددها 158 في هذه المجموعة.
فتح الحزمة
k this deck
56
Compute the Range of a Variable from Raw Data
فتح الحزمة
افتح القفل للوصول البطاقات البالغ عددها 158 في هذه المجموعة.
فتح الحزمة
k this deck
57
Provide an appropriate response.
The ages of five randomly selected students in the biology department at a private university are 27, 26, 32, 18, and 19. Calculate the sample variance of these ages.
The ages of five randomly selected students in the biology department at a private university are 27, 26, 32, 18, and 19. Calculate the sample variance of these ages.
فتح الحزمة
افتح القفل للوصول البطاقات البالغ عددها 158 في هذه المجموعة.
فتح الحزمة
k this deck
58
Compute the Range of a Variable from Raw Data
فتح الحزمة
افتح القفل للوصول البطاقات البالغ عددها 158 في هذه المجموعة.
فتح الحزمة
k this deck
59
Determine the Mode of a Variable from Raw Data
The following data represent the bachelor degrees of CEO s at area small businesses. Determine the mode degree.
The following data represent the bachelor degrees of CEO s at area small businesses. Determine the mode degree.
فتح الحزمة
افتح القفل للوصول البطاقات البالغ عددها 158 في هذه المجموعة.
فتح الحزمة
k this deck
60
Determine the Mode of a Variable from Raw Data
The following data represent a random sample of 15 complaints registered with the customer service department of a store. Determine the mode complaint.
The following data represent a random sample of 15 complaints registered with the customer service department of a store. Determine the mode complaint.
فتح الحزمة
افتح القفل للوصول البطاقات البالغ عددها 158 في هذه المجموعة.
فتح الحزمة
k this deck
61
Provide an appropriate response.
Each year advertisers spend billions of dollars purchasing commercial time on network sports television. In the first 6 months of 1988, advertisers spent $1.1 billion. Who were the largest spenders In a recent article, listed the top 10 leading spenders (in million of dollars): Calculate the sample variance.
A) 413.26
B) 20.33
C) 39.04
D) 51.70
Each year advertisers spend billions of dollars purchasing commercial time on network sports television. In the first 6 months of 1988, advertisers spent $1.1 billion. Who were the largest spenders In a recent article, listed the top 10 leading spenders (in million of dollars):
Calculate the sample variance.A) 413.26
B) 20.33
C) 39.04
D) 51.70
فتح الحزمة
افتح القفل للوصول البطاقات البالغ عددها 158 في هذه المجموعة.
فتح الحزمة
k this deck
62
Compute the Standard Deviation of a Variable from Raw Data
8, 19, 20, 13, 14, 18, 19, 5, 10, 23
A) 5.9
B) 5.5
C) 1.7
D) 5.4
8, 19, 20, 13, 14, 18, 19, 5, 10, 23
A) 5.9
B) 5.5
C) 1.7
D) 5.4
فتح الحزمة
افتح القفل للوصول البطاقات البالغ عددها 158 في هذه المجموعة.
فتح الحزمة
k this deck
63
Compute the Standard Deviation of a Variable from Raw Data
149, 106, 114, 293, 106, 162, 224, 226, 230
A) 67.0
B) 63.2
C) 4487.9
D) 3989.2
149, 106, 114, 293, 106, 162, 224, 226, 230
A) 67.0
B) 63.2
C) 4487.9
D) 3989.2
فتح الحزمة
افتح القفل للوصول البطاقات البالغ عددها 158 في هذه المجموعة.
فتح الحزمة
k this deck
64
Provide an appropriate response.
The variance of a population is the arithmetic average of the squared deviations about the population mean.
The variance of a population is the arithmetic average of the squared deviations about the population mean.
فتح الحزمة
افتح القفل للوصول البطاقات البالغ عددها 158 في هذه المجموعة.
فتح الحزمة
k this deck
65
Compute the Standard Deviation of a Variable from Raw Data
فتح الحزمة
افتح القفل للوصول البطاقات البالغ عددها 158 في هذه المجموعة.
فتح الحزمة
k this deck
66
Provide an appropriate response.
In the computation of the sample standard variance, how many degrees of freedom are there in a data set that has 15 data values
A) 14
B) 15
C) 16
D) none of these
In the computation of the sample standard variance, how many degrees of freedom are there in a data set that has 15 data values
A) 14
B) 15
C) 16
D) none of these
فتح الحزمة
افتح القفل للوصول البطاقات البالغ عددها 158 في هذه المجموعة.
فتح الحزمة
k this deck
67
Compute the Standard Deviation of a Variable from Raw Data
8, 7, 7, 7, 12, 11, 14, 16, 14
A) 3.5
B) 3.3
C) 12.5
D) 11.1
8, 7, 7, 7, 12, 11, 14, 16, 14
A) 3.5
B) 3.3
C) 12.5
D) 11.1
فتح الحزمة
افتح القفل للوصول البطاقات البالغ عددها 158 في هذه المجموعة.
فتح الحزمة
k this deck
68
Compute the Standard Deviation of a Variable from Raw Data
فتح الحزمة
افتح القفل للوصول البطاقات البالغ عددها 158 في هذه المجموعة.
فتح الحزمة
k this deck
69
Provide an appropriate response.
A statistic is said to be biased if it
A) Systematically underestimates or overestimates a parameter
B) Has exactly the same value as the parameter
C) Is determined from a trimmed sample
D) Leads to an erroneous conclusion about the sample
A statistic is said to be biased if it
A) Systematically underestimates or overestimates a parameter
B) Has exactly the same value as the parameter
C) Is determined from a trimmed sample
D) Leads to an erroneous conclusion about the sample
فتح الحزمة
افتح القفل للوصول البطاقات البالغ عددها 158 في هذه المجموعة.
فتح الحزمة
k this deck
70
Compute the Standard Deviation of a Variable from Raw Data
فتح الحزمة
افتح القفل للوصول البطاقات البالغ عددها 158 في هذه المجموعة.
فتح الحزمة
k this deck
71
Provide an appropriate response.
Variance is the square root of standard deviation.
Variance is the square root of standard deviation.
فتح الحزمة
افتح القفل للوصول البطاقات البالغ عددها 158 في هذه المجموعة.
فتح الحزمة
k this deck
72
Provide an appropriate response.
For the data set given below the sample variance will be computed. How many degrees of freedom are there
A) 8
B) 9
C) 1
D) 10
For the data set given below the sample variance will be computed. How many degrees of freedom are there
A) 8
B) 9
C) 1
D) 10
فتح الحزمة
افتح القفل للوصول البطاقات البالغ عددها 158 في هذه المجموعة.
فتح الحزمة
k this deck
73
Compute the Standard Deviation of a Variable from Raw Data
فتح الحزمة
افتح القفل للوصول البطاقات البالغ عددها 158 في هذه المجموعة.
فتح الحزمة
k this deck
74
Compute the Standard Deviation of a Variable from Raw Data
Last year batting averages in professional baseball averaged 0.261 with a high of 0.333 and a low of 0.224 (minimum 250 at-bats). Based on this information, which measure of variation could be calculated
A) range
B) variance
C) standard deviation
D) percentile
Last year batting averages in professional baseball averaged 0.261 with a high of 0.333 and a low of 0.224 (minimum 250 at-bats). Based on this information, which measure of variation could be calculated
A) range
B) variance
C) standard deviation
D) percentile
فتح الحزمة
افتح القفل للوصول البطاقات البالغ عددها 158 في هذه المجموعة.
فتح الحزمة
k this deck
75
Compute the Standard Deviation of a Variable from Raw Data
فتح الحزمة
افتح القفل للوصول البطاقات البالغ عددها 158 في هذه المجموعة.
فتح الحزمة
k this deck
76
Compute the Standard Deviation of a Variable from Raw Data
3, 3, 14, 11, 11, 20, 14, 10, 14
A) 5.4
B) 5.1
C) 29.6
D) 26.3
3, 3, 14, 11, 11, 20, 14, 10, 14
A) 5.4
B) 5.1
C) 29.6
D) 26.3
فتح الحزمة
افتح القفل للوصول البطاقات البالغ عددها 158 في هذه المجموعة.
فتح الحزمة
k this deck
77
Compute the Standard Deviation of a Variable from Raw Data
Which is not a measure of dispersion
A) Mean
B) Standard deviation
C) Variance
D) Range
Which is not a measure of dispersion
A) Mean
B) Standard deviation
C) Variance
D) Range
فتح الحزمة
افتح القفل للوصول البطاقات البالغ عددها 158 في هذه المجموعة.
فتح الحزمة
k this deck
78
Compute the Standard Deviation of a Variable from Raw Data
فتح الحزمة
افتح القفل للوصول البطاقات البالغ عددها 158 في هذه المجموعة.
فتح الحزمة
k this deck
79
Compute the Standard Deviation of a Variable from Raw Data
81, 75, 44, 63, 42, 30, 64, 76, 88
A) 19.9
B) 17.8
C) 350.2
D) 315.2
81, 75, 44, 63, 42, 30, 64, 76, 88
A) 19.9
B) 17.8
C) 350.2
D) 315.2
فتح الحزمة
افتح القفل للوصول البطاقات البالغ عددها 158 في هذه المجموعة.
فتح الحزمة
k this deck
80
Compute the Standard Deviation of a Variable from Raw Data
فتح الحزمة
افتح القفل للوصول البطاقات البالغ عددها 158 في هذه المجموعة.
فتح الحزمة
k this deck
فتح الحزمة
افتح القفل للوصول البطاقات البالغ عددها 158 في هذه المجموعة.


