Deck 12: Control Charts and Process Monitoring
ملء الشاشة (f)
سؤال
Examine the given run chart or control chart and determine whether the process is within
statistical control. If it is not, identity which of the three out-of-statistical-control criteria
apply. A run chart for individual values W is shown below. Does there appear to be a pattern
suggesting that the process is not within statistical control? If so, describe the pattern.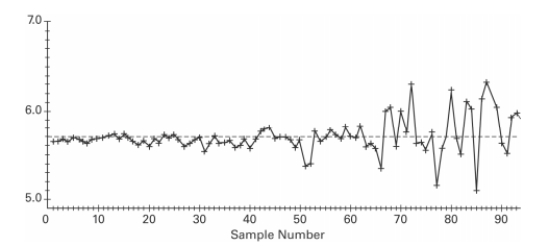
statistical control. If it is not, identity which of the three out-of-statistical-control criteria
apply. A run chart for individual values W is shown below. Does there appear to be a pattern
suggesting that the process is not within statistical control? If so, describe the pattern.
سؤال
سؤال
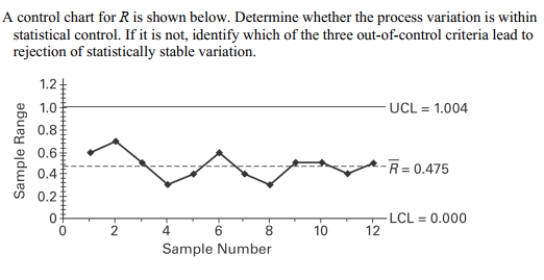
A control chart for R is shown below. Determine whether the process variation is within
statistical control. If it is not, identify which of the three out-of-control criteria lead to rejection
of statistically stable variation.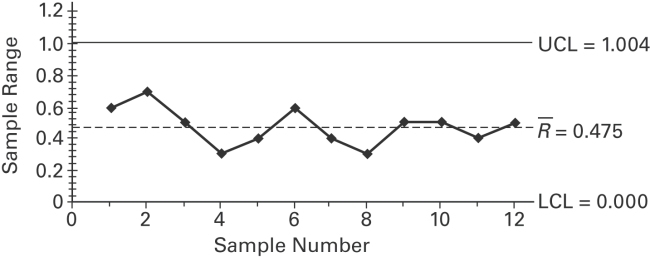
statistical control. If it is not, identify which of the three out-of-control criteria lead to rejection
of statistically stable variation.
سؤال
Examine the given run chart or control chart and determine whether the process is within
statistical control. If it is not, identify which of the three out-of-statistical-control criteria apply.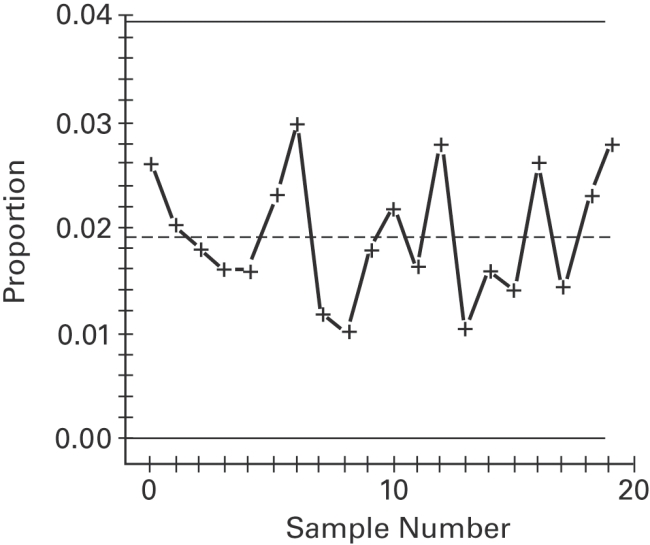
statistical control. If it is not, identify which of the three out-of-statistical-control criteria apply.
سؤال
سؤال
Use the given process data to construct a control chart for p. If the weight of cereal in a
particular packet is less than 14 ounces, the packet is considered nonconforming. Each week,
the manufacturer randomly selects 1,000 cereal packets and determines the number that are
nonconforming. The results for 12 consecutive weeks are shown below.
particular packet is less than 14 ounces, the packet is considered nonconforming. Each week,
the manufacturer randomly selects 1,000 cereal packets and determines the number that are
nonconforming. The results for 12 consecutive weeks are shown below.
سؤال
Use the given process data to construct a control chart for p. A manufacturer monitors the level
of defects in the television sets that it produces. Each week, 200 television sets are randomly
selected and tested and the number of defects is recorded. The results for 12 consecutive weeks
are shown below.
of defects in the television sets that it produces. Each week, 200 television sets are randomly
selected and tested and the number of defects is recorded. The results for 12 consecutive weeks
are shown below.
سؤال
Construct an R chart and determine whether the process variation is within statistical control. 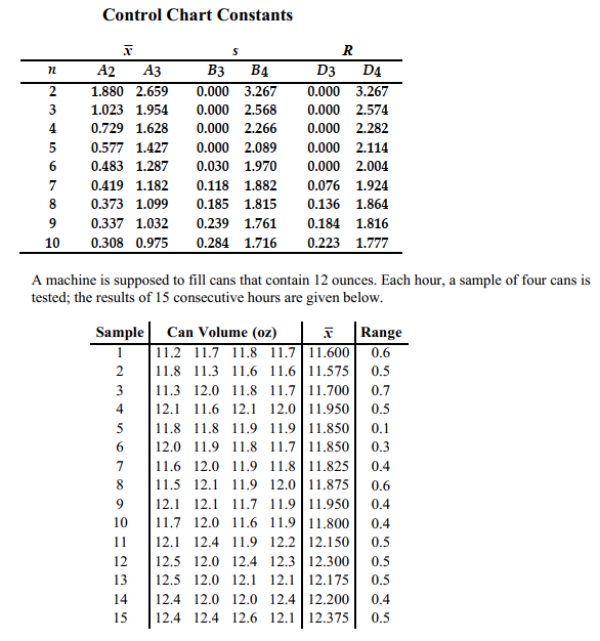
سؤال
سؤال
سؤال
Examine the given run chart or control chart and determine whether the process is within
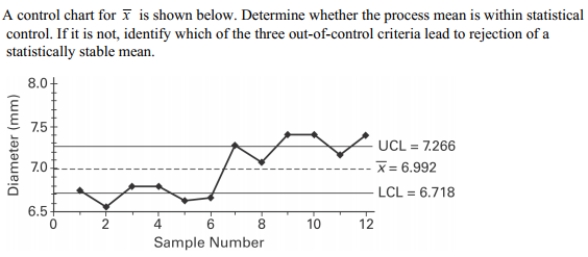
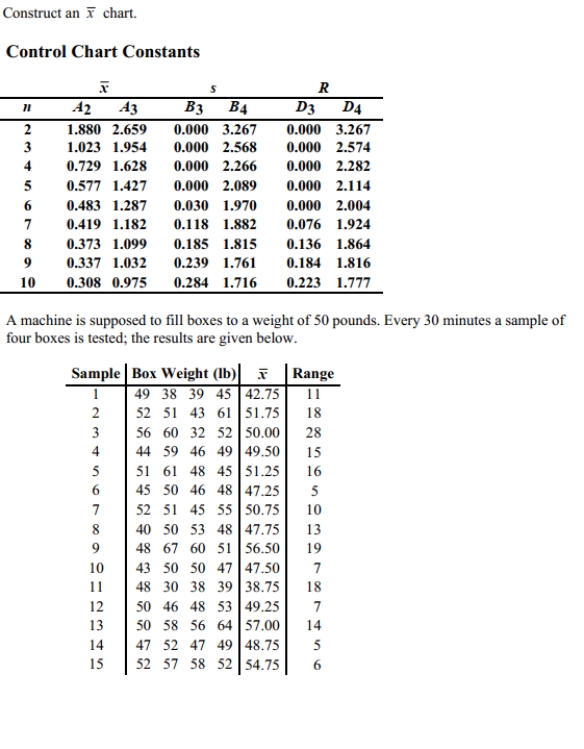
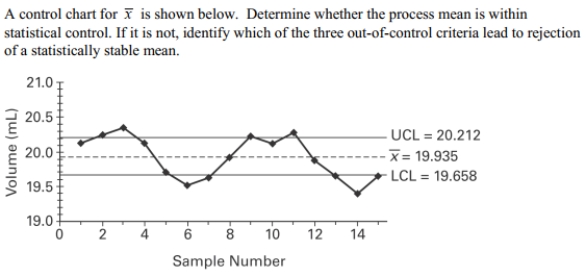
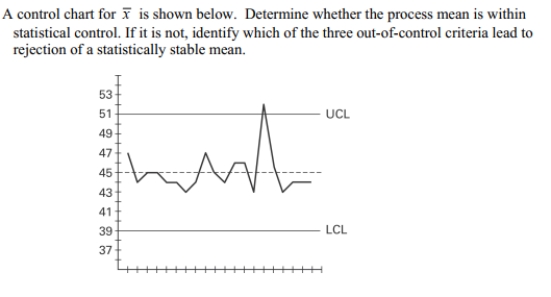
statistical control. If it is not, identify which of the three out-of-statistical-control criteria apply.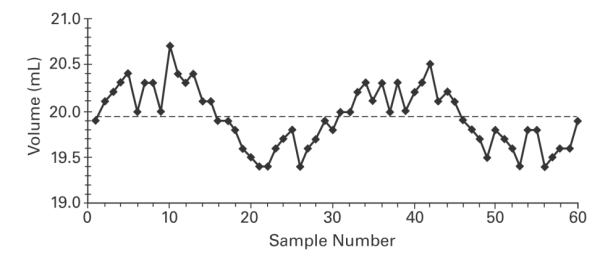 x is shown below. Determine whether the process mean is within statistical
statistical control. If it is not, identify which of the three out-of-statistical-control criteria apply.
x is shown below. Determine whether the process mean is within statistical سؤال
سؤال
 .
. سؤال
سؤال
Construct a run chart for individual values corresponding to the given data. A machine is
supposed to fill boxes to a weight of 50 pounds. Every 30 minutes a sample of four boxes is
tested; the results are given below.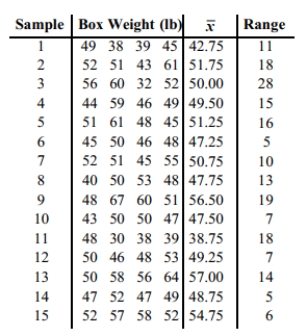
supposed to fill boxes to a weight of 50 pounds. Every 30 minutes a sample of four boxes is
tested; the results are given below.
سؤال
سؤال
سؤال
سؤال
سؤال
Construct an R chart and determine whether the process variation is within statistical control. 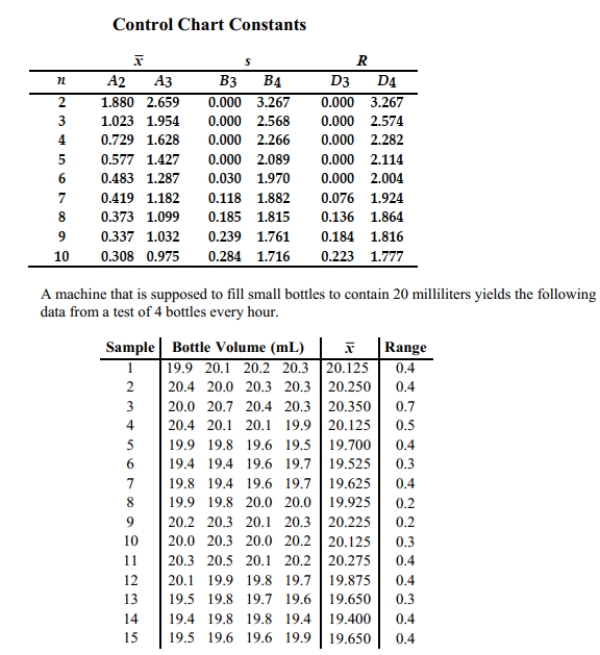
سؤال
سؤال
سؤال
Use the given process data to construct a control chart for p. A manufacturer monitors the level
of defects in the television sets that it produces. Each week, 200 television sets are randomly
selected and tested and the number of defects is recorded. The results for 12 consecutive weeks
are shown below.
of defects in the television sets that it produces. Each week, 200 television sets are randomly
selected and tested and the number of defects is recorded. The results for 12 consecutive weeks
are shown below.
سؤال
سؤال
سؤال
Use the given process data to construct a control chart for p. A drugstore considers a wait of
more than 5 minutes to be a defect. Each week 100 customers are randomly selected and
timed at the checkout line. The numbers of defects for 20 consecutive weeks are given below.
more than 5 minutes to be a defect. Each week 100 customers are randomly selected and
timed at the checkout line. The numbers of defects for 20 consecutive weeks are given below.
سؤال
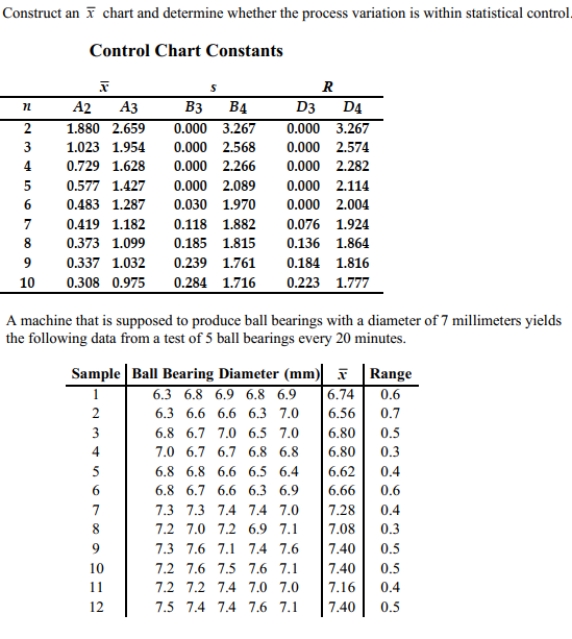
Construct a run chart for individual values corresponding to the given data. A machine that is
supposed to produce ball bearings with a diameter of 7 millimeters yields the following data
from a test of 5 ball bearings every 20 minutes.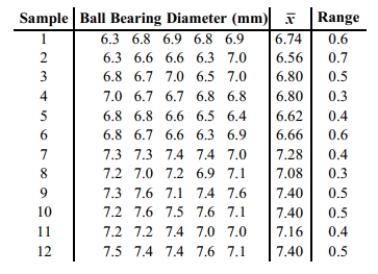
supposed to produce ball bearings with a diameter of 7 millimeters yields the following data
from a test of 5 ball bearings every 20 minutes.
سؤال
Examine the given run chart or control chart and determine whether the process is within
statistical control. If it is not, identify which of the three out-of-statistical-control criteria
apply.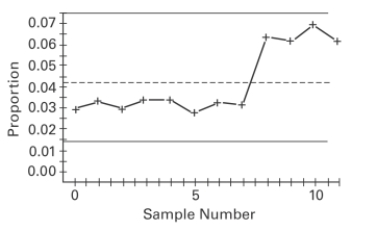
statistical control. If it is not, identify which of the three out-of-statistical-control criteria
apply.
سؤال
سؤال
سؤال
Match the chart with its characteristic. 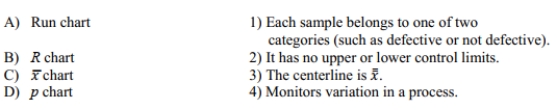
سؤال
سؤال
Examine the given run chart or control chart and determine whether the process is
within statistical control. If it is not, identify which of the three out-of-statistical-control
criteria apply.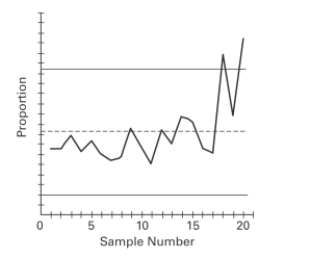
within statistical control. If it is not, identify which of the three out-of-statistical-control
criteria apply.
سؤال
Construct an R chart and determine whether the process variation is within statistical control. 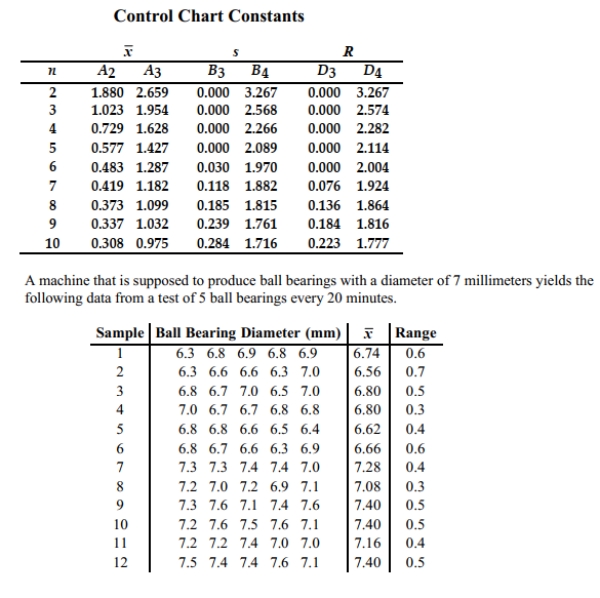
سؤال
سؤال
سؤال
Examine the given run chart or control chart and determine whether the process is within
statistical control. If it is not, identify which of the three out-of-statistical-control criteria apply.
statistical control. If it is not, identify which of the three out-of-statistical-control criteria apply.
سؤال
سؤال
A run chart for individual values is shown below. Does there appear to be a pattern suggesting
that the process is not within statistical control? If so, describe the pattern.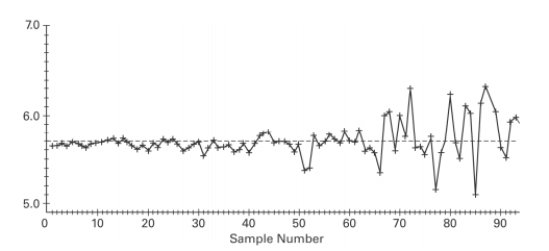
that the process is not within statistical control? If so, describe the pattern.
سؤال
سؤال
Examine the given run chart or control chart and determine whether the process is within statistical control. 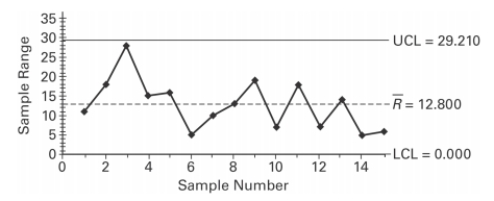
A) The process is within statistical control.
B) The process is not within statistical control.
A) The process is within statistical control.
B) The process is not within statistical control.
سؤال
سؤال
سؤال
Use the given process data to construct a control chart for p. A drugstore considers a wait of more than 5 minutes to be a defect. Each week 100 customers are randomly selected and
Timed at the checkout line. The numbers of defects for 20 consecutive weeks are given below.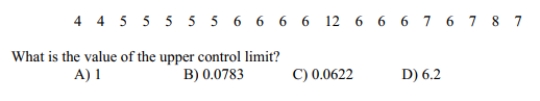
Timed at the checkout line. The numbers of defects for 20 consecutive weeks are given below.
سؤال
Examine the given run chart or control chart and determine whether the process is within statistical control. 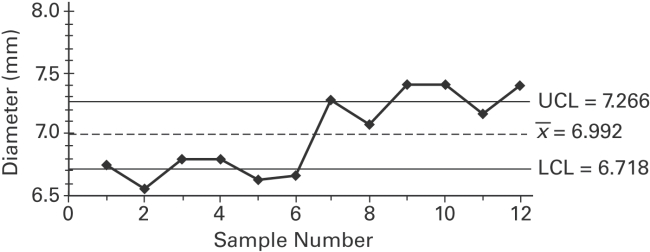
A) The process is within statistical control.
B) The process is not within statistical control.
A) The process is within statistical control.
B) The process is not within statistical control.
سؤال
Which type of chart does not have control limits?
A) Run chart
B) R chart
C)
D) p chart
A) Run chart
B) R chart
C)
D) p chart
سؤال
A manufacturer of lightbulbs picks 10 lightbulbs at random each day for quality control. The mean and range (in hours)of the lifetimes of the 10 lightbulbs are calculated. The results for
12 consecutive days are shown in the table below. Construct an R chart to determine whether
The process is in statistical control.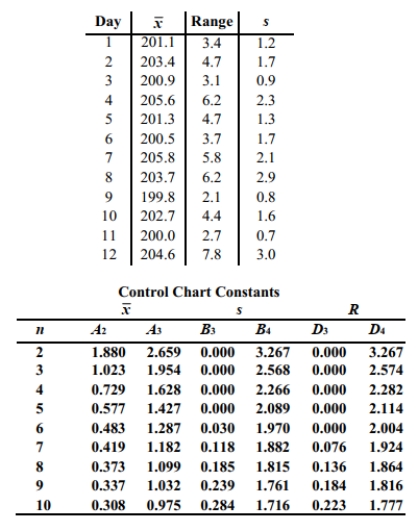
A) The process is within statistical control.
B) The process is not within statistical control.
12 consecutive days are shown in the table below. Construct an R chart to determine whether
The process is in statistical control.
A) The process is within statistical control.
B) The process is not within statistical control.
سؤال
سؤال
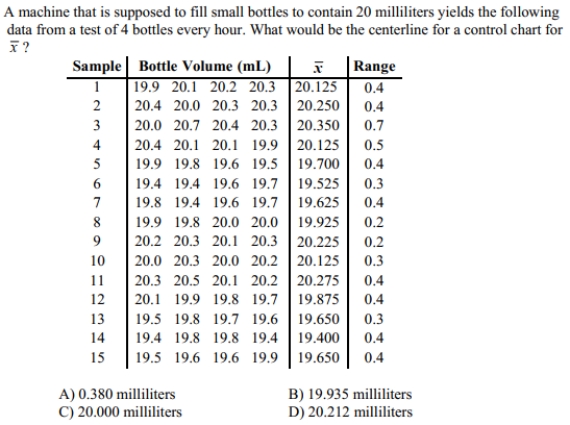
A machine is supposed to fill boxes to a weight of 50 pounds. Every 30 minutes a sample of four boxes is tested; the results are given below.
What would be the value of the centerline that would be used in creating an R chart?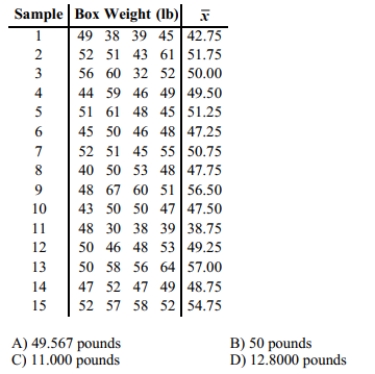
What would be the value of the centerline that would be used in creating an R chart?
سؤال
Examine the given run chart or control chart and determine whether the process is within statistical control. 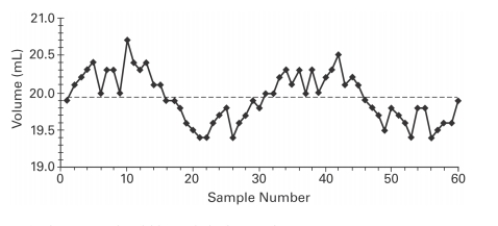
A) The process is within statistical control.
B) The process is not within statistical control.
A) The process is within statistical control.
B) The process is not within statistical control.
سؤال
سؤال
Consider process data consisting of the amounts of potato chips (in ounces)in randomly selected bags of chips. The process is to be monitored with  control charts based on samples
Of 50 bags randomly selected each day for 15 consecutive days of production. What does denote?
A) The mean of 50 bags.
B) The mean of all 15 sample means.
C) The mean of the ranges for the 15 days.
D) The mean of the standard deviations for the 15 days.
control charts based on samplesOf 50 bags randomly selected each day for 15 consecutive days of production. What does
denote?A) The mean of 50 bags.
B) The mean of all 15 sample means.
C) The mean of the ranges for the 15 days.
D) The mean of the standard deviations for the 15 days.
سؤال
سؤال
سؤال
Which graph using individual data values instead of a process characteristic? 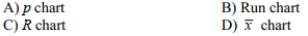
سؤال
Which type of chart would be best for monitoring the proportion of items that are defective? 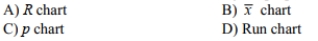
سؤال
Use the given process data to construct a control chart for p. A candy manufacturer considers a cracked piece of candy to be a defect. Each day 100 candies are randomly selected and
Checked for cracks. The numbers of defects for 20 consecutive days are given below.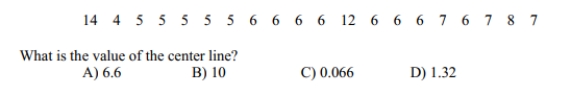
Checked for cracks. The numbers of defects for 20 consecutive days are given below.
سؤال
سؤال
سؤال
Examine the given run chart or control chart and determine whether the process is within statistical control. 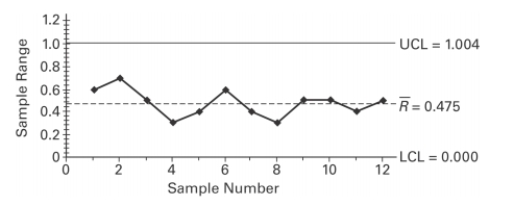
A) The process is within statistical control.
B) The process is not within statistical control.
A) The process is within statistical control.
B) The process is not within statistical control.
سؤال
Use a 0.05 level of significance to test the claim that the sequence of computer -generated
numbers is random. Test for randomness above and below the mean.
numbers is random. Test for randomness above and below the mean.
سؤال
سؤال
Use the Wilcoxon rank-sum test to test the claim that the two independent samples come from
populations with equal medians. Use the Wilcoxon rank-sum approach to test the claim that
the sample student grade averages at two colleges come from populations with the same
median. The sample data is listed below. Use a 0.05 level of significance, and assume that the
samples were randomly selected.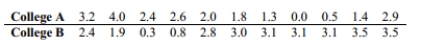
سؤال
سؤال
Use the Wilcoxon rank-sum test to test the claim that the two independent samples come from
populations with equal medians. SAT scores for students selected randomly from two different
schools are shown below. Use a significance level of 0.05 to test the claim that the scores for
the two schools are from populations with the same median.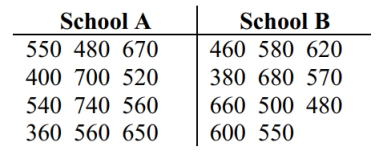
populations with equal medians. SAT scores for students selected randomly from two different
schools are shown below. Use a significance level of 0.05 to test the claim that the scores for
the two schools are from populations with the same median.
سؤال
A standard aptitude test is given to several randomly selected programmers, and the scores are
given below for the mathematics and verbal portions of the test. Use the sign test to test the
claim that programmers do better on the mathematics portion of the test. Use a 0.05 level of
significance.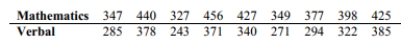
given below for the mathematics and verbal portions of the test. Use the sign test to test the
claim that programmers do better on the mathematics portion of the test. Use a 0.05 level of
significance.
سؤال
Use the runs test to determine whether the given sequence is random. Use a significance level
of 0.05. The sequence of numbers below represents the maximum temperature (in degrees
Fahrenheit)in July in one U.S. town for 30 consecutive years. Test the sequence for
randomness above and below the median.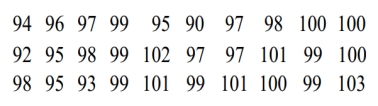
of 0.05. The sequence of numbers below represents the maximum temperature (in degrees
Fahrenheit)in July in one U.S. town for 30 consecutive years. Test the sequence for
randomness above and below the median.
سؤال
سؤال
Use the rank correlation coefficient to test for a correlation between the two variables. A
placement test is required for students desiring to take a finite mathematics course at a
university. The instructor of the course studies the relationship between students' placement
test score and final course score. A random sample of eight students yields the following data.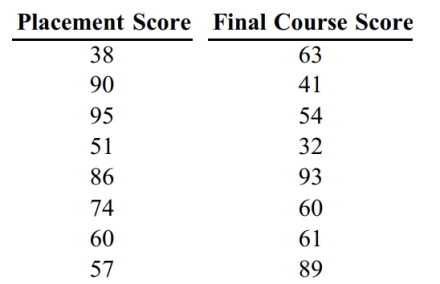 Compute the rank correlation coefficient, rs, of the data and test the claim of correlation
between placement score and final course score. Use a significance level of 0.05.
placement test is required for students desiring to take a finite mathematics course at a
university. The instructor of the course studies the relationship between students' placement
test score and final course score. A random sample of eight students yields the following data.
Compute the rank correlation coefficient, rs, of the data and test the claim of correlationbetween placement score and final course score. Use a significance level of 0.05.
سؤال
Use the runs test to determine whether the given sequence is random. Use a significance level
of 0.05. A true-false test had the following answer sequence.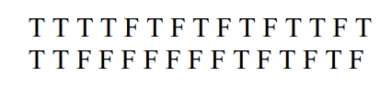 Test the null hypothesis that the sequence was random.
of 0.05. A true-false test had the following answer sequence.
Test the null hypothesis that the sequence was random. سؤال
سؤال
Use a Kruskal-Wallis test to test the claim that the samples come from populations with equal
medians. Listed below are grade averages for randomly selected students with three different
categories of high-school background. At the 0.05 level of significance, test the claim that the
three groups have the same median grade average.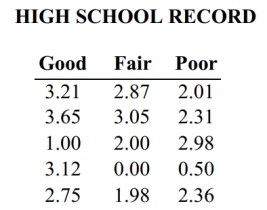
medians. Listed below are grade averages for randomly selected students with three different
categories of high-school background. At the 0.05 level of significance, test the claim that the
three groups have the same median grade average.
سؤال
سؤال
Use the sign test to test the indicated claim. Fourteen people rated two brands of soda on a scale
of 1 to 5.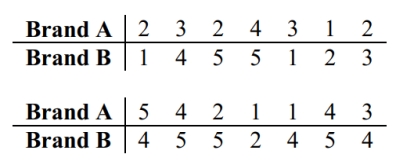 At the 5 percent level, test the null hypothesis that the two brands of soda are equally popular.
of 1 to 5.
At the 5 percent level, test the null hypothesis that the two brands of soda are equally popular. سؤال
سؤال
سؤال
Use the sign test to test the indicated claim. The heights of 16 randomly selected women are
given below. Use a significance level of 0.05 to test the claim that the population median is
equal to 64.0 inches.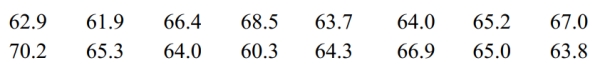
given below. Use a significance level of 0.05 to test the claim that the population median is
equal to 64.0 inches.
سؤال
سؤال
Describe the rank correlation test. What types of hypotheses is it used to test? How does the
rank correlation coefficient differ from the Pearson correlation coefficient r?
rank correlation coefficient
differ from the Pearson correlation coefficient r? سؤال

فتح الحزمة
قم بالتسجيل لفتح البطاقات في هذه المجموعة!
Unlock Deck
Unlock Deck
1/178
العب
ملء الشاشة (f)
Deck 12: Control Charts and Process Monitoring
1
Examine the given run chart or control chart and determine whether the process is within
statistical control. If it is not, identity which of the three out-of-statistical-control criteria
apply. A run chart for individual values W is shown below. Does there appear to be a pattern
suggesting that the process is not within statistical control? If so, describe the pattern.
statistical control. If it is not, identity which of the three out-of-statistical-control criteria
apply. A run chart for individual values W is shown below. Does there appear to be a pattern
suggesting that the process is not within statistical control? If so, describe the pattern.
The process appears to be out of statistical control. The variation is increasing over time.
2
Describe an R chart and give an example. What does it attempt to monitor?
An R chart is a sequential plot of sample ranges over time. The horizontal axis is used for time, and the vertical axis
is used for the ranges of the samples. Examples will vary. An R chart attempts to monitor variation.
is used for the ranges of the samples. Examples will vary. An R chart attempts to monitor variation.
3
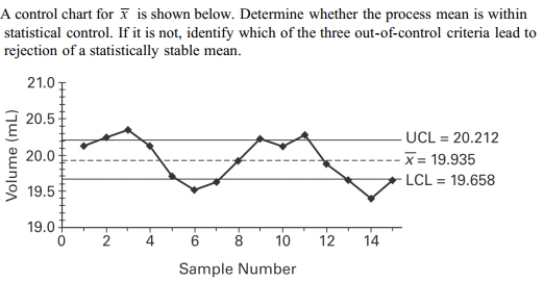
A control chart for R is shown below. Determine whether the process variation is within
statistical control. If it is not, identify which of the three out-of-control criteria lead to rejection
of statistically stable variation.
statistical control. If it is not, identify which of the three out-of-control criteria lead to rejection
of statistically stable variation.
The process variation appears to be in statistical control.
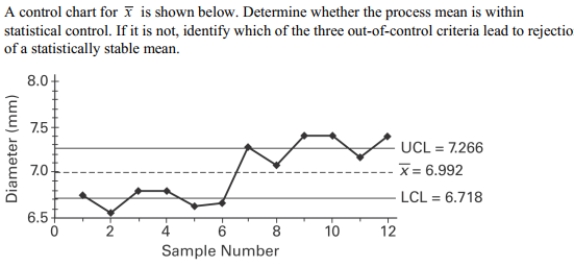
4
Examine the given run chart or control chart and determine whether the process is within
statistical control. If it is not, identify which of the three out-of-statistical-control criteria apply.
statistical control. If it is not, identify which of the three out-of-statistical-control criteria apply.
فتح الحزمة
افتح القفل للوصول البطاقات البالغ عددها 178 في هذه المجموعة.
فتح الحزمة
k this deck
5
فتح الحزمة
افتح القفل للوصول البطاقات البالغ عددها 178 في هذه المجموعة.
فتح الحزمة
k this deck
6
Use the given process data to construct a control chart for p. If the weight of cereal in a
particular packet is less than 14 ounces, the packet is considered nonconforming. Each week,
the manufacturer randomly selects 1,000 cereal packets and determines the number that are
nonconforming. The results for 12 consecutive weeks are shown below.
particular packet is less than 14 ounces, the packet is considered nonconforming. Each week,
the manufacturer randomly selects 1,000 cereal packets and determines the number that are
nonconforming. The results for 12 consecutive weeks are shown below.
فتح الحزمة
افتح القفل للوصول البطاقات البالغ عددها 178 في هذه المجموعة.
فتح الحزمة
k this deck
7
Use the given process data to construct a control chart for p. A manufacturer monitors the level
of defects in the television sets that it produces. Each week, 200 television sets are randomly
selected and tested and the number of defects is recorded. The results for 12 consecutive weeks
are shown below.
of defects in the television sets that it produces. Each week, 200 television sets are randomly
selected and tested and the number of defects is recorded. The results for 12 consecutive weeks
are shown below.
فتح الحزمة
افتح القفل للوصول البطاقات البالغ عددها 178 في هذه المجموعة.
فتح الحزمة
k this deck
8
Construct an R chart and determine whether the process variation is within statistical control.
فتح الحزمة
افتح القفل للوصول البطاقات البالغ عددها 178 في هذه المجموعة.
فتح الحزمة
k this deck
9
A common goal of quality control is to reduce variation in a product or service. List and
describe the two types of variability. Give an example of each.
describe the two types of variability. Give an example of each.
فتح الحزمة
افتح القفل للوصول البطاقات البالغ عددها 178 في هذه المجموعة.
فتح الحزمة
k this deck
10
Are control charts based on actual behavior or on desired behavior? Give an example to
illustrate the difference between the two types of behavior.
illustrate the difference between the two types of behavior.
فتح الحزمة
افتح القفل للوصول البطاقات البالغ عددها 178 في هذه المجموعة.
فتح الحزمة
k this deck
11
Examine the given run chart or control chart and determine whether the process is within
statistical control. If it is not, identify which of the three out-of-statistical-control criteria apply. x is shown below. Determine whether the process mean is within statistical
statistical control. If it is not, identify which of the three out-of-statistical-control criteria apply.
x is shown below. Determine whether the process mean is within statistical فتح الحزمة
افتح القفل للوصول البطاقات البالغ عددها 178 في هذه المجموعة.
فتح الحزمة
k this deck
12
فتح الحزمة
افتح القفل للوصول البطاقات البالغ عددها 178 في هذه المجموعة.
فتح الحزمة
k this deck
13
. فتح الحزمة
افتح القفل للوصول البطاقات البالغ عددها 178 في هذه المجموعة.
فتح الحزمة
k this deck
14
Define statistically stable (or "within statistical control"). Show examples of run charts which
illustrate processes which are not statistically controlled. Discuss the pattern which indicates
the process is not statistically controlled for each example.
illustrate processes which are not statistically controlled. Discuss the pattern which indicates
the process is not statistically controlled for each example.
فتح الحزمة
افتح القفل للوصول البطاقات البالغ عددها 178 في هذه المجموعة.
فتح الحزمة
k this deck
15
Construct a run chart for individual values corresponding to the given data. A machine is
supposed to fill boxes to a weight of 50 pounds. Every 30 minutes a sample of four boxes is
tested; the results are given below.
supposed to fill boxes to a weight of 50 pounds. Every 30 minutes a sample of four boxes is
tested; the results are given below.
فتح الحزمة
افتح القفل للوصول البطاقات البالغ عددها 178 في هذه المجموعة.
فتح الحزمة
k this deck
16
Describe the three criteria used to determine if a control chart indicates a process which is not
statistically stable.
statistically stable.
فتح الحزمة
افتح القفل للوصول البطاقات البالغ عددها 178 في هذه المجموعة.
فتح الحزمة
k this deck
17
Provide an appropriate response. Describe what process data are. Why are process data
important to businesses? What is a common goal of businesses using quality control?
important to businesses? What is a common goal of businesses using quality control?
فتح الحزمة
افتح القفل للوصول البطاقات البالغ عددها 178 في هذه المجموعة.
فتح الحزمة
k this deck
18
Describe a run chart and give an example. Refer to the values on each of the axes as you
describe the run chart.
describe the run chart.
فتح الحزمة
افتح القفل للوصول البطاقات البالغ عددها 178 في هذه المجموعة.
فتح الحزمة
k this deck
19
Sketch a control chart that indicates that a process is not statistically stable due to the run of 8
rule.
rule.
فتح الحزمة
افتح القفل للوصول البطاقات البالغ عددها 178 في هذه المجموعة.
فتح الحزمة
k this deck
20
Construct an R chart and determine whether the process variation is within statistical control.
فتح الحزمة
افتح القفل للوصول البطاقات البالغ عددها 178 في هذه المجموعة.
فتح الحزمة
k this deck
21
Define statistically stable (or "within statistical control"). Show examples of run charts which
illustrate processes which are not statistically controlled. Discuss the pattern which indicates
the process is not statistically controlled for each example.
illustrate processes which are not statistically controlled. Discuss the pattern which indicates
the process is not statistically controlled for each example.
فتح الحزمة
افتح القفل للوصول البطاقات البالغ عددها 178 في هذه المجموعة.
فتح الحزمة
k this deck
22
فتح الحزمة
افتح القفل للوصول البطاقات البالغ عددها 178 في هذه المجموعة.
فتح الحزمة
k this deck
23
Use the given process data to construct a control chart for p. A manufacturer monitors the level
of defects in the television sets that it produces. Each week, 200 television sets are randomly
selected and tested and the number of defects is recorded. The results for 12 consecutive weeks
are shown below.
of defects in the television sets that it produces. Each week, 200 television sets are randomly
selected and tested and the number of defects is recorded. The results for 12 consecutive weeks
are shown below.
فتح الحزمة
افتح القفل للوصول البطاقات البالغ عددها 178 في هذه المجموعة.
فتح الحزمة
k this deck
24
Describe the three criteria used to determine if a control chart indicates a process which is not
statistically stable.
statistically stable.
فتح الحزمة
افتح القفل للوصول البطاقات البالغ عددها 178 في هذه المجموعة.
فتح الحزمة
k this deck
25
Provide an appropriate response. A common goal of quality control is to reduce variation in a
product or service. List and describe the two types of variability. Give an example of each.
product or service. List and describe the two types of variability. Give an example of each.
فتح الحزمة
افتح القفل للوصول البطاقات البالغ عددها 178 في هذه المجموعة.
فتح الحزمة
k this deck
26
Use the given process data to construct a control chart for p. A drugstore considers a wait of
more than 5 minutes to be a defect. Each week 100 customers are randomly selected and
timed at the checkout line. The numbers of defects for 20 consecutive weeks are given below.
more than 5 minutes to be a defect. Each week 100 customers are randomly selected and
timed at the checkout line. The numbers of defects for 20 consecutive weeks are given below.
فتح الحزمة
افتح القفل للوصول البطاقات البالغ عددها 178 في هذه المجموعة.
فتح الحزمة
k this deck
27
Construct a run chart for individual values corresponding to the given data. A machine that is
supposed to produce ball bearings with a diameter of 7 millimeters yields the following data
from a test of 5 ball bearings every 20 minutes.
supposed to produce ball bearings with a diameter of 7 millimeters yields the following data
from a test of 5 ball bearings every 20 minutes.
فتح الحزمة
افتح القفل للوصول البطاقات البالغ عددها 178 في هذه المجموعة.
فتح الحزمة
k this deck
28
Examine the given run chart or control chart and determine whether the process is within
statistical control. If it is not, identify which of the three out-of-statistical-control criteria
apply.
statistical control. If it is not, identify which of the three out-of-statistical-control criteria
apply.
فتح الحزمة
افتح القفل للوصول البطاقات البالغ عددها 178 في هذه المجموعة.
فتح الحزمة
k this deck
29
فتح الحزمة
افتح القفل للوصول البطاقات البالغ عددها 178 في هذه المجموعة.
فتح الحزمة
k this deck
30
Sketch a run chart that that indicates that a process is not statistically stable due to increasing
variation.
variation.
فتح الحزمة
افتح القفل للوصول البطاقات البالغ عددها 178 في هذه المجموعة.
فتح الحزمة
k this deck
31
Match the chart with its characteristic.
فتح الحزمة
افتح القفل للوصول البطاقات البالغ عددها 178 في هذه المجموعة.
فتح الحزمة
k this deck
32
A control chart for attributes is to be constructed.
limits, a process which has been having a 5% rate of nonconforming items, or a process which
has been having a 10% of nonconforming items? Assume that both processes have the same
sample sizes. For a given sample size, would it be easier to detect a shift from 5% to 10% or a
shift from 10% to 15%? Explain your reasoning.
فتح الحزمة
افتح القفل للوصول البطاقات البالغ عددها 178 في هذه المجموعة.
فتح الحزمة
k this deck
33
Examine the given run chart or control chart and determine whether the process is
within statistical control. If it is not, identify which of the three out-of-statistical-control
criteria apply.
within statistical control. If it is not, identify which of the three out-of-statistical-control
criteria apply.
فتح الحزمة
افتح القفل للوصول البطاقات البالغ عددها 178 في هذه المجموعة.
فتح الحزمة
k this deck
34
Construct an R chart and determine whether the process variation is within statistical control.
فتح الحزمة
افتح القفل للوصول البطاقات البالغ عددها 178 في هذه المجموعة.
فتح الحزمة
k this deck
35
فتح الحزمة
افتح القفل للوصول البطاقات البالغ عددها 178 في هذه المجموعة.
فتح الحزمة
k this deck
36
فتح الحزمة
افتح القفل للوصول البطاقات البالغ عددها 178 في هذه المجموعة.
فتح الحزمة
k this deck
37
Examine the given run chart or control chart and determine whether the process is within
statistical control. If it is not, identify which of the three out-of-statistical-control criteria apply.
statistical control. If it is not, identify which of the three out-of-statistical-control criteria apply.
فتح الحزمة
افتح القفل للوصول البطاقات البالغ عددها 178 في هذه المجموعة.
فتح الحزمة
k this deck
38
Describe a p chart and give an example. What does it attempt to monitor?
فتح الحزمة
افتح القفل للوصول البطاقات البالغ عددها 178 في هذه المجموعة.
فتح الحزمة
k this deck
39
A run chart for individual values is shown below. Does there appear to be a pattern suggesting
that the process is not within statistical control? If so, describe the pattern.
that the process is not within statistical control? If so, describe the pattern.
فتح الحزمة
افتح القفل للوصول البطاقات البالغ عددها 178 في هذه المجموعة.
فتح الحزمة
k this deck
40
فتح الحزمة
افتح القفل للوصول البطاقات البالغ عددها 178 في هذه المجموعة.
فتح الحزمة
k this deck
41
Examine the given run chart or control chart and determine whether the process is within statistical control.
A) The process is within statistical control.
B) The process is not within statistical control.
A) The process is within statistical control.
B) The process is not within statistical control.
فتح الحزمة
افتح القفل للوصول البطاقات البالغ عددها 178 في هذه المجموعة.
فتح الحزمة
k this deck
42
فتح الحزمة
افتح القفل للوصول البطاقات البالغ عددها 178 في هذه المجموعة.
فتح الحزمة
k this deck
43
The centerline for a control chart for R consists of _______________.
A) the mean of the sample ranges
B) the mean of the sample data
C) the median
D) the standard deviation
A) the mean of the sample ranges
B) the mean of the sample data
C) the median
D) the standard deviation
فتح الحزمة
افتح القفل للوصول البطاقات البالغ عددها 178 في هذه المجموعة.
فتح الحزمة
k this deck
44
Use the given process data to construct a control chart for p. A drugstore considers a wait of more than 5 minutes to be a defect. Each week 100 customers are randomly selected and
Timed at the checkout line. The numbers of defects for 20 consecutive weeks are given below.
Timed at the checkout line. The numbers of defects for 20 consecutive weeks are given below.
فتح الحزمة
افتح القفل للوصول البطاقات البالغ عددها 178 في هذه المجموعة.
فتح الحزمة
k this deck
45
Examine the given run chart or control chart and determine whether the process is within statistical control.
A) The process is within statistical control.
B) The process is not within statistical control.
A) The process is within statistical control.
B) The process is not within statistical control.
فتح الحزمة
افتح القفل للوصول البطاقات البالغ عددها 178 في هذه المجموعة.
فتح الحزمة
k this deck
46
Which type of chart does not have control limits?
A) Run chart
B) R chart
C)
D) p chart
A) Run chart
B) R chart
C)
D) p chart
فتح الحزمة
افتح القفل للوصول البطاقات البالغ عددها 178 في هذه المجموعة.
فتح الحزمة
k this deck
47
A manufacturer of lightbulbs picks 10 lightbulbs at random each day for quality control. The mean and range (in hours)of the lifetimes of the 10 lightbulbs are calculated. The results for
12 consecutive days are shown in the table below. Construct an R chart to determine whether
The process is in statistical control.
A) The process is within statistical control.
B) The process is not within statistical control.
12 consecutive days are shown in the table below. Construct an R chart to determine whether
The process is in statistical control.
A) The process is within statistical control.
B) The process is not within statistical control.
فتح الحزمة
افتح القفل للوصول البطاقات البالغ عددها 178 في هذه المجموعة.
فتح الحزمة
k this deck
48
R charts are used to monitor_____________.
A) means
B) proportions
C) variation
D) correlation
A) means
B) proportions
C) variation
D) correlation
فتح الحزمة
افتح القفل للوصول البطاقات البالغ عددها 178 في هذه المجموعة.
فتح الحزمة
k this deck
49
A machine is supposed to fill boxes to a weight of 50 pounds. Every 30 minutes a sample of four boxes is tested; the results are given below.
What would be the value of the centerline that would be used in creating an R chart?
What would be the value of the centerline that would be used in creating an R chart?
فتح الحزمة
افتح القفل للوصول البطاقات البالغ عددها 178 في هذه المجموعة.
فتح الحزمة
k this deck
50
Examine the given run chart or control chart and determine whether the process is within statistical control.
A) The process is within statistical control.
B) The process is not within statistical control.
A) The process is within statistical control.
B) The process is not within statistical control.
فتح الحزمة
افتح القفل للوصول البطاقات البالغ عددها 178 في هذه المجموعة.
فتح الحزمة
k this deck
51
__________________ variation results from causes that can be identified.
A) Random
B) Identifiable
C) Assignable
D) Definable
A) Random
B) Identifiable
C) Assignable
D) Definable
فتح الحزمة
افتح القفل للوصول البطاقات البالغ عددها 178 في هذه المجموعة.
فتح الحزمة
k this deck
52
Consider process data consisting of the amounts of potato chips (in ounces)in randomly selected bags of chips. The process is to be monitored with control charts based on samples
Of 50 bags randomly selected each day for 15 consecutive days of production. What does denote?
A) The mean of 50 bags.
B) The mean of all 15 sample means.
C) The mean of the ranges for the 15 days.
D) The mean of the standard deviations for the 15 days.
control charts based on samplesOf 50 bags randomly selected each day for 15 consecutive days of production. What does
denote?A) The mean of 50 bags.
B) The mean of all 15 sample means.
C) The mean of the ranges for the 15 days.
D) The mean of the standard deviations for the 15 days.
فتح الحزمة
افتح القفل للوصول البطاقات البالغ عددها 178 في هذه المجموعة.
فتح الحزمة
k this deck
53
______________? measurement of a characteristic or good or services that result from some combination of
Equipment, people, materials, methods, and conditions.
A) Process
B) Service
C) Sequential
D) Material
Equipment, people, materials, methods, and conditions.
A) Process
B) Service
C) Sequential
D) Material
فتح الحزمة
افتح القفل للوصول البطاقات البالغ عددها 178 في هذه المجموعة.
فتح الحزمة
k this deck
54
Control charts are used to monitor changing characteristics of data over ____________.
A) time
B) space
C) distance
D) speed
A) time
B) space
C) distance
D) speed
فتح الحزمة
افتح القفل للوصول البطاقات البالغ عددها 178 في هذه المجموعة.
فتح الحزمة
k this deck
55
Which graph using individual data values instead of a process characteristic?
فتح الحزمة
افتح القفل للوصول البطاقات البالغ عددها 178 في هذه المجموعة.
فتح الحزمة
k this deck
56
Which type of chart would be best for monitoring the proportion of items that are defective?
فتح الحزمة
افتح القفل للوصول البطاقات البالغ عددها 178 في هذه المجموعة.
فتح الحزمة
k this deck
57
Use the given process data to construct a control chart for p. A candy manufacturer considers a cracked piece of candy to be a defect. Each day 100 candies are randomly selected and
Checked for cracks. The numbers of defects for 20 consecutive days are given below.
Checked for cracks. The numbers of defects for 20 consecutive days are given below.
فتح الحزمة
افتح القفل للوصول البطاقات البالغ عددها 178 في هذه المجموعة.
فتح الحزمة
k this deck
58
A _________________ is a sequential plot of individual data values over time. One axis is used for the data values, and the other axis is used for the time sequence.
A) run chart
B) process chart
C) time-process chart
D) flow chart
A) run chart
B) process chart
C) time-process chart
D) flow chart
فتح الحزمة
افتح القفل للوصول البطاقات البالغ عددها 178 في هذه المجموعة.
فتح الحزمة
k this deck
59
Which of the following is not one of the criteria for determining if a control chart indicates that a process is not statistically stable?
A) Exceptional value
B) Upward shift
C) Downward trend
D) Decreasing variation
A) Exceptional value
B) Upward shift
C) Downward trend
D) Decreasing variation
فتح الحزمة
افتح القفل للوصول البطاقات البالغ عددها 178 في هذه المجموعة.
فتح الحزمة
k this deck
60
Examine the given run chart or control chart and determine whether the process is within statistical control.
A) The process is within statistical control.
B) The process is not within statistical control.
A) The process is within statistical control.
B) The process is not within statistical control.
فتح الحزمة
افتح القفل للوصول البطاقات البالغ عددها 178 في هذه المجموعة.
فتح الحزمة
k this deck
61
Use a 0.05 level of significance to test the claim that the sequence of computer -generated
numbers is random. Test for randomness above and below the mean.
numbers is random. Test for randomness above and below the mean.
فتح الحزمة
افتح القفل للوصول البطاقات البالغ عددها 178 في هذه المجموعة.
فتح الحزمة
k this deck
62
Use the rank correlation coefficient to test for a correlation between the two variables.
Given that the rank correlation coefficient, rs, for 37 pairs of data is 0.324, test the claim of
correlation between the two variables. Use a significance level of 0.01.
Given that the rank correlation coefficient, rs, for 37 pairs of data is 0.324, test the claim of
correlation between the two variables. Use a significance level of 0.01.
فتح الحزمة
افتح القفل للوصول البطاقات البالغ عددها 178 في هذه المجموعة.
فتح الحزمة
k this deck
63
Use the Wilcoxon rank-sum test to test the claim that the two independent samples come from
populations with equal medians. Use the Wilcoxon rank-sum approach to test the claim that
the sample student grade averages at two colleges come from populations with the same
median. The sample data is listed below. Use a 0.05 level of significance, and assume that the
samples were randomly selected.
فتح الحزمة
افتح القفل للوصول البطاقات البالغ عددها 178 في هذه المجموعة.
فتح الحزمة
k this deck
64
List the advantages and disadvantages of nonparametric tests.
فتح الحزمة
افتح القفل للوصول البطاقات البالغ عددها 178 في هذه المجموعة.
فتح الحزمة
k this deck
65
Use the Wilcoxon rank-sum test to test the claim that the two independent samples come from
populations with equal medians. SAT scores for students selected randomly from two different
schools are shown below. Use a significance level of 0.05 to test the claim that the scores for
the two schools are from populations with the same median.
populations with equal medians. SAT scores for students selected randomly from two different
schools are shown below. Use a significance level of 0.05 to test the claim that the scores for
the two schools are from populations with the same median.
فتح الحزمة
افتح القفل للوصول البطاقات البالغ عددها 178 في هذه المجموعة.
فتح الحزمة
k this deck
66
A standard aptitude test is given to several randomly selected programmers, and the scores are
given below for the mathematics and verbal portions of the test. Use the sign test to test the
claim that programmers do better on the mathematics portion of the test. Use a 0.05 level of
significance.
given below for the mathematics and verbal portions of the test. Use the sign test to test the
claim that programmers do better on the mathematics portion of the test. Use a 0.05 level of
significance.
فتح الحزمة
افتح القفل للوصول البطاقات البالغ عددها 178 في هذه المجموعة.
فتح الحزمة
k this deck
67
Use the runs test to determine whether the given sequence is random. Use a significance level
of 0.05. The sequence of numbers below represents the maximum temperature (in degrees
Fahrenheit)in July in one U.S. town for 30 consecutive years. Test the sequence for
randomness above and below the median.
of 0.05. The sequence of numbers below represents the maximum temperature (in degrees
Fahrenheit)in July in one U.S. town for 30 consecutive years. Test the sequence for
randomness above and below the median.
فتح الحزمة
افتح القفل للوصول البطاقات البالغ عددها 178 في هذه المجموعة.
فتح الحزمة
k this deck
68
Describe the Wilcoxon rank-sum test. What type of hypotheses is it used to test? What
assumptions are made for this test? What is the underlying concept?
assumptions are made for this test? What is the underlying concept?
فتح الحزمة
افتح القفل للوصول البطاقات البالغ عددها 178 في هذه المجموعة.
فتح الحزمة
k this deck
69
Use the rank correlation coefficient to test for a correlation between the two variables. A
placement test is required for students desiring to take a finite mathematics course at a
university. The instructor of the course studies the relationship between students' placement
test score and final course score. A random sample of eight students yields the following data. Compute the rank correlation coefficient, rs, of the data and test the claim of correlation
between placement score and final course score. Use a significance level of 0.05.
placement test is required for students desiring to take a finite mathematics course at a
university. The instructor of the course studies the relationship between students' placement
test score and final course score. A random sample of eight students yields the following data.
Compute the rank correlation coefficient, rs, of the data and test the claim of correlationbetween placement score and final course score. Use a significance level of 0.05.
فتح الحزمة
افتح القفل للوصول البطاقات البالغ عددها 178 في هذه المجموعة.
فتح الحزمة
k this deck
70
Use the runs test to determine whether the given sequence is random. Use a significance level
of 0.05. A true-false test had the following answer sequence. Test the null hypothesis that the sequence was random.
of 0.05. A true-false test had the following answer sequence.
Test the null hypothesis that the sequence was random. فتح الحزمة
افتح القفل للوصول البطاقات البالغ عددها 178 في هذه المجموعة.
فتح الحزمة
k this deck
71
Give at least two examples of nonparametric tests and their comparable parametric tests.
فتح الحزمة
افتح القفل للوصول البطاقات البالغ عددها 178 في هذه المجموعة.
فتح الحزمة
k this deck
72
Use a Kruskal-Wallis test to test the claim that the samples come from populations with equal
medians. Listed below are grade averages for randomly selected students with three different
categories of high-school background. At the 0.05 level of significance, test the claim that the
three groups have the same median grade average.
medians. Listed below are grade averages for randomly selected students with three different
categories of high-school background. At the 0.05 level of significance, test the claim that the
three groups have the same median grade average.
فتح الحزمة
افتح القفل للوصول البطاقات البالغ عددها 178 في هذه المجموعة.
فتح الحزمة
k this deck
73
Describe the sign test. What types of hypotheses is it used to test? What is the underlying
concept?
concept?
فتح الحزمة
افتح القفل للوصول البطاقات البالغ عددها 178 في هذه المجموعة.
فتح الحزمة
k this deck
74
Use the sign test to test the indicated claim. Fourteen people rated two brands of soda on a scale
of 1 to 5. At the 5 percent level, test the null hypothesis that the two brands of soda are equally popular.
of 1 to 5.
At the 5 percent level, test the null hypothesis that the two brands of soda are equally popular. فتح الحزمة
افتح القفل للوصول البطاقات البالغ عددها 178 في هذه المجموعة.
فتح الحزمة
k this deck
75
Solve the problem. Critical values for the runs test for randomness can be calculated by listing
all possible sequences. Using the elements B, B, B, R, R, R list the 20 different possible
sequences. Find the number of runs for each sequence. Are you able to find 5% cutoff values
for G? What do you conclude?
all possible sequences. Using the elements B, B, B, R, R, R list the 20 different possible
sequences. Find the number of runs for each sequence. Are you able to find 5% cutoff values
for G? What do you conclude?
فتح الحزمة
افتح القفل للوصول البطاقات البالغ عددها 178 في هذه المجموعة.
فتح الحزمة
k this deck
76
Explain what an efficiency rating is. You may use an example to explain this concept. Do
comparable parametric or nonparametric tests have higher efficiency ratings?
comparable parametric or nonparametric tests have higher efficiency ratings?
فتح الحزمة
افتح القفل للوصول البطاقات البالغ عددها 178 في هذه المجموعة.
فتح الحزمة
k this deck
77
Use the sign test to test the indicated claim. The heights of 16 randomly selected women are
given below. Use a significance level of 0.05 to test the claim that the population median is
equal to 64.0 inches.
given below. Use a significance level of 0.05 to test the claim that the population median is
equal to 64.0 inches.
فتح الحزمة
افتح القفل للوصول البطاقات البالغ عددها 178 في هذه المجموعة.
فتح الحزمة
k this deck
78
When applying the runs test for randomness above and below the median for 12 dollar/Euro
exchange rate highs, the test statistic is G = 2. What does that value tell us about the data?
exchange rate highs, the test statistic is G = 2. What does that value tell us about the data?
فتح الحزمة
افتح القفل للوصول البطاقات البالغ عددها 178 في هذه المجموعة.
فتح الحزمة
k this deck
79
Describe the rank correlation test. What types of hypotheses is it used to test? How does the
rank correlation coefficient differ from the Pearson correlation coefficient r?
rank correlation coefficient
differ from the Pearson correlation coefficient r? فتح الحزمة
افتح القفل للوصول البطاقات البالغ عددها 178 في هذه المجموعة.
فتح الحزمة
k this deck
80
Define rank. Explain how to find the rank for data which repeats (for example, the data set: 4,
5, 5, 5, 7, 8, 12, 12, 15, 18).
5, 5, 5, 7, 8, 12, 12, 15, 18).
فتح الحزمة
افتح القفل للوصول البطاقات البالغ عددها 178 في هذه المجموعة.
فتح الحزمة
k this deck
فتح الحزمة
افتح القفل للوصول البطاقات البالغ عددها 178 في هذه المجموعة.


