Deck 3: Statistics for Describing, Exploring, and Comparing Data
ملء الشاشة (f)
سؤال
سؤال
سؤال
سؤال
سؤال
سؤال
سؤال
سؤال
سؤال
سؤال
سؤال
Provide an appropriate response.
Without calculating the standard deviation, compare the standard deviation for the following three data sets. (Note: All data sets have a mean of 30.)Which do you expect to have the largest standard deviation and which do you expect to have the smallest standard deviation? Explain your answers in terms of the formula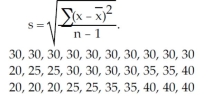
Without calculating the standard deviation, compare the standard deviation for the following three data sets. (Note: All data sets have a mean of 30.)Which do you expect to have the largest standard deviation and which do you expect to have the smallest standard deviation? Explain your answers in terms of the formula
سؤال
سؤال
سؤال
سؤال
سؤال
سؤال
سؤال
سؤال
سؤال
سؤال
سؤال
سؤال
سؤال
سؤال
سؤال
سؤال
سؤال
سؤال
سؤال
سؤال
سؤال
سؤال
سؤال
سؤال
Find the mean, median, mode, and midrange for each of the two samples, then compare the two sets of results.
The Body Mass Index (BMI)is measured for a random sample of men and women. Interpret the results by determining whether there is a difference between the two data sets that is not apparent from a comparison of the measures of center. If there is, what is it?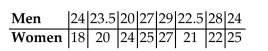
The Body Mass Index (BMI)is measured for a random sample of men and women. Interpret the results by determining whether there is a difference between the two data sets that is not apparent from a comparison of the measures of center. If there is, what is it?
سؤال
Find the mean, median, mode, and midrange for each of the two samples, then compare the two sets of results.
A comparison is made between summer electric bills of those who have central air and those who have window units.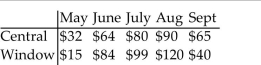
A comparison is made between summer electric bills of those who have central air and those who have window units.
سؤال
سؤال
سؤال
سؤال
سؤال
سؤال
سؤال
سؤال
سؤال
سؤال
سؤال
سؤال
سؤال
سؤال
سؤال
سؤال
سؤال
سؤال
سؤال
سؤال
سؤال
سؤال
سؤال
سؤال
سؤال
سؤال
سؤال
سؤال
سؤال
سؤال
سؤال
سؤال
سؤال
سؤال
سؤال
سؤال
سؤال
سؤال
سؤال
سؤال
سؤال
سؤال
سؤال
سؤال

فتح الحزمة
قم بالتسجيل لفتح البطاقات في هذه المجموعة!
Unlock Deck
Unlock Deck
1/149
العب
ملء الشاشة (f)
Deck 3: Statistics for Describing, Exploring, and Comparing Data
1
Provide an appropriate response.
The Empirical Rule and Chebyshev's Theorem both relate the percent of data points to the number of standard deviations above or below the mean. What is the significant difference between the two and why do the percents for ±2 SD and ±3 SD differ so much?
The Empirical Rule and Chebyshev's Theorem both relate the percent of data points to the number of standard deviations above or below the mean. What is the significant difference between the two and why do the percents for ±2 SD and ±3 SD differ so much?
Answers will vary.
2
Provide an appropriate response.
-The mean of a data set is always/sometimes/never (select one)one of the data points in a set of data. Explain your answer with brief examples.
-The mean of a data set is always/sometimes/never (select one)one of the data points in a set of data. Explain your answer with brief examples.
The mean of a data set is sometimes one of the data points in a set of data.The mean, or average, of a data set is calculated by summing all the data points and then dividing by the number of data points. It represents the central value of the data set. The mean does not necessarily have to be one of the actual data points—it can be a value that doesn't appear in the data set at all. However, in some cases, the mean can indeed be one of the data points.
Here are two examples to illustrate this:
1. Example where the mean is not one of the data points:
Consider the data set {1, 2, 3, 4, 6}. The mean is calculated as (1 + 2 + 3 + 4 + 6) / 5 = 16 / 5 = 3.2. In this case, the mean (3.2) is not one of the data points in the set.
2. Example where the mean is one of the data points:
Consider the data set {2, 3, 4, 5, 6}. The mean is calculated as (2 + 3 + 4 + 5 + 6) / 5 = 20 / 5 = 4. In this case, the mean (4) is one of the data points in the set.
Therefore, the mean can sometimes be one of the data points, but it is not always the case.
3
Provide an appropriate response.
We want to compare two different groups of students, students taking Composition 1 in a traditional lecture format and students taking Composition 1 in a distance learning format. We know that the mean score on the research paper is 85 for both groups. What additional information would be provided by knowing the standard deviation?
We want to compare two different groups of students, students taking Composition 1 in a traditional lecture format and students taking Composition 1 in a distance learning format. We know that the mean score on the research paper is 85 for both groups. What additional information would be provided by knowing the standard deviation?
Answers will vary.
4
Find the mean for the given sample data.
-Frank's Furniture employees earned the following amounts last week: What was the mean amount earned by an employee last week? Round your answer to the nearest cent.
A)$387.30
B)$435.71
C)$497.95
D)$380.63
-Frank's Furniture employees earned the following amounts last week: What was the mean amount earned by an employee last week? Round your answer to the nearest cent.
A)$387.30
B)$435.71
C)$497.95
D)$380.63
فتح الحزمة
افتح القفل للوصول البطاقات البالغ عددها 149 في هذه المجموعة.
فتح الحزمة
k this deck
5
Answer the question.
-The number of vehicles passing through a bank drive-up line during each 15-minute period was recorded. The results are shown below. Find the median number of vehicles going through the line in a fifteen-minute period.
A)32
B)31.85
C)33
D)36
-The number of vehicles passing through a bank drive-up line during each 15-minute period was recorded. The results are shown below. Find the median number of vehicles going through the line in a fifteen-minute period.
A)32
B)31.85
C)33
D)36
فتح الحزمة
افتح القفل للوصول البطاقات البالغ عددها 149 في هذه المجموعة.
فتح الحزمة
k this deck
6
Answer the question.
-The distances traveled (in miles)to 7 different swim meets are given below: Find the median distance traveled.
A)60 miles
B)30 miles
C)47 miles
D)44 miles
-The distances traveled (in miles)to 7 different swim meets are given below: Find the median distance traveled.
A)60 miles
B)30 miles
C)47 miles
D)44 miles
فتح الحزمة
افتح القفل للوصول البطاقات البالغ عددها 149 في هذه المجموعة.
فتح الحزمة
k this deck
7
Provide an appropriate response.
A company advertises an average of 42,000 miles for one of its new tires. In the manufacturing process there is some variation around that average. Would the company want a process that provides a large or a small variance? Justify your answer.
A company advertises an average of 42,000 miles for one of its new tires. In the manufacturing process there is some variation around that average. Would the company want a process that provides a large or a small variance? Justify your answer.
فتح الحزمة
افتح القفل للوصول البطاقات البالغ عددها 149 في هذه المجموعة.
فتح الحزمة
k this deck
8
Answer the question.
A store manager kept track of the number of newspapers sold each week over a seven-week period. The results are shown below. 78, 43, 228, 194, 259, 236, 235 Find the median number of newspapers sold.
A)194 newspapers
B)228 newspapers
C)182 newspapers
D)235 newspapers
A store manager kept track of the number of newspapers sold each week over a seven-week period. The results are shown below. 78, 43, 228, 194, 259, 236, 235 Find the median number of newspapers sold.
A)194 newspapers
B)228 newspapers
C)182 newspapers
D)235 newspapers
فتح الحزمة
افتح القفل للوصول البطاقات البالغ عددها 149 في هذه المجموعة.
فتح الحزمة
k this deck
9
Answer the question.
-The weights (in ounces)of 21 cookies are shown. Find the median weight.
A)1.42 ounces
B)0.93 ounces
C)0.83 ounces
D)0.88 ounces
-The weights (in ounces)of 21 cookies are shown. Find the median weight.
A)1.42 ounces
B)0.93 ounces
C)0.83 ounces
D)0.88 ounces
فتح الحزمة
افتح القفل للوصول البطاقات البالغ عددها 149 في هذه المجموعة.
فتح الحزمة
k this deck
10
Find the mean for the given sample data.
-Six college buddies bought each other Christmas gifts. They spent: What was the mean amount spent? Round your answer to the nearest cent.
A)$178.48
B)$267.72
C)$202.18
D)$214.18
-Six college buddies bought each other Christmas gifts. They spent: What was the mean amount spent? Round your answer to the nearest cent.
A)$178.48
B)$267.72
C)$202.18
D)$214.18
فتح الحزمة
افتح القفل للوصول البطاقات البالغ عددها 149 في هذه المجموعة.
فتح الحزمة
k this deck
11
Provide an appropriate response.
Without calculating the standard deviation, compare the standard deviation for the following three data sets. (Note: All data sets have a mean of 30.)Which do you expect to have the largest standard deviation and which do you expect to have the smallest standard deviation? Explain your answers in terms of the formula
Without calculating the standard deviation, compare the standard deviation for the following three data sets. (Note: All data sets have a mean of 30.)Which do you expect to have the largest standard deviation and which do you expect to have the smallest standard deviation? Explain your answers in terms of the formula
فتح الحزمة
افتح القفل للوصول البطاقات البالغ عددها 149 في هذه المجموعة.
فتح الحزمة
k this deck
12
Provide an appropriate response.
Explain how two data sets could have equal means and modes but still differ greatly. Give an example with two data sets to illustrate.
Explain how two data sets could have equal means and modes but still differ greatly. Give an example with two data sets to illustrate.
فتح الحزمة
افتح القفل للوصول البطاقات البالغ عددها 149 في هذه المجموعة.
فتح الحزمة
k this deck
13
Provide an appropriate response.
The two most frequently used measures of central tendency are the mean and the median. Compare these two measures for the following characteristics: Takes every score into account? Affected by extreme scores? Advantages.
The two most frequently used measures of central tendency are the mean and the median. Compare these two measures for the following characteristics: Takes every score into account? Affected by extreme scores? Advantages.
فتح الحزمة
افتح القفل للوصول البطاقات البالغ عددها 149 في هذه المجموعة.
فتح الحزمة
k this deck
14
Find the median for the given sample data.
-20, -27, -46, -27, -49, -27, -49
A)-27
B)-46
C)-35
D)-49
-20, -27, -46, -27, -49, -27, -49
A)-27
B)-46
C)-35
D)-49
فتح الحزمة
افتح القفل للوصول البطاقات البالغ عددها 149 في هذه المجموعة.
فتح الحزمة
k this deck
15
Provide an appropriate response.
Marla scored 85% on her last unit exam in her statistics class. When Marla took the SAT exam, she scored at the 85 percentile in mathematics. Explain the difference in these two scores.
Marla scored 85% on her last unit exam in her statistics class. When Marla took the SAT exam, she scored at the 85 percentile in mathematics. Explain the difference in these two scores.
فتح الحزمة
افتح القفل للوصول البطاقات البالغ عددها 149 في هذه المجموعة.
فتح الحزمة
k this deck
16
Find the mean for the given sample data.
-The local Tupperware dealers earned these commissions last month:
What was the mean commission earned? Round your answer to the nearest cent.
A)$3933.18
B)$4424.83
C)$3539.86
D)$3533.86
-The local Tupperware dealers earned these commissions last month:
What was the mean commission earned? Round your answer to the nearest cent.
A)$3933.18
B)$4424.83
C)$3539.86
D)$3533.86
فتح الحزمة
افتح القفل للوصول البطاقات البالغ عددها 149 في هذه المجموعة.
فتح الحزمة
k this deck
17
Find the median for the given sample data.
-The normal monthly precipitation (in inches)for August is listed for 20 different U.S. cities. Find the median of the data.
A)3.50 in.
B)3.45 in.
C)3.40 in.
D)2.94 in.
-The normal monthly precipitation (in inches)for August is listed for 20 different U.S. cities. Find the median of the data.
A)3.50 in.
B)3.45 in.
C)3.40 in.
D)2.94 in.
فتح الحزمة
افتح القفل للوصول البطاقات البالغ عددها 149 في هذه المجموعة.
فتح الحزمة
k this deck
18
Answer the question.
-The normal monthly precipitation (in inches)for August is listed for 20 different U.S. cities. Find the mean of the data.
A)2.94 in.
B)3.09 in.
C)3.27 in.
D)2.80 in.
-The normal monthly precipitation (in inches)for August is listed for 20 different U.S. cities. Find the mean of the data.
A)2.94 in.
B)3.09 in.
C)3.27 in.
D)2.80 in.
فتح الحزمة
افتح القفل للوصول البطاقات البالغ عددها 149 في هذه المجموعة.
فتح الحزمة
k this deck
19
Provide an appropriate response.
Describe how to find the percentile for a given score in a set of data. How does this process relate to the definition of a percentile score?
Describe how to find the percentile for a given score in a set of data. How does this process relate to the definition of a percentile score?
فتح الحزمة
افتح القفل للوصول البطاقات البالغ عددها 149 في هذه المجموعة.
فتح الحزمة
k this deck
20
Find the mean for the given sample data.
-Bill kept track of the number of hours he spent exercising each week. The results for four months are shown below. Find the mean number of hours Bill spent exercising per week. Round your answer to two decimal places.
A)7.33
B)7.12
C)6.75
D)7.54
-Bill kept track of the number of hours he spent exercising each week. The results for four months are shown below. Find the mean number of hours Bill spent exercising per week. Round your answer to two decimal places.
A)7.33
B)7.12
C)6.75
D)7.54
فتح الحزمة
افتح القفل للوصول البطاقات البالغ عددها 149 في هذه المجموعة.
فتح الحزمة
k this deck
21
Find the median for the given sample data.
7.22, 7.41, 7.56, 7.22, 7.88, 7.99, 7.62
A)7.41
B)7.557
C)7.22
D)7.56
7.22, 7.41, 7.56, 7.22, 7.88, 7.99, 7.62
A)7.41
B)7.557
C)7.22
D)7.56
فتح الحزمة
افتح القفل للوصول البطاقات البالغ عددها 149 في هذه المجموعة.
فتح الحزمة
k this deck
22
Find the mode(s)for the given sample data.
-The speeds (in mi/h)of the cars passing a certain checkpoint are measured by radar. The results are shown below.
A)42.8, 43.5, 41.8
B)42.8
C)41.8
D)42.70
-The speeds (in mi/h)of the cars passing a certain checkpoint are measured by radar. The results are shown below.
A)42.8, 43.5, 41.8
B)42.8
C)41.8
D)42.70
فتح الحزمة
افتح القفل للوصول البطاقات البالغ عددها 149 في هذه المجموعة.
فتح الحزمة
k this deck
23
Find the mode(s)for the given sample data.
-
A)61.5
B)25
C)12.5
D)53.5
-
A)61.5
B)25
C)12.5
D)53.5
فتح الحزمة
افتح القفل للوصول البطاقات البالغ عددها 149 في هذه المجموعة.
فتح الحزمة
k this deck
24
Find the mode(s)for the given sample data.
-The weights (in ounces)of 18 cookies are shown. Find the midrange.
A)1.040
B)1.030
C)1.130
D)1.08
-The weights (in ounces)of 18 cookies are shown. Find the midrange.
A)1.040
B)1.030
C)1.130
D)1.08
فتح الحزمة
افتح القفل للوصول البطاقات البالغ عددها 149 في هذه المجموعة.
فتح الحزمة
k this deck
25
Find the mode(s)for the given sample data.
-
A)2.1
B)1.9
C)2.20
D)2.25
-
A)2.1
B)1.9
C)2.20
D)2.25
فتح الحزمة
افتح القفل للوصول البطاقات البالغ عددها 149 في هذه المجموعة.
فتح الحزمة
k this deck
26
Find the median for the given sample data.
-The weights (in ounces)of 14 different apples are shown below.
A)None
B)5.05
C)5.5, 4.6
D)5.5
-The weights (in ounces)of 14 different apples are shown below.
A)None
B)5.05
C)5.5, 4.6
D)5.5
فتح الحزمة
افتح القفل للوصول البطاقات البالغ عددها 149 في هذه المجموعة.
فتح الحزمة
k this deck
27
Find the mean of the data summarized in the given frequency distribution.
-The highway speeds of 100 cars are summarized in the frequency distribution below. Find the mean speed.
A)59.2 mph
B)54.5 mph
C)62.0 mph
D)56.4 mph
-The highway speeds of 100 cars are summarized in the frequency distribution below. Find the mean speed.
A)59.2 mph
B)54.5 mph
C)62.0 mph
D)56.4 mph
فتح الحزمة
افتح القفل للوصول البطاقات البالغ عددها 149 في هذه المجموعة.
فتح الحزمة
k this deck
28
Find the median for the given sample data.
98, 69, 32, 69, 29, 98
A)98, 69
B)98
C)69
D)65.8
98, 69, 32, 69, 29, 98
A)98, 69
B)98
C)69
D)65.8
فتح الحزمة
افتح القفل للوصول البطاقات البالغ عددها 149 في هذه المجموعة.
فتح الحزمة
k this deck
29
Solve the problem.
The geometric mean is often used in business and economics for finding average rates of change, average rates of growth, or average ratios. Given n values (all positive), the geometric mean is the nth root of their product. The average growth factor for money compounded at annual interest rates of 49%, 19%, 24%, and 13% can be found by computing the geometric mean of 1.49, 1.19, 1.24, and 1.13. Find that average growth factor.
A)0.0116
B)1.5762
C)0.6211
D)1.2555
فتح الحزمة
افتح القفل للوصول البطاقات البالغ عددها 149 في هذه المجموعة.
فتح الحزمة
k this deck
30
Find the mode(s)for the given sample data.
-A meteorologist records the number of clear days in a given year in each of 21 different U.S. cities. The results are shown below. Find the midrange.
A)117
B)98
C)112
D)110.5
-A meteorologist records the number of clear days in a given year in each of 21 different U.S. cities. The results are shown below. Find the midrange.
A)117
B)98
C)112
D)110.5
فتح الحزمة
افتح القفل للوصول البطاقات البالغ عددها 149 في هذه المجموعة.
فتح الحزمة
k this deck
31
Find the mean of the data summarized in the given frequency distribution.
-The heights of a group of professional basketball players are summarized in the frequency distribution below. Find the mean height. Round your answer to one decimal place.
A)74.9 in.
B)78.3 in.
C)76.5 in.
D)13.5 in.
-The heights of a group of professional basketball players are summarized in the frequency distribution below. Find the mean height. Round your answer to one decimal place.
A)74.9 in.
B)78.3 in.
C)76.5 in.
D)13.5 in.
فتح الحزمة
افتح القفل للوصول البطاقات البالغ عددها 149 في هذه المجموعة.
فتح الحزمة
k this deck
32
Find the mode(s)for the given sample data.
-
A)8
B)7.5
C)15
D)5.5
-
A)8
B)7.5
C)15
D)5.5
فتح الحزمة
افتح القفل للوصول البطاقات البالغ عددها 149 في هذه المجموعة.
فتح الحزمة
k this deck
33
Find the mean of the data summarized in the given frequency distribution.
-A company had 80 employees whose salaries are summarized in the frequency distribution below. Find the mean salary.
A)$17,500
B)$17,937.50
C)$19,731.25
D)$16,143.75
-A company had 80 employees whose salaries are summarized in the frequency distribution below. Find the mean salary.
A)$17,500
B)$17,937.50
C)$19,731.25
D)$16,143.75
فتح الحزمة
افتح القفل للوصول البطاقات البالغ عددها 149 في هذه المجموعة.
فتح الحزمة
k this deck
34
Find the mode(s)for the given sample data.
-The speeds (in mph)of the cars passing a certain checkpoint are measured by radar. The results are shown below. Find the midrange.
A)42.25
B)42.35
C)4.70
D)42.5
-The speeds (in mph)of the cars passing a certain checkpoint are measured by radar. The results are shown below. Find the midrange.
A)42.25
B)42.35
C)4.70
D)42.5
فتح الحزمة
افتح القفل للوصول البطاقات البالغ عددها 149 في هذه المجموعة.
فتح الحزمة
k this deck
35
Find the mean, median, mode, and midrange for each of the two samples, then compare the two sets of results.
The Body Mass Index (BMI)is measured for a random sample of men and women. Interpret the results by determining whether there is a difference between the two data sets that is not apparent from a comparison of the measures of center. If there is, what is it?
The Body Mass Index (BMI)is measured for a random sample of men and women. Interpret the results by determining whether there is a difference between the two data sets that is not apparent from a comparison of the measures of center. If there is, what is it?
فتح الحزمة
افتح القفل للوصول البطاقات البالغ عددها 149 في هذه المجموعة.
فتح الحزمة
k this deck
36
Find the mean, median, mode, and midrange for each of the two samples, then compare the two sets of results.
A comparison is made between summer electric bills of those who have central air and those who have window units.
A comparison is made between summer electric bills of those who have central air and those who have window units.
فتح الحزمة
افتح القفل للوصول البطاقات البالغ عددها 149 في هذه المجموعة.
فتح الحزمة
k this deck
37
Find the mode(s)for the given sample data.
-Bill kept track of the number of hours he spent exercising each week. The results for 15 weeks are shown below. Find the midrange.
A)7.5
B)7.60
C)2.4
D)7.70
-Bill kept track of the number of hours he spent exercising each week. The results for 15 weeks are shown below. Find the midrange.
A)7.5
B)7.60
C)2.4
D)7.70
فتح الحزمة
افتح القفل للوصول البطاقات البالغ عددها 149 في هذه المجموعة.
فتح الحزمة
k this deck
38
Find the median for the given sample data.
62, 25, 62, 13, 25, 29, 56, 62
A)41.8
B)62
C)42.5
D)25
62, 25, 62, 13, 25, 29, 56, 62
A)41.8
B)62
C)42.5
D)25
فتح الحزمة
افتح القفل للوصول البطاقات البالغ عددها 149 في هذه المجموعة.
فتح الحزمة
k this deck
39
Find the mean of the data summarized in the given frequency distribution.
-The test scores of 40 students are summarized in the frequency distribution below. Find the mean score.
A)74.5
B)73.4
C)69.6
D)77.3
-The test scores of 40 students are summarized in the frequency distribution below. Find the mean score.
A)74.5
B)73.4
C)69.6
D)77.3
فتح الحزمة
افتح القفل للوصول البطاقات البالغ عددها 149 في هذه المجموعة.
فتح الحزمة
k this deck
40
Find the median for the given sample data.
20, 21, 46, 21, 49, 21, 49
A)49
B)21
C)46
D)32.4
20, 21, 46, 21, 49, 21, 49
A)49
B)21
C)46
D)32.4
فتح الحزمة
افتح القفل للوصول البطاقات البالغ عددها 149 في هذه المجموعة.
فتح الحزمة
k this deck
41
Find the range for the given data.
-Jeanne is currently taking college economics. The instructor often gives quizzes. On the past five quizzes, Jeanne got the following scores:
Compute the range.
A)13
B)5
C)16
D)3
-Jeanne is currently taking college economics. The instructor often gives quizzes. On the past five quizzes, Jeanne got the following scores:
Compute the range.
A)13
B)5
C)16
D)3
فتح الحزمة
افتح القفل للوصول البطاقات البالغ عددها 149 في هذه المجموعة.
فتح الحزمة
k this deck
42
Find the midrange for the given sample data.
18, 17, 1, 18, and 4
A)98.3
B)56.2
C)70.3
D)70.2
18, 17, 1, 18, and 4
A)98.3
B)56.2
C)70.3
D)70.2
فتح الحزمة
افتح القفل للوصول البطاقات البالغ عددها 149 في هذه المجموعة.
فتح الحزمة
k this deck
43
Find the midrange for the given sample data.
15.0, 13.4, 14.0, 17.3, and 10.3
A)6.48
B)6.38
C)5.19
D)47.32
15.0, 13.4, 14.0, 17.3, and 10.3
A)6.48
B)6.38
C)5.19
D)47.32
فتح الحزمة
افتح القفل للوصول البطاقات البالغ عددها 149 في هذه المجموعة.
فتح الحزمة
k this deck
44
Solve the problem.
The 10% trimmed mean of a data set is found by arranging the data in order, deleting the bottom 10% of the values and the top 10% of the values and then calculating the mean of the remaining values. What advantages do you think that the trimmed mean has as compared to the mean?
The 10% trimmed mean of a data set is found by arranging the data in order, deleting the bottom 10% of the values and the top 10% of the values and then calculating the mean of the remaining values. What advantages do you think that the trimmed mean has as compared to the mean?
فتح الحزمة
افتح القفل للوصول البطاقات البالغ عددها 149 في هذه المجموعة.
فتح الحزمة
k this deck
45
Solve the problem.
-The quadratic mean (or root mean square)is usually used in physical applications. In power distribution systems, for example, voltages and currents are usually referred to in terms of their root mean square value. The quadratic mean of a set of values is obtained by squaring each value, adding the results, dividing by the number of values (n), and then taking the square root of that result, expressed as Find the root mean square of these power supplies (in volts): 19, 57, 28, 45.
A)20.0 volts
B)37.2 volts
C)74.5 volts
D)40.1 volts
فتح الحزمة
افتح القفل للوصول البطاقات البالغ عددها 149 في هذه المجموعة.
فتح الحزمة
k this deck
46
Find the range for the given data.
-Rich Borne is currently taking Chemistry 101. On the five laboratory assignments for the quarter, he got the following scores:
Compute the range.
A)38
B)51
C)7
D)13
-Rich Borne is currently taking Chemistry 101. On the five laboratory assignments for the quarter, he got the following scores:
Compute the range.
A)38
B)51
C)7
D)13
فتح الحزمة
افتح القفل للوصول البطاقات البالغ عددها 149 في هذه المجموعة.
فتح الحزمة
k this deck
47
Find the midrange for the given sample data.
-Compute the variance. The owner of a small manufacturing plant employs six people. As part of their personnel file, she asked each one to record to the nearest one-tenth of a mile the distance they travel one way from home to work. The six distances are listed below:
A)56.9
B)313.4
C)300.1
D)47.5
-Compute the variance. The owner of a small manufacturing plant employs six people. As part of their personnel file, she asked each one to record to the nearest one-tenth of a mile the distance they travel one way from home to work. The six distances are listed below:
A)56.9
B)313.4
C)300.1
D)47.5
فتح الحزمة
افتح القفل للوصول البطاقات البالغ عددها 149 في هذه المجموعة.
فتح الحزمة
k this deck
48
Find the midrange for the given sample data.
3.8, 1.9, 8.8, 3.3, and 4.2
A)10.84
B)6.81
C)6.71
D)5.45
3.8, 1.9, 8.8, 3.3, and 4.2
A)10.84
B)6.81
C)6.71
D)5.45
فتح الحزمة
افتح القفل للوصول البطاقات البالغ عددها 149 في هذه المجموعة.
فتح الحزمة
k this deck
49
Solve the problem.
-The harmonic mean is often used as a measure of center for data sets consisting of rates of change, such as speeds. It is found by dividing the number of values (n)by the sum of the reciprocals of all values, expressed as Pierre drives to work (a distance of 57 miles)at a speed of 73 mi/h and returns home at a speed of 53 mi/h. What is his average speed for the round trip? Use the harmonic mean.
A)63.0 mi/h
B)62.2 mi/h
C)61.4 mi/h
D)63.3 mi/h
فتح الحزمة
افتح القفل للوصول البطاقات البالغ عددها 149 في هذه المجموعة.
فتح الحزمة
k this deck
50
Find the range for the given data.
-To get the best deal on a microwave oven, Jeremy called six appliance stores and asked the cost of a specific model. The prices he was quoted are listed below:
Compute the range.
A)$111
B)$154
C)$552
D)$557
-To get the best deal on a microwave oven, Jeremy called six appliance stores and asked the cost of a specific model. The prices he was quoted are listed below:
Compute the range.
A)$111
B)$154
C)$552
D)$557
فتح الحزمة
افتح القفل للوصول البطاقات البالغ عددها 149 في هذه المجموعة.
فتح الحزمة
k this deck
51
Solve the problem.
-When data are summarized in a frequency distribution, the median can be found by first identifying the median class (the class that contains the median). We then assume that the values in that class are evenly distributed and we can interpolate. This process can be described by where n is the sum of all class frequencies and m is the sum of the class frequencies that precede the median class. Use this procedure to find the median of the frequency distribution below:
A)74.5
B)71.8
C)72.5
D)72.0
فتح الحزمة
افتح القفل للوصول البطاقات البالغ عددها 149 في هذه المجموعة.
فتح الحزمة
k this deck
52
Find the range for the given data.
-The manager of an electrical supply store measured the diameters of the rolls of wire in the inventory. The diameters of the rolls (in m)are listed below.
Compute the range.
A)0.119
B)0.497
C)0.099
D)0.528
-The manager of an electrical supply store measured the diameters of the rolls of wire in the inventory. The diameters of the rolls (in m)are listed below.
Compute the range.
A)0.119
B)0.497
C)0.099
D)0.528
فتح الحزمة
افتح القفل للوصول البطاقات البالغ عددها 149 في هذه المجموعة.
فتح الحزمة
k this deck
53
Solve the problem.
The mean salary of the female employees of one company is $29,525. The mean salary of the male employees of the same company is $33,470. Can the mean salary of all employees of the company be obtained by finding the mean of $29,525 and $33,470? Explain your thinking. Under what conditions would the mean of $29,525 and $33,470 yield the mean salary of all employees of the company?
The mean salary of the female employees of one company is $29,525. The mean salary of the male employees of the same company is $33,470. Can the mean salary of all employees of the company be obtained by finding the mean of $29,525 and $33,470? Explain your thinking. Under what conditions would the mean of $29,525 and $33,470 yield the mean salary of all employees of the company?
فتح الحزمة
افتح القفل للوصول البطاقات البالغ عددها 149 في هذه المجموعة.
فتح الحزمة
k this deck
54
Solve the problem.
-The data below consists of the heights (in inches)of 20 randomly selected women. Find the 10% trimmed mean of the data set. The 10% trimmed mean is found by arranging the data in order, deleting the bottom 10% of the values and the top 10% of the values and then calculating the mean of the remaining values.
A)64.9 in
B)65.1 in
C)64.8 in
D)51.9 in
فتح الحزمة
افتح القفل للوصول البطاقات البالغ عددها 149 في هذه المجموعة.
فتح الحزمة
k this deck
55
Find the midrange for the given sample data.
-Fred, a local mechanic, gathered the following data regarding the price, in dollars, of an oil and filter change at twelve competing service stations:
Compute the range.
A)$8
B)$14
C)$12
D)$10
-Fred, a local mechanic, gathered the following data regarding the price, in dollars, of an oil and filter change at twelve competing service stations:
Compute the range.
A)$8
B)$14
C)$12
D)$10
فتح الحزمة
افتح القفل للوصول البطاقات البالغ عددها 149 في هذه المجموعة.
فتح الحزمة
k this deck
56
Solve the problem.
Elaine gets quiz grades of 60, 69, and 68. She gets a 65 on her final exam. Find the weighted mean if the quizzes each count for 10% and the final exam counts for 70% of the final grade.
A)65.3
B)62.2
C)65.5
D)65.2
Elaine gets quiz grades of 60, 69, and 68. She gets a 65 on her final exam. Find the weighted mean if the quizzes each count for 10% and the final exam counts for 70% of the final grade.
A)65.3
B)62.2
C)65.5
D)65.2
فتح الحزمة
افتح القفل للوصول البطاقات البالغ عددها 149 في هذه المجموعة.
فتح الحزمة
k this deck
57
Find the range for the given data.
-The owner of a small manufacturing plant employs six people. As part of their personnel file, she asked each one to record to the nearest one-tenth of a mile the distance they travel one way from home to work. The six distances are listed below:
Compute the range.
A)5.4
B)5.1
C)1.6
D)1.2
-The owner of a small manufacturing plant employs six people. As part of their personnel file, she asked each one to record to the nearest one-tenth of a mile the distance they travel one way from home to work. The six distances are listed below:
Compute the range.
A)5.4
B)5.1
C)1.6
D)1.2
فتح الحزمة
افتح القفل للوصول البطاقات البالغ عددها 149 في هذه المجموعة.
فتح الحزمة
k this deck
58
Find the range for the given data.
-A class of sixth grade students kept accurate records on the amount of time they spent playing video games during a one-week period. The times (in hours)are listed below:
Compute the range.
A)11.1
B)20
C)9.2
D)13.8
-A class of sixth grade students kept accurate records on the amount of time they spent playing video games during a one-week period. The times (in hours)are listed below:
Compute the range.
A)11.1
B)20
C)9.2
D)13.8
فتح الحزمة
افتح القفل للوصول البطاقات البالغ عددها 149 في هذه المجموعة.
فتح الحزمة
k this deck
59
Find the midrange for the given sample data.
9, 5, -4, 9, and -2
A)39.7
B)29.8
C)37.3
D)37.2
9, 5, -4, 9, and -2
A)39.7
B)29.8
C)37.3
D)37.2
فتح الحزمة
افتح القفل للوصول البطاقات البالغ عددها 149 في هذه المجموعة.
فتح الحزمة
k this deck
60
Find the midrange for the given sample data.
-Compute the variance. Jeanne is currently taking college zoology. The instructor often gives quizzes. On the past five quizzes, Jeanne got the following scores:
A)26.7
B)1.5
C)1.2
D)1.4
-Compute the variance. Jeanne is currently taking college zoology. The instructor often gives quizzes. On the past five quizzes, Jeanne got the following scores:
A)26.7
B)1.5
C)1.2
D)1.4
فتح الحزمة
افتح القفل للوصول البطاقات البالغ عددها 149 في هذه المجموعة.
فتح الحزمة
k this deck
61
Find the variance for the given data. Round your answer to one more decimal place than the original data.
-The manager of an electrical supply store measured the diameters of the rolls of wire in the inventory. The diameters of the rolls (in m)are listed below. Compute the standard deviation s.
A)1.1718
B)0.568
C)0.2193
D)1.4602
-The manager of an electrical supply store measured the diameters of the rolls of wire in the inventory. The diameters of the rolls (in m)are listed below. Compute the standard deviation s.
A)1.1718
B)0.568
C)0.2193
D)1.4602
فتح الحزمة
افتح القفل للوصول البطاقات البالغ عددها 149 في هذه المجموعة.
فتح الحزمة
k this deck
62
Find the variance for the given data. Round your answer to one more decimal place than the original data.
-Christine is currently taking college astronomy. The instructor often gives quizzes. On the past seven quizzes, Christine got the following scores: Compute the standard deviation s.
A)10,637
B)8715.6
C)38
D)17.9
-Christine is currently taking college astronomy. The instructor often gives quizzes. On the past seven quizzes, Christine got the following scores: Compute the standard deviation s.
A)10,637
B)8715.6
C)38
D)17.9
فتح الحزمة
افتح القفل للوصول البطاقات البالغ عددها 149 في هذه المجموعة.
فتح الحزمة
k this deck
63
Find the variance for the given data. Round your answer to one more decimal place than the original data.
196, 205, 215, 185, 229, 278, 165
A)33.1
B)30.2
C)36.2
D)12.7
196, 205, 215, 185, 229, 278, 165
A)33.1
B)30.2
C)36.2
D)12.7
فتح الحزمة
افتح القفل للوصول البطاقات البالغ عددها 149 في هذه المجموعة.
فتح الحزمة
k this deck
64
Find the standard deviation for the given data. Round your answer to one more decimal place than the original data.
-When investigating times required for drive-through service, the following results (in seconds)were obtained.
A)Restaurant A: 57; 493.98; 22.23
B)Restaurant A: 57; 493.98; 24.97 Restaurant B: 77; 727.98; 26.98 Restaurant B: 70; 722.53; 26.98
C)Restaurant A: 75; 493.98; 22.23
D)Restaurant A: 57; 493.98; 22.23 Restaurant B: 70; 727.98; 26.98 Restaurant B: 56; 727.98; 32.89
فتح الحزمة
افتح القفل للوصول البطاقات البالغ عددها 149 في هذه المجموعة.
فتح الحزمة
k this deck
65
Find the variance for the given data. Round your answer to one more decimal place than the original data.
22, 29, 21, 24, 27, 28, 25, 36
A)4.8
B)2.8
C)1.6
D)4.2
22, 29, 21, 24, 27, 28, 25, 36
A)4.8
B)2.8
C)1.6
D)4.2
فتح الحزمة
افتح القفل للوصول البطاقات البالغ عددها 149 في هذه المجموعة.
فتح الحزمة
k this deck
66
Find the variance for the given data. Round your answer to one more decimal place than the original data.
496, 598, 503, 528, 565, 601, 576, 543
A)60.6
B)182.1
C)170.2
D)40.4
496, 598, 503, 528, 565, 601, 576, 543
A)60.6
B)182.1
C)170.2
D)40.4
فتح الحزمة
افتح القفل للوصول البطاقات البالغ عددها 149 في هذه المجموعة.
فتح الحزمة
k this deck
67
Find the range, variance, and standard deviation for each of the two samples, then compare the two sets of results.
-When investigating times required for drive-through service, the following results (in seconds)were obtained.
A)Restaurant A: 44; 285.64; 16.15
B)Restaurant A: 46; 260.79; 16.15 Restaurant B: 46; 260.79; 16.90 Restaurant B: 44; 285.64; 16.90
C)Restaurant A: 44; 260.79; 16.15
D)Restaurant A: 46; 260.79; 16.90 Restaurant B: 46; 285.64; 16.90 Restaurant B: 44; 285.64; 16.15
فتح الحزمة
افتح القفل للوصول البطاقات البالغ عددها 149 في هذه المجموعة.
فتح الحزمة
k this deck
68
Find the variance for the given data. Round your answer to one more decimal place than the original data.
-To get the best deal on a CD player, Tom called eight appliance stores and asked the cost of a specific model. The prices he was quoted are listed below:
Compute the standard deviation s.
A)$114.2
B)$329.0
C)$653,796.1
D)$745,051.0
-To get the best deal on a CD player, Tom called eight appliance stores and asked the cost of a specific model. The prices he was quoted are listed below:
Compute the standard deviation s.
A)$114.2
B)$329.0
C)$653,796.1
D)$745,051.0
فتح الحزمة
افتح القفل للوصول البطاقات البالغ عددها 149 في هذه المجموعة.
فتح الحزمة
k this deck
69
Find the midrange for the given sample data.
-Compute the variance. A class of sixth grade students kept accurate records on the amount of time they spent playing video games during a one-week period. The times (in hours)are listed below:
A)152.13
B)25.14
C)27.84
D)27.94
-Compute the variance. A class of sixth grade students kept accurate records on the amount of time they spent playing video games during a one-week period. The times (in hours)are listed below:
A)152.13
B)25.14
C)27.84
D)27.94
فتح الحزمة
افتح القفل للوصول البطاقات البالغ عددها 149 في هذه المجموعة.
فتح الحزمة
k this deck
70
Find the variance for the given data. Round your answer to one more decimal place than the original data.
-The manager of a small dry cleaner employs six people. As part of their personnel file, she asked each one to record to the nearest one-tenth of a mile the distance they travel one way from home to work. The six distances are listed below:
Compute the standard deviation s.
A)38.4
B)3962.9
C)4495.2
D)10.32
فتح الحزمة
افتح القفل للوصول البطاقات البالغ عددها 149 في هذه المجموعة.
فتح الحزمة
k this deck
71
Find the range, variance, and standard deviation for each of the two samples, then compare the two sets of results.
-The manager of a bank recorded the amount of time each customer spent waiting in line during peak business hours one Monday. The frequency distribution below summarizes the results. Find the standard deviation. Round your answer to one decimal place.
A)4.9
B)5.2
C)7.0
D)4.7
-The manager of a bank recorded the amount of time each customer spent waiting in line during peak business hours one Monday. The frequency distribution below summarizes the results. Find the standard deviation. Round your answer to one decimal place.
A)4.9
B)5.2
C)7.0
D)4.7
فتح الحزمة
افتح القفل للوصول البطاقات البالغ عددها 149 في هذه المجموعة.
فتح الحزمة
k this deck
72
Find the range, variance, and standard deviation for each of the two samples, then compare the two sets of results.
-The test scores of 40 students are summarized in the frequency distribution below. Find the standard deviation.
A)s = 13.4
B)s = 14.9
C)s = 15.6
D)s = 14.2
-The test scores of 40 students are summarized in the frequency distribution below. Find the standard deviation.
A)s = 13.4
B)s = 14.9
C)s = 15.6
D)s = 14.2
فتح الحزمة
افتح القفل للوصول البطاقات البالغ عددها 149 في هذه المجموعة.
فتح الحزمة
k this deck
73
Find the variance for the given data. Round your answer to one more decimal place than the original data.
2, 6, 15, 9, 11, 22, 1, 4, 8, 19
A)2.1
B)6.3
C)6.8
D)7.1
2, 6, 15, 9, 11, 22, 1, 4, 8, 19
A)2.1
B)6.3
C)6.8
D)7.1
فتح الحزمة
افتح القفل للوصول البطاقات البالغ عددها 149 في هذه المجموعة.
فتح الحزمة
k this deck
74
Find the variance for the given data. Round your answer to one more decimal place than the original data.
-The normal monthly precipitation (in inches)for August is listed for 12 different U.S. cities.
Compute the variance.
A)1.05
B)0.94
C)1.09
D)1.00
-The normal monthly precipitation (in inches)for August is listed for 12 different U.S. cities.
Compute the variance.
A)1.05
B)0.94
C)1.09
D)1.00
فتح الحزمة
افتح القفل للوصول البطاقات البالغ عددها 149 في هذه المجموعة.
فتح الحزمة
k this deck
75
Solve the problem.
-The heights in feet of people who work in an office are as follows. Use the range rule of thumb to find the standard deviation. Round results to the nearest tenth.
A)0.1
B)0.2
C)0.5
D)1.2
-The heights in feet of people who work in an office are as follows. Use the range rule of thumb to find the standard deviation. Round results to the nearest tenth.
A)0.1
B)0.2
C)0.5
D)1.2
فتح الحزمة
افتح القفل للوصول البطاقات البالغ عددها 149 في هذه المجموعة.
فتح الحزمة
k this deck
76
Find the midrange for the given sample data.
-Compute the variance. To get the best deal on a microwave oven, Jeremy called six appliance stores and asked the cost of a specific model. The prices he was quoted are listed below:
A)40,214.5
B)28,452.3
C)23,710.2
D)28,452.2
-Compute the variance. To get the best deal on a microwave oven, Jeremy called six appliance stores and asked the cost of a specific model. The prices he was quoted are listed below:
A)40,214.5
B)28,452.3
C)23,710.2
D)28,452.2
فتح الحزمة
افتح القفل للوصول البطاقات البالغ عددها 149 في هذه المجموعة.
فتح الحزمة
k this deck
77
Find the range, variance, and standard deviation for each of the two samples, then compare the two sets of results.
-A company had 80 employees whose salaries are summarized in the frequency distribution below. Find the standard deviation.
A)s = 7168.6
B)s = 7742.1
C)s = 7527.0
D)s = 7957.1
-A company had 80 employees whose salaries are summarized in the frequency distribution below. Find the standard deviation.
A)s = 7168.6
B)s = 7742.1
C)s = 7527.0
D)s = 7957.1
فتح الحزمة
افتح القفل للوصول البطاقات البالغ عددها 149 في هذه المجموعة.
فتح الحزمة
k this deck
78
Find the standard deviation for the given data. Round your answer to one more decimal place than the original data.
-The normal monthly precipitation (in inches)for August is listed for 12 different U.S. cities.
Compute the standard deviation.
A)1.09
B)1.05
C)1.00
D)12.03
-The normal monthly precipitation (in inches)for August is listed for 12 different U.S. cities.
Compute the standard deviation.
A)1.09
B)1.05
C)1.00
D)12.03
فتح الحزمة
افتح القفل للوصول البطاقات البالغ عددها 149 في هذه المجموعة.
فتح الحزمة
k this deck
79
Find the midrange for the given sample data.
-The weights (in ounces)of 10 cookies are shown. Compute the variance.
A)0.064
B)0.077
C)0.086
D)0.07
-The weights (in ounces)of 10 cookies are shown. Compute the variance.
A)0.064
B)0.077
C)0.086
D)0.07
فتح الحزمة
افتح القفل للوصول البطاقات البالغ عددها 149 في هذه المجموعة.
فتح الحزمة
k this deck
80
Find the variance for the given data. Round your answer to one more decimal place than the original data.
15, 42, 53, 7, 9, 12, 14, 28, 47
A)29.1
B)17.8
C)15.8
D)16.6
15, 42, 53, 7, 9, 12, 14, 28, 47
A)29.1
B)17.8
C)15.8
D)16.6
فتح الحزمة
افتح القفل للوصول البطاقات البالغ عددها 149 في هذه المجموعة.
فتح الحزمة
k this deck
فتح الحزمة
افتح القفل للوصول البطاقات البالغ عددها 149 في هذه المجموعة.


