Deck 10: Correlation and Regression
سؤال
سؤال
سؤال
سؤال
سؤال
سؤال
سؤال
سؤال
سؤال
سؤال
سؤال
سؤال
سؤال
سؤال
سؤال
سؤال
سؤال
سؤال
سؤال
سؤال
سؤال
سؤال
سؤال
سؤال
سؤال
سؤال
سؤال
سؤال
سؤال
سؤال
سؤال
سؤال
سؤال
سؤال
سؤال
سؤال
سؤال
سؤال
سؤال
سؤال
سؤال
سؤال
سؤال
سؤال
سؤال
سؤال
سؤال
سؤال
سؤال
سؤال
سؤال
سؤال
سؤال
سؤال
سؤال
سؤال
سؤال
سؤال
سؤال
سؤال
سؤال
سؤال
سؤال
سؤال
سؤال
سؤال
سؤال
سؤال
سؤال
سؤال
سؤال
سؤال
سؤال

فتح الحزمة
قم بالتسجيل لفتح البطاقات في هذه المجموعة!
Unlock Deck
Unlock Deck
1/73
العب
ملء الشاشة (f)
Deck 10: Correlation and Regression
1
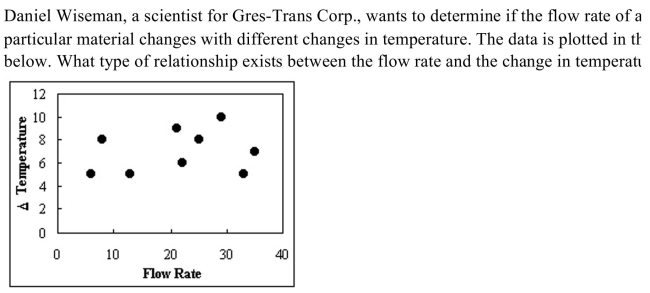
A) positive
B) There is no relationship.
C) curvilinear
D) negative
B
2


3

False
4
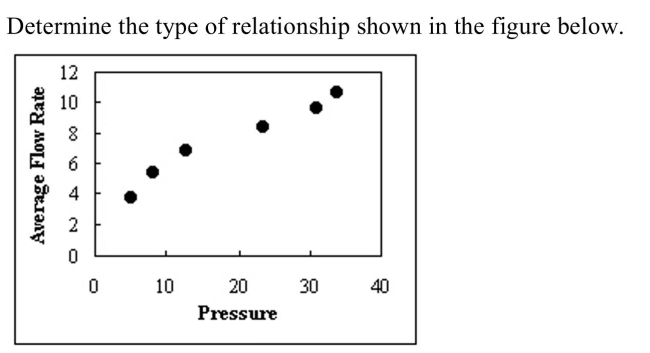
A) multiple
B) positive
C) There is no relationship.
D) negative

فتح الحزمة
افتح القفل للوصول البطاقات البالغ عددها 73 في هذه المجموعة.
فتح الحزمة
k this deck
5
If there is a strong negative linear relationship between the variables, the value of
will be close to -1.
will be close to -1.

فتح الحزمة
افتح القفل للوصول البطاقات البالغ عددها 73 في هذه المجموعة.
فتح الحزمة
k this deck
6

فتح الحزمة
افتح القفل للوصول البطاقات البالغ عددها 73 في هذه المجموعة.
فتح الحزمة
k this deck
7
The two variables in a scatter plot are called the
A) independent variable and dependent variable.
B) lines and points.
C) spread and pattern.
D) relative frequency and relative proportion.
A) independent variable and dependent variable.
B) lines and points.
C) spread and pattern.
D) relative frequency and relative proportion.

فتح الحزمة
افتح القفل للوصول البطاقات البالغ عددها 73 في هذه المجموعة.
فتح الحزمة
k this deck
8
The range of the correlation coefficient is from 0 to 1.

فتح الحزمة
افتح القفل للوصول البطاقات البالغ عددها 73 في هذه المجموعة.
فتح الحزمة
k this deck
9
In a relationship, as one variable increases, the other variable
decreases, and vice versa.
decreases, and vice versa.

فتح الحزمة
افتح القفل للوصول البطاقات البالغ عددها 73 في هذه المجموعة.
فتح الحزمة
k this deck
10

A) Because 0.790 is greater than 0.602, the null hypothesis is not rejected.
B) There is no correlation between the variables.
C) Because 0.790 is greater than 0.632, the null hypothesis is rejected.
D) Because 0.790 is greater than 0.632, the null hypothesis is not rejected.

فتح الحزمة
افتح القفل للوصول البطاقات البالغ عددها 73 في هذه المجموعة.
فتح الحزمة
k this deck
11
The rounding rule for the correlation coefficient requires two decimal places.

فتح الحزمة
افتح القفل للوصول البطاقات البالغ عددها 73 في هذه المجموعة.
فتح الحزمة
k this deck
12
A positive relationship exists when both variables increase or decrease at the same time.

فتح الحزمة
افتح القفل للوصول البطاقات البالغ عددها 73 في هذه المجموعة.
فتح الحزمة
k this deck
13

فتح الحزمة
افتح القفل للوصول البطاقات البالغ عددها 73 في هذه المجموعة.
فتح الحزمة
k this deck
14
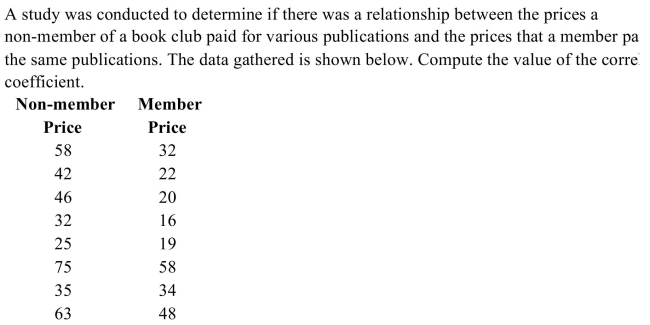
A) 0.932
B) 0.679
C) 0.857
D) 0.762

فتح الحزمة
افتح القفل للوصول البطاقات البالغ عددها 73 في هذه المجموعة.
فتح الحزمة
k this deck
15
is a statistical method used to determine whether a relationship
between variables exists.
between variables exists.

فتح الحزمة
افتح القفل للوصول البطاقات البالغ عددها 73 في هذه المجموعة.
فتح الحزمة
k this deck
16
Which of the following does not explain a possible relationship between variables when the null hypothesis is rejected?
A) caused by a third variable
B) uncorrelated
C) direct cause-and-effect
D) negative effect
A) caused by a third variable
B) uncorrelated
C) direct cause-and-effect
D) negative effect

فتح الحزمة
افتح القفل للوصول البطاقات البالغ عددها 73 في هذه المجموعة.
فتح الحزمة
k this deck
17

فتح الحزمة
افتح القفل للوصول البطاقات البالغ عددها 73 في هذه المجموعة.
فتح الحزمة
k this deck
18


فتح الحزمة
افتح القفل للوصول البطاقات البالغ عددها 73 في هذه المجموعة.
فتح الحزمة
k this deck
19


فتح الحزمة
افتح القفل للوصول البطاقات البالغ عددها 73 في هذه المجموعة.
فتح الحزمة
k this deck
20

A) 0.644
B) 0.826
C) 0.814
D) 0.774

فتح الحزمة
افتح القفل للوصول البطاقات البالغ عددها 73 في هذه المجموعة.
فتح الحزمة
k this deck
21
A regression line can be used to show trends in data.

فتح الحزمة
افتح القفل للوصول البطاقات البالغ عددها 73 في هذه المجموعة.
فتح الحزمة
k this deck
22

فتح الحزمة
افتح القفل للوصول البطاقات البالغ عددها 73 في هذه المجموعة.
فتح الحزمة
k this deck
23


فتح الحزمة
افتح القفل للوصول البطاقات البالغ عددها 73 في هذه المجموعة.
فتح الحزمة
k this deck
24


فتح الحزمة
افتح القفل للوصول البطاقات البالغ عددها 73 في هذه المجموعة.
فتح الحزمة
k this deck
25

A) 3
B) 6
C) -8
D) -5

فتح الحزمة
افتح القفل للوصول البطاقات البالغ عددها 73 في هذه المجموعة.
فتح الحزمة
k this deck
26

فتح الحزمة
افتح القفل للوصول البطاقات البالغ عددها 73 في هذه المجموعة.
فتح الحزمة
k this deck
27

A) 11.7
B) 4.73
C) 5.29
D) 34.5

فتح الحزمة
افتح القفل للوصول البطاقات البالغ عددها 73 في هذه المجموعة.
فتح الحزمة
k this deck
28


فتح الحزمة
افتح القفل للوصول البطاقات البالغ عددها 73 في هذه المجموعة.
فتح الحزمة
k this deck
29
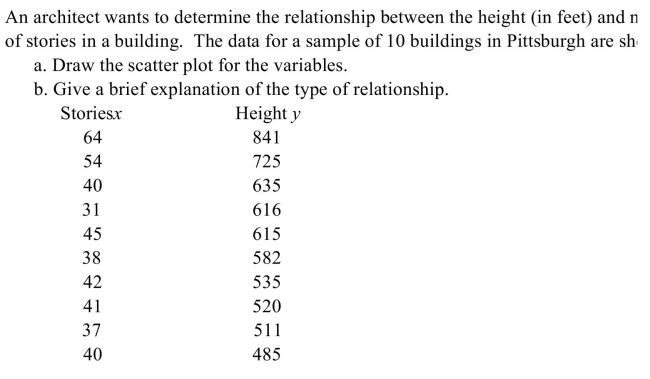

فتح الحزمة
افتح القفل للوصول البطاقات البالغ عددها 73 في هذه المجموعة.
فتح الحزمة
k this deck
30

A) 12
B) 6
C) -8
D) -2

فتح الحزمة
افتح القفل للوصول البطاقات البالغ عددها 73 في هذه المجموعة.
فتح الحزمة
k this deck
31
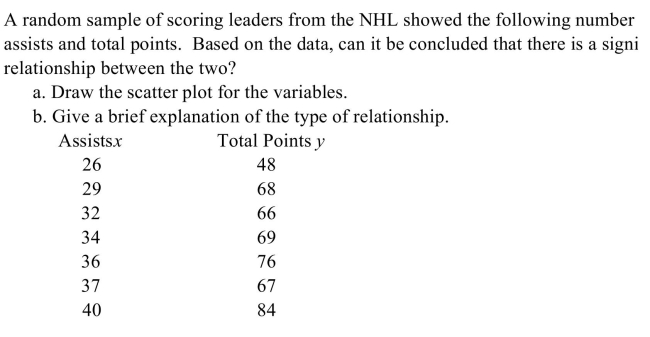

فتح الحزمة
افتح القفل للوصول البطاقات البالغ عددها 73 في هذه المجموعة.
فتح الحزمة
k this deck
32


فتح الحزمة
افتح القفل للوصول البطاقات البالغ عددها 73 في هذه المجموعة.
فتح الحزمة
k this deck
33
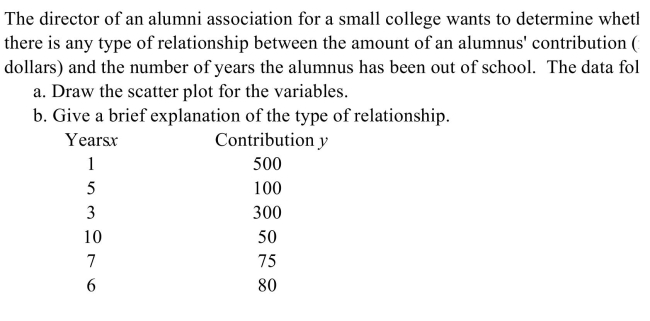

فتح الحزمة
افتح القفل للوصول البطاقات البالغ عددها 73 في هذه المجموعة.
فتح الحزمة
k this deck
34

A) 3
B) 9
C) 2
D) -25

فتح الحزمة
افتح القفل للوصول البطاقات البالغ عددها 73 في هذه المجموعة.
فتح الحزمة
k this deck
35

A) 23
B) 19
C) 14
D) 13

فتح الحزمة
افتح القفل للوصول البطاقات البالغ عددها 73 في هذه المجموعة.
فتح الحزمة
k this deck
36
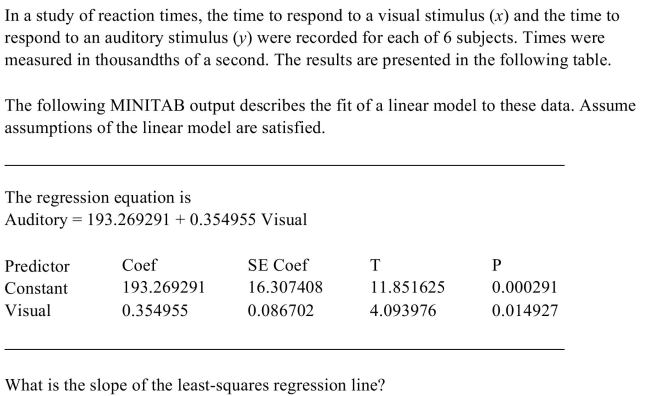
A) 0.354955
B) 11.851625
C) 0.086702
D) 193.269291

فتح الحزمة
افتح القفل للوصول البطاقات البالغ عددها 73 في هذه المجموعة.
فتح الحزمة
k this deck
37

A) 3.2
B) 0
C) 4.6
D) -4.6

فتح الحزمة
افتح القفل للوصول البطاقات البالغ عددها 73 في هذه المجموعة.
فتح الحزمة
k this deck
38
Regression is a statistical method used to describe the nature of the relationship between
variables.
variables.

فتح الحزمة
افتح القفل للوصول البطاقات البالغ عددها 73 في هذه المجموعة.
فتح الحزمة
k this deck
39
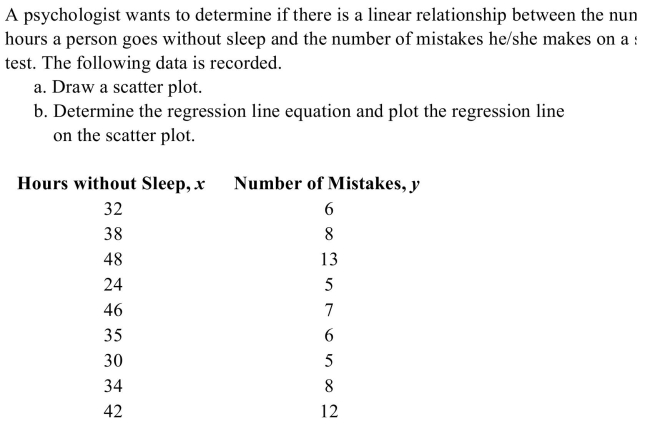

فتح الحزمة
افتح القفل للوصول البطاقات البالغ عددها 73 في هذه المجموعة.
فتح الحزمة
k this deck
40
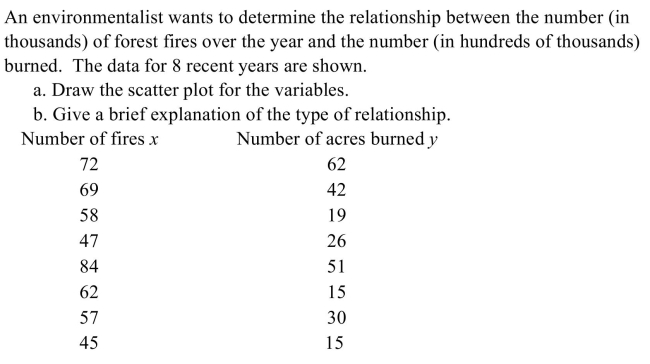

فتح الحزمة
افتح القفل للوصول البطاقات البالغ عددها 73 في هذه المجموعة.
فتح الحزمة
k this deck
41
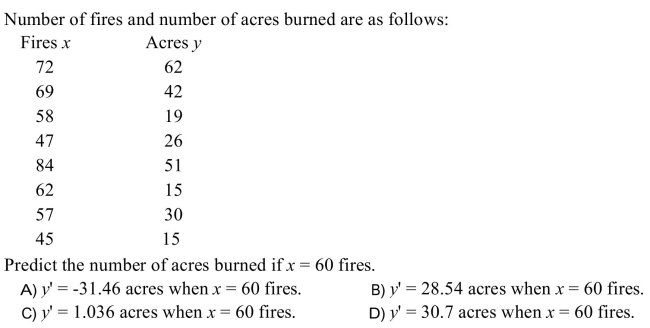

فتح الحزمة
افتح القفل للوصول البطاقات البالغ عددها 73 في هذه المجموعة.
فتح الحزمة
k this deck
42

A) The error in estimating the slope
B) The standard error of the estimate
C) The error in estimating the intercept
D) All of the above

فتح الحزمة
افتح القفل للوصول البطاقات البالغ عددها 73 في هذه المجموعة.
فتح الحزمة
k this deck
43
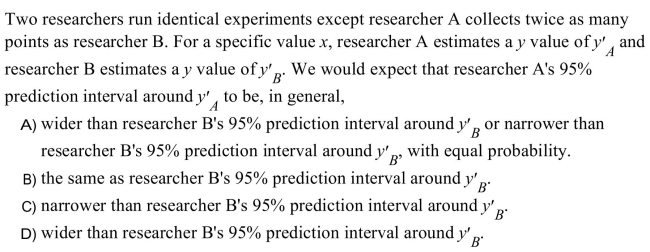

فتح الحزمة
افتح القفل للوصول البطاقات البالغ عددها 73 في هذه المجموعة.
فتح الحزمة
k this deck
44


فتح الحزمة
افتح القفل للوصول البطاقات البالغ عددها 73 في هذه المجموعة.
فتح الحزمة
k this deck
45
If the correlation coefficient is 0.930, what is the unexplained variation?
A) 86.5%
B) 7%
C) 93%
D) 13.5%
A) 86.5%
B) 7%
C) 93%
D) 13.5%

فتح الحزمة
افتح القفل للوصول البطاقات البالغ عددها 73 في هذه المجموعة.
فتح الحزمة
k this deck
46


فتح الحزمة
افتح القفل للوصول البطاقات البالغ عددها 73 في هذه المجموعة.
فتح الحزمة
k this deck
47
A researcher has reason to believe that, for an experiment with 30 points, a 95%
prediction interval would be of width 8. If the researcher wishes to run a more
precise experiment that will result in a 95% prediction interval of width 4, then
the researcher will require how many points?
prediction interval would be of width 8. If the researcher wishes to run a more
precise experiment that will result in a 95% prediction interval of width 4, then
the researcher will require how many points?

فتح الحزمة
افتح القفل للوصول البطاقات البالغ عددها 73 في هذه المجموعة.
فتح الحزمة
k this deck
48
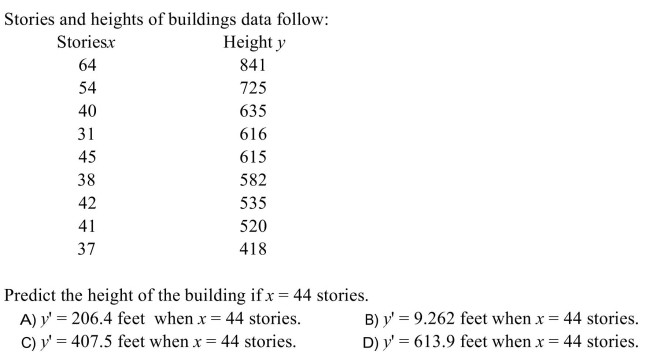

فتح الحزمة
افتح القفل للوصول البطاقات البالغ عددها 73 في هذه المجموعة.
فتح الحزمة
k this deck
49
As a researcher collects more and more data, the 95% prediction intervals in general
A) become narrower and narrower, but the widths are always more than approximately 4 times the slope.
B) become narrower and narrower, but the widths are always more than approximately 2 times the standard error of the estimate.
C) become narrower and narrower, with the widths getting closer and closer to 0.
D) become narrower and narrower, but the widths are always more than approximately 4 times the standard error of the estimate.

فتح الحزمة
افتح القفل للوصول البطاقات البالغ عددها 73 في هذه المجموعة.
فتح الحزمة
k this deck
50
The variation due to chance, found by the formula , is called the
unexplained variation.
unexplained variation.

فتح الحزمة
افتح القفل للوصول البطاقات البالغ عددها 73 في هذه المجموعة.
فتح الحزمة
k this deck
51


فتح الحزمة
افتح القفل للوصول البطاقات البالغ عددها 73 في هذه المجموعة.
فتح الحزمة
k this deck
52


فتح الحزمة
افتح القفل للوصول البطاقات البالغ عددها 73 في هذه المجموعة.
فتح الحزمة
k this deck
53
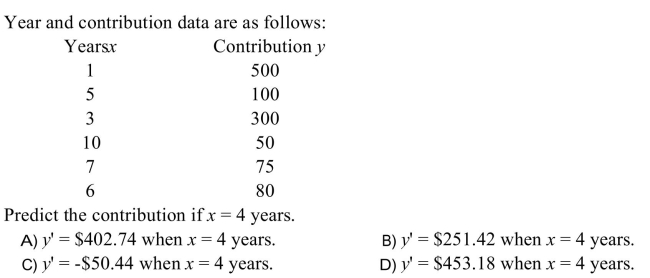

فتح الحزمة
افتح القفل للوصول البطاقات البالغ عددها 73 في هذه المجموعة.
فتح الحزمة
k this deck
54
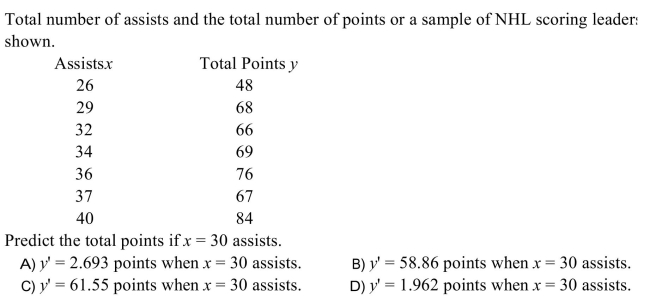

فتح الحزمة
افتح القفل للوصول البطاقات البالغ عددها 73 في هذه المجموعة.
فتح الحزمة
k this deck
55

A) 0.277
B) 0.723
C) 0.725
D) 0.402

فتح الحزمة
افتح القفل للوصول البطاقات البالغ عددها 73 في هذه المجموعة.
فتح الحزمة
k this deck
56
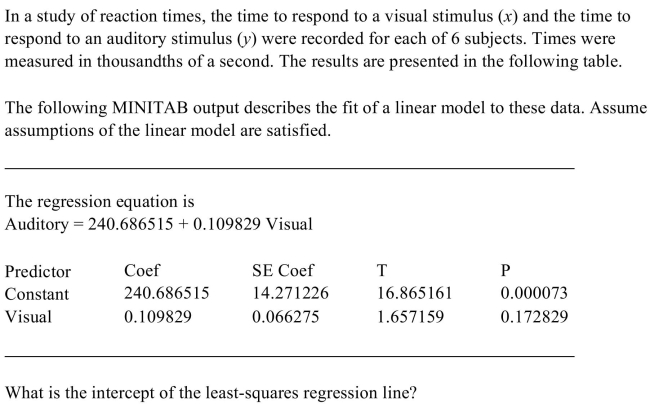
A) 0.109829
B) 0.066275
C) 16.865161
D) 240.686515

فتح الحزمة
افتح القفل للوصول البطاقات البالغ عددها 73 في هذه المجموعة.
فتح الحزمة
k this deck
57
If the correlation coefficient is 0.790, what is the explained variation?
A) 37.6%
B) 79%
C) 21%
D) 62.4%
A) 37.6%
B) 79%
C) 21%
D) 62.4%

فتح الحزمة
افتح القفل للوصول البطاقات البالغ عددها 73 في هذه المجموعة.
فتح الحزمة
k this deck
58


فتح الحزمة
افتح القفل للوصول البطاقات البالغ عددها 73 في هذه المجموعة.
فتح الحزمة
k this deck
59

A) 0.320
B) 0.752
C) 0.680
D) 0.443

فتح الحزمة
افتح القفل للوصول البطاقات البالغ عددها 73 في هذه المجموعة.
فتح الحزمة
k this deck
60
The standard error of estimate is the square root of the unexplained variation.

فتح الحزمة
افتح القفل للوصول البطاقات البالغ عددها 73 في هذه المجموعة.
فتح الحزمة
k this deck
61

A) The coefficient of determination is 0.299 and the coefficient of nondetermination is 0.701
B) The coefficient of determination is 0.701 and the coefficient of nondetermination is 0.299
C) The coefficient of determination is 0.260 and the coefficient of nondetermination is 0.740
D) The coefficient of determination is 0.740 and the coefficient of nondetermination is 0.260

فتح الحزمة
افتح القفل للوصول البطاقات البالغ عددها 73 في هذه المجموعة.
فتح الحزمة
k this deck
62


فتح الحزمة
افتح القفل للوصول البطاقات البالغ عددها 73 في هذه المجموعة.
فتح الحزمة
k this deck
63

A) increase by 39.
B) decrease by 69.
C) decrease by 39.
D) increase by 69.

فتح الحزمة
افتح القفل للوصول البطاقات البالغ عددها 73 في هذه المجموعة.
فتح الحزمة
k this deck
64


فتح الحزمة
افتح القفل للوصول البطاقات البالغ عددها 73 في هذه المجموعة.
فتح الحزمة
k this deck
65

A) 6.36
B) 8.75
C) 7.34
D) 5.49

فتح الحزمة
افتح القفل للوصول البطاقات البالغ عددها 73 في هذه المجموعة.
فتح الحزمة
k this deck
66


فتح الحزمة
افتح القفل للوصول البطاقات البالغ عددها 73 في هذه المجموعة.
فتح الحزمة
k this deck
67

A) 7.47
B) 4.26
C) 6.20
D) 2.76

فتح الحزمة
افتح القفل للوصول البطاقات البالغ عددها 73 في هذه المجموعة.
فتح الحزمة
k this deck
68

A) 400.1
B) 387.2
C) 421.6
D) 615.5

فتح الحزمة
افتح القفل للوصول البطاقات البالغ عددها 73 في هذه المجموعة.
فتح الحزمة
k this deck
69

A) 1.291
B) 1.510
C) 1.289
D) 1.057

فتح الحزمة
افتح القفل للوصول البطاقات البالغ عددها 73 في هذه المجموعة.
فتح الحزمة
k this deck
70

A) 32
B) 6
C) -3
D) 42

فتح الحزمة
افتح القفل للوصول البطاقات البالغ عددها 73 في هذه المجموعة.
فتح الحزمة
k this deck
71


فتح الحزمة
افتح القفل للوصول البطاقات البالغ عددها 73 في هذه المجموعة.
فتح الحزمة
k this deck
72


فتح الحزمة
افتح القفل للوصول البطاقات البالغ عددها 73 في هذه المجموعة.
فتح الحزمة
k this deck
73

A) 0.807
B) 0.539
C) 0.425
D) 0.575

فتح الحزمة
افتح القفل للوصول البطاقات البالغ عددها 73 في هذه المجموعة.
فتح الحزمة
k this deck


