Deck 14: Descriptive Methods in Regression and Correlation
ملء الشاشة (f)
سؤال
سؤال
Solve the problem.
A ball is thrown downward from a tall building with an initial velocity of 10 meters per
second (m/sec). According to the laws of physics, if you let y denote the velocity of the ball
after x seconds, y = 10 + 9.8x. Determine b0 and b1 for this linear equation. Determine the
velocity of the ball after 1, 2, 3, and 4 seconds. Use these four points to graph the linear
equation y = 10 + 9.8x. Use the graph to estimate visually the velocity of the ball after 2.5
seconds.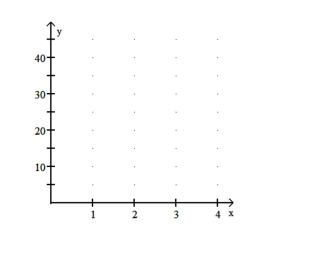
سؤال
Provide an appropriate response.
A regression equation is obtained for the following set of data. For what range of x-values would it be reasonable to use the regression equation to predict
the y-value corresponding to a given x-value? Why?
A regression equation is obtained for the following set of data.
For what range of x-values would it be reasonable to use the regression equation to predictthe y-value corresponding to a given x-value? Why?
سؤال
Solve the problem.
For a compact car, a car-rental company charges $28.50 per day plus $0.15 per mile. For a
one-day rental, let x denote the number of miles driven and let y denote the total cost.
Obtain the equation that expresses y in terms of x. Construct a table of values using the
x-values 70, 140, and 220 miles. Draw the graph of the equation by plotting the points from
the table and connecting them with a straight line. Use the graph to estimate visually the
cost of driving the car 190 miles.
سؤال
Solve the problem.
A car mechanic tells a client that it will cost $120 for parts plus $50 per hour for labor to fix
her car. Let x denote the number of hours of labor and let y denote the total cost to fix the
car. Obtain the equation that expresses y in terms of x. Construct a table of values using the
x-values 2, 3, and 5 hours. Draw the graph of the equation by plotting the points from the
table and connecting them with a straight line. Use the graph to estimate visually the total
cost of fixing the car if the number of hours of labor is 3.5.
سؤال
Solve the problem.
Anne is running a 400-meter race. She runs at a constant speed of 7.5 meters per second. If
you let y denote her distance in meters from the finish line x seconds after the start of the
race, y = 400 - 7.5x. Determine b0 and b1 for this linear equation. Find Anne's distance
from the finish line 10, 24, and 43 seconds after the race begins. Use these three points to
graph the linear equation y = 400 - 7.5x. Use the graph to estimate visually Anne's distance
from the finish line 32 seconds after the start of the race.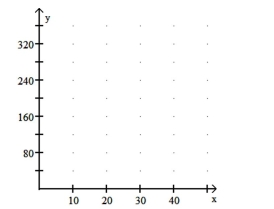
سؤال
سؤال
سؤال
سؤال
سؤال
سؤال
سؤال
سؤال
سؤال
Provide an appropriate response.
Determine which scatterplot shows the strongest linear correlation.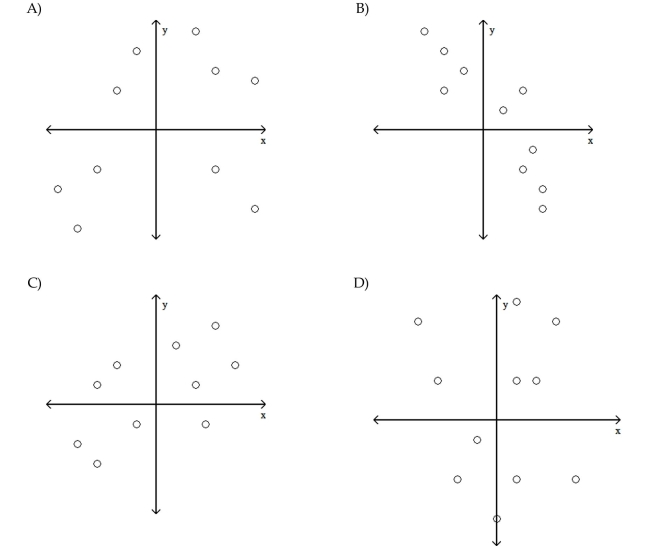
Determine which scatterplot shows the strongest linear correlation.
سؤال
Solve the problem.
For a day's work, Chris is paid $50 to cover expenses plus $16 per hour. Let x denote the
number of hours Chris works in a day and let y denote Chris's total salary for the day.
Obtain the equation that expresses y in terms of x. Construct a table of values using the
x-values 2, 4, and 8 hours. Draw the graph of the equation by plotting the points from the
table and connecting them with a straight line. Use the graph to estimate visually Chris's
salary for the day if he works 6 hours.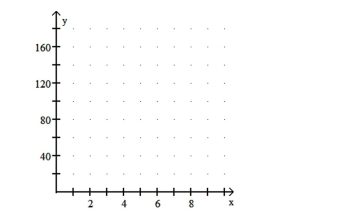
سؤال
Provide an appropriate response.
سؤال
سؤال
سؤال
سؤال

سؤال
Obtain the linear correlation coefficient for the data. Round your answer to three decimal places.

سؤال
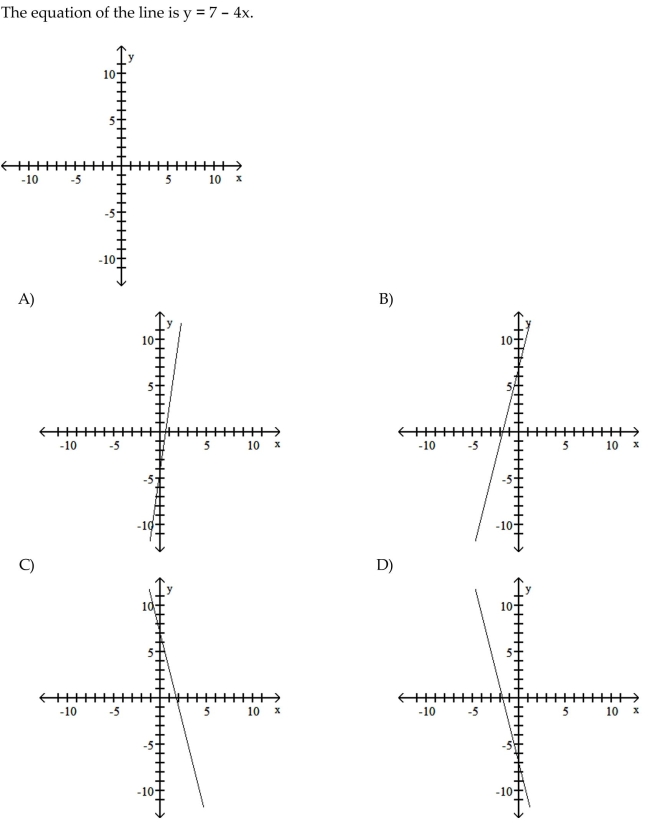
You are given information about a straight line. Use two points to graph the equation.
سؤال
Provide an appropriate response.
سؤال
The y-intercept and slope, respectively, of a straight line are given. Find the equation of the line.
-9 and 4
-9 and 4
سؤال
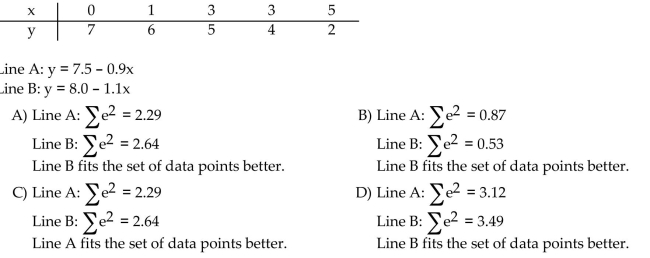
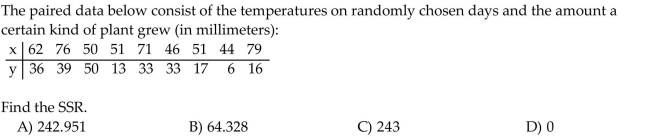
Compute the specified sum of squares. 
سؤال
سؤال
سؤال
سؤال
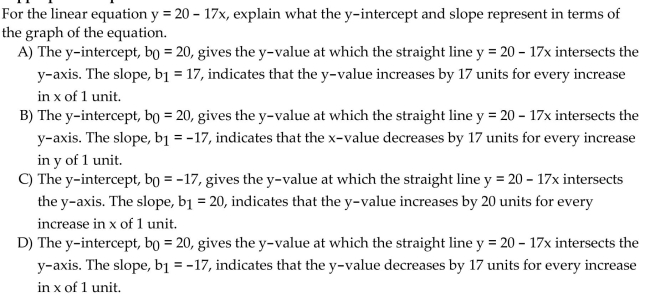
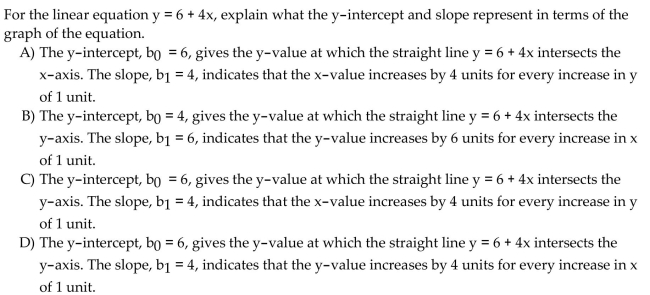
Determine the y-intercept and slope of the linear equation.
سؤال
Provide an appropriate response.
سؤال
Provide an appropriate response.
سؤال
The y-intercept and slope, respectively, of a straight line are given. Find the equation of the line.

سؤال
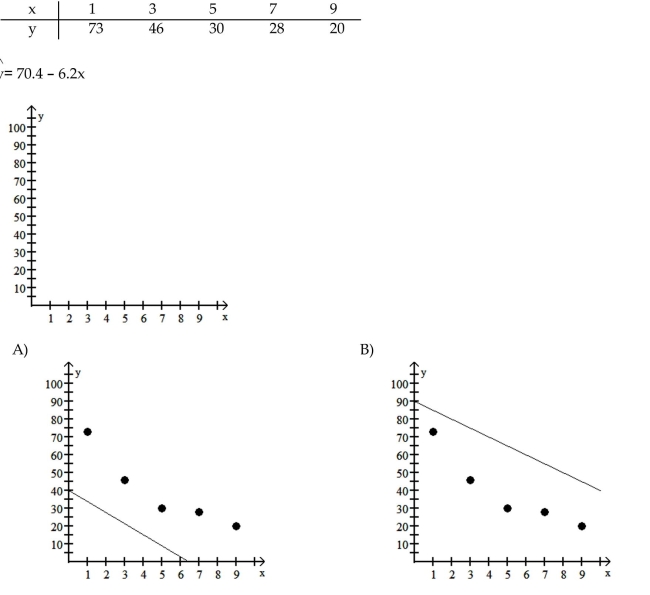
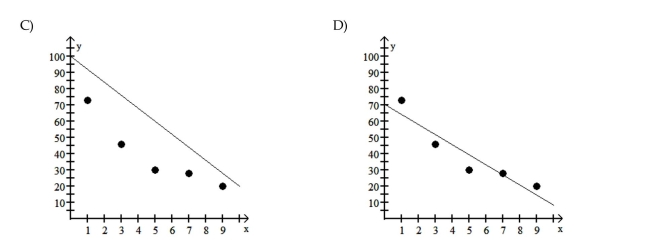
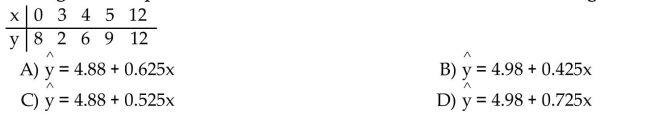
The regression equation for the given data points is provided. Graph the regression equation and the data points.^y
سؤال
Obtain the linear correlation coefficient for the data. Round your answer to three decimal places.

سؤال
سؤال
Provide an appropriate response.
سؤال
Provide an appropriate response.
سؤال
سؤال
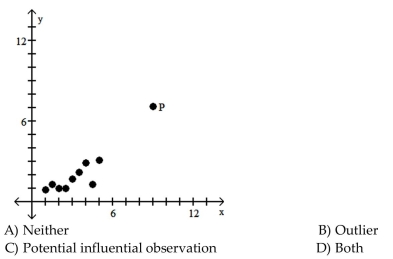
Is the data point, P, an outlier, a potential influential observation, both, or neither?
سؤال
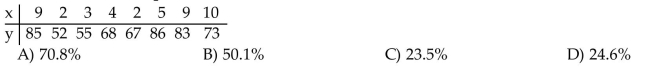
Determine the percentage of variation in the observed values of the response variable that is explained by the regression.Round to the nearest tenth of a percent if needed.
سؤال
The y-intercept and slope, respectively, of a straight line are given. Find the equation of the line.

سؤال
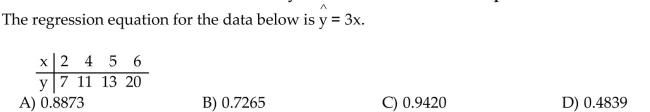
Compute the coefficient of determination. Round your answer to four decimal places.
سؤال
سؤال
Solve the problem.
سؤال
Provide an appropriate response.
سؤال
Obtain the linear correlation coefficient for the data. Round your answer to three decimal places.
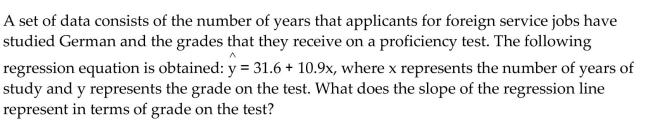
Managers rate employees according to job performance (x)and attitude (y). The results for several randomly selected employees are given below.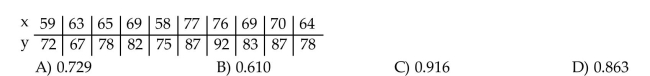
Managers rate employees according to job performance (x)and attitude (y). The results for several randomly selected employees are given below.
سؤال
You are given information about a straight line. Determine whether the line slopes upward, slopes downward, or ishorizontal.

سؤال
Provide an appropriate response.
The table below shows the age and annual income of 12 randomly selected college graduates all living in the city of Seattle.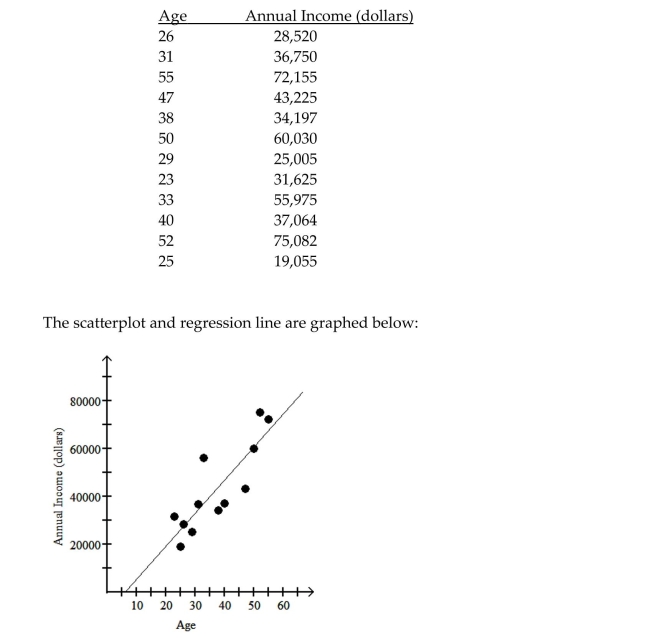 Would it be reasonable to use the regression equation to predict the annual income of a college
Graduate in Seattle who is 90 years old? Explain your answer.
A)No; 90 year olds are outside the age range of the data.
B)No; the regression line does not fit the data very closely.
C)No; regression equations can not be used to predict values for which there is no input data.
D)Yes; the regression line fits the data quite closely.
The table below shows the age and annual income of 12 randomly selected college graduates all living in the city of Seattle.
Would it be reasonable to use the regression equation to predict the annual income of a collegeGraduate in Seattle who is 90 years old? Explain your answer.
A)No; 90 year olds are outside the age range of the data.
B)No; the regression line does not fit the data very closely.
C)No; regression equations can not be used to predict values for which there is no input data.
D)Yes; the regression line fits the data quite closely.
سؤال
You are given information about a straight line. Use two points to graph the equation.
The equation of the line is y = 1 - 0.75x.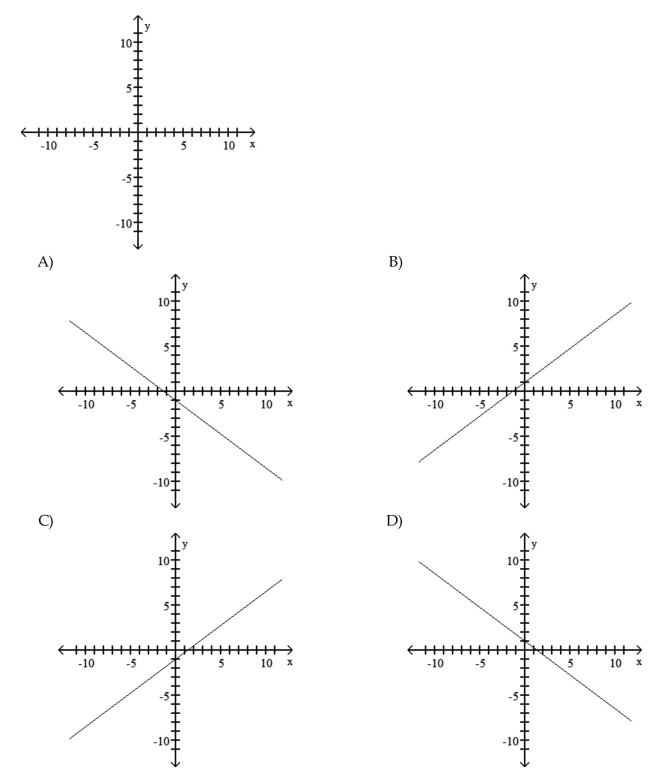
The equation of the line is y = 1 - 0.75x.
سؤال
سؤال
Obtain the linear correlation coefficient for the data. Round your answer to three decimal places.
The data below show the cost of advertising (x), in thousands of dollars, and the number of products sold (y), in thousands, for each of eight randomly selected product lines.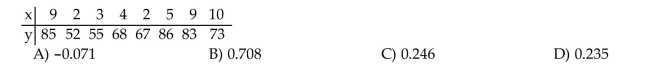
The data below show the cost of advertising (x), in thousands of dollars, and the number of products sold (y), in thousands, for each of eight randomly selected product lines.
سؤال
Determine the regression equation for the data. Round the final values to three significant digits, if necessary.
سؤال
Obtain the linear correlation coefficient for the data. Round your answer to three decimal places.
Two separate tests, x and y, are designed to measure a student's ability to solve problems. Several students are randomly selected to take both tests and their results are shown below.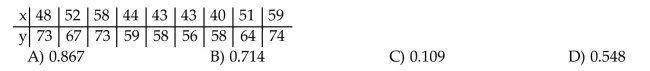
Two separate tests, x and y, are designed to measure a student's ability to solve problems. Several students are randomly selected to take both tests and their results are shown below.
سؤال

فتح الحزمة
قم بالتسجيل لفتح البطاقات في هذه المجموعة!
Unlock Deck
Unlock Deck
1/55
العب
ملء الشاشة (f)
Deck 14: Descriptive Methods in Regression and Correlation
1
Provide an appropriate response.
A regression equation is obtained for a set of data. After examining a scatterplot, the
researcher notices a data point that is potentially an influential observation. How could the
researcher confirm that this data point is indeed an influential observation? How should
the researcher proceed if the data point is found to be an influential observation?
To confirm that the data point is an influential observation, the researcher should
remove that data point and recalculate the regression equation. If the new regression
equation differs markedly from the original regression equation, the researcher can
conclude that the point is an influential observation. The researcher should then try
to determine the reason for the influential observation. If it is due to a measurement
or recording error, the researcher should remove the data point from the data set. If
it is a legitimate data point; the researcher may need to remove it nonetheless or
obtain additional data, so that the regression analysis is not so dependent on one
data point. (Explanations will vary.)
2
Solve the problem.
A ball is thrown downward from a tall building with an initial velocity of 10 meters per
second (m/sec). According to the laws of physics, if you let y denote the velocity of the ball
after x seconds, y = 10 + 9.8x. Determine b0 and b1 for this linear equation. Determine the
velocity of the ball after 1, 2, 3, and 4 seconds. Use these four points to graph the linear
equation y = 10 + 9.8x. Use the graph to estimate visually the velocity of the ball after 2.5
seconds.
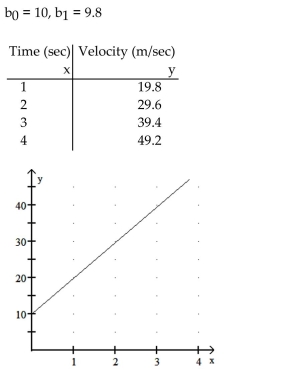 Velocity of the ball after 2.5 seconds is 34.5 m/sec. Estimates should be close to this.
 3
Provide an appropriate response.
A regression equation is obtained for the following set of data. For what range of x-values would it be reasonable to use the regression equation to predict
the y-value corresponding to a given x-value? Why?
A regression equation is obtained for the following set of data.
For what range of x-values would it be reasonable to use the regression equation to predictthe y-value corresponding to a given x-value? Why?
It would be reasonable to use the regression equation to predict the y-value
corresponding to a given x-value for x-values in the range from 2 to 12. We can
reasonably use the regression equation to make predictions for values of the
predictor variable (x)within the range of the observed values of the predictor value,
in this case from 2 to 12. However, to do so for values of the predictor variable
outside that range may not be reasonable, because the linear relationship between
the variables may not hold there. Using the regression equation to make predictions
for values of the predictor variable outside the range of the observed values of the
predictor variable is called extrapolation. Grossly incorrect predictions can result
from extrapolation. (Explanations will vary.)
4
Solve the problem.
For a compact car, a car-rental company charges $28.50 per day plus $0.15 per mile. For a
one-day rental, let x denote the number of miles driven and let y denote the total cost.
Obtain the equation that expresses y in terms of x. Construct a table of values using the
x-values 70, 140, and 220 miles. Draw the graph of the equation by plotting the points from
the table and connecting them with a straight line. Use the graph to estimate visually the
cost of driving the car 190 miles.
فتح الحزمة
افتح القفل للوصول البطاقات البالغ عددها 55 في هذه المجموعة.
فتح الحزمة
k this deck
5
Solve the problem.
A car mechanic tells a client that it will cost $120 for parts plus $50 per hour for labor to fix
her car. Let x denote the number of hours of labor and let y denote the total cost to fix the
car. Obtain the equation that expresses y in terms of x. Construct a table of values using the
x-values 2, 3, and 5 hours. Draw the graph of the equation by plotting the points from the
table and connecting them with a straight line. Use the graph to estimate visually the total
cost of fixing the car if the number of hours of labor is 3.5.
فتح الحزمة
افتح القفل للوصول البطاقات البالغ عددها 55 في هذه المجموعة.
فتح الحزمة
k this deck
6
Solve the problem.
Anne is running a 400-meter race. She runs at a constant speed of 7.5 meters per second. If
you let y denote her distance in meters from the finish line x seconds after the start of the
race, y = 400 - 7.5x. Determine b0 and b1 for this linear equation. Find Anne's distance
from the finish line 10, 24, and 43 seconds after the race begins. Use these three points to
graph the linear equation y = 400 - 7.5x. Use the graph to estimate visually Anne's distance
from the finish line 32 seconds after the start of the race.
فتح الحزمة
افتح القفل للوصول البطاقات البالغ عددها 55 في هذه المجموعة.
فتح الحزمة
k this deck
7
Provide an appropriate response.
Suppose data are collected for each of several randomly selected adults for height, in
inches, and number of calories burned in 30 minutes of walking on a treadmill at 3.5 mph.
How would the value of the linear correlation coefficient, r, change if all of the heights
were converted to meters?
Suppose data are collected for each of several randomly selected adults for height, in
inches, and number of calories burned in 30 minutes of walking on a treadmill at 3.5 mph.
How would the value of the linear correlation coefficient, r, change if all of the heights
were converted to meters?
فتح الحزمة
افتح القفل للوصول البطاقات البالغ عددها 55 في هذه المجموعة.
فتح الحزمة
k this deck
8
Provide an appropriate response.
What is the relationship between the linear correlation coefficient and the usefulness of the
regression equation for making predictions?
What is the relationship between the linear correlation coefficient and the usefulness of the
regression equation for making predictions?
فتح الحزمة
افتح القفل للوصول البطاقات البالغ عددها 55 في هذه المجموعة.
فتح الحزمة
k this deck
9
Provide an appropriate response.
For each of 200 randomly selected cities, Pete compared data for the number of churches in
the city (x)and the number of homicides in the past decade (y). He calculated the linear
correlation coefficient and was surprised to find a strong positive linear correlation for the
two variables. Does this suggest that when a city builds new churches this will tend to
cause an increase in the number of homicides? Why do you think that a strong positive
linear correlation coefficient was obtained?
فتح الحزمة
افتح القفل للوصول البطاقات البالغ عددها 55 في هذه المجموعة.
فتح الحزمة
k this deck
10
Provide an appropriate response.
Create a scatterplot that shows a perfect positive linear correlation between x and y. How
would the scatterplot change if the correlation showed each of the following?
(a)a strong positive linear correlation;
(b)a weak positive linear correlation;
(c)no linear correlation.
Create a scatterplot that shows a perfect positive linear correlation between x and y. How
would the scatterplot change if the correlation showed each of the following?
(a)a strong positive linear correlation;
(b)a weak positive linear correlation;
(c)no linear correlation.
فتح الحزمة
افتح القفل للوصول البطاقات البالغ عددها 55 في هذه المجموعة.
فتح الحزمة
k this deck
11
Provide an appropriate response.
Explain why having a high linear correlation does not imply causality. Give an example to
support your answer.
Explain why having a high linear correlation does not imply causality. Give an example to
support your answer.
فتح الحزمة
افتح القفل للوصول البطاقات البالغ عددها 55 في هذه المجموعة.
فتح الحزمة
k this deck
12
Provide an appropriate response.
Give an example of a linear equation whose graph is a horizontal line.
Give an example of a linear equation whose graph is a horizontal line.
فتح الحزمة
افتح القفل للوصول البطاقات البالغ عددها 55 في هذه المجموعة.
فتح الحزمة
k this deck
13
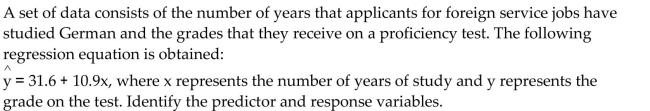
Provide an appropriate response.
Define the terms "predictor variable" and "response variable." Give an example of each.
Define the terms "predictor variable" and "response variable." Give an example of each.
فتح الحزمة
افتح القفل للوصول البطاقات البالغ عددها 55 في هذه المجموعة.
فتح الحزمة
k this deck
14
Provide an appropriate response.
The variables height and weight could reasonably be expected to have a positive linear
correlation coefficient, since taller people tend to be heavier, on average, than shorter
people. Give an example of a pair of variables which you would expect to have a negative
linear correlation coefficient and explain why. Then give an example of a pair of variables
whose linear correlation coefficient is likely to be close to zero.
فتح الحزمة
افتح القفل للوصول البطاقات البالغ عددها 55 في هذه المجموعة.
فتح الحزمة
k this deck
15
Provide an appropriate response.
Determine which scatterplot shows the strongest linear correlation.
Determine which scatterplot shows the strongest linear correlation.
فتح الحزمة
افتح القفل للوصول البطاقات البالغ عددها 55 في هذه المجموعة.
فتح الحزمة
k this deck
16
Solve the problem.
For a day's work, Chris is paid $50 to cover expenses plus $16 per hour. Let x denote the
number of hours Chris works in a day and let y denote Chris's total salary for the day.
Obtain the equation that expresses y in terms of x. Construct a table of values using the
x-values 2, 4, and 8 hours. Draw the graph of the equation by plotting the points from the
table and connecting them with a straight line. Use the graph to estimate visually Chris's
salary for the day if he works 6 hours.
فتح الحزمة
افتح القفل للوصول البطاقات البالغ عددها 55 في هذه المجموعة.
فتح الحزمة
k this deck
17
Provide an appropriate response.
فتح الحزمة
افتح القفل للوصول البطاقات البالغ عددها 55 في هذه المجموعة.
فتح الحزمة
k this deck
18
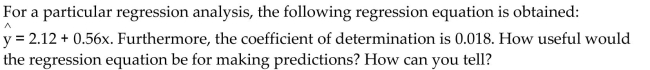
Provide an appropriate response.
For a particular regression analysis, it is found that SST = 901 and SSE = 804.1. Does the
regression equation appear to be useful for making predictions? How can you tell?
For a particular regression analysis, it is found that SST = 901 and SSE = 804.1. Does the
regression equation appear to be useful for making predictions? How can you tell?
فتح الحزمة
افتح القفل للوصول البطاقات البالغ عددها 55 في هذه المجموعة.
فتح الحزمة
k this deck
19
Provide an appropriate response.
For a certain linear equation, as x increases from 3 to 4, the y-value increases from 17 to 22.
The y-value corresponding to an x-value of 9 is 47. What is the y-value corresponding to
an x-value of 10? Explain how you solved this problem.
For a certain linear equation, as x increases from 3 to 4, the y-value increases from 17 to 22.
The y-value corresponding to an x-value of 9 is 47. What is the y-value corresponding to
an x-value of 10? Explain how you solved this problem.
فتح الحزمة
افتح القفل للوصول البطاقات البالغ عددها 55 في هذه المجموعة.
فتح الحزمة
k this deck
20
Provide an appropriate response.
Describe what scatterplots are, and discuss their importance.
Describe what scatterplots are, and discuss their importance.
فتح الحزمة
افتح القفل للوصول البطاقات البالغ عددها 55 في هذه المجموعة.
فتح الحزمة
k this deck
21
فتح الحزمة
افتح القفل للوصول البطاقات البالغ عددها 55 في هذه المجموعة.
فتح الحزمة
k this deck
22
Obtain the linear correlation coefficient for the data. Round your answer to three decimal places.
فتح الحزمة
افتح القفل للوصول البطاقات البالغ عددها 55 في هذه المجموعة.
فتح الحزمة
k this deck
23
You are given information about a straight line. Use two points to graph the equation.
فتح الحزمة
افتح القفل للوصول البطاقات البالغ عددها 55 في هذه المجموعة.
فتح الحزمة
k this deck
24
Provide an appropriate response.
فتح الحزمة
افتح القفل للوصول البطاقات البالغ عددها 55 في هذه المجموعة.
فتح الحزمة
k this deck
25
The y-intercept and slope, respectively, of a straight line are given. Find the equation of the line.
-9 and 4
-9 and 4
فتح الحزمة
افتح القفل للوصول البطاقات البالغ عددها 55 في هذه المجموعة.
فتح الحزمة
k this deck
26
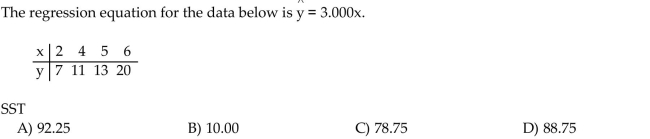
Compute the specified sum of squares.
فتح الحزمة
افتح القفل للوصول البطاقات البالغ عددها 55 في هذه المجموعة.
فتح الحزمة
k this deck
27
Compute the coefficient of determination. Round your answer to four decimal places.
For a particular regression analysis, it is found that SST = 913.5 and SSE = 277.9.
A)0.3042
B)0.8341
C)3.2872
D)0.6958
For a particular regression analysis, it is found that SST = 913.5 and SSE = 277.9.
A)0.3042
B)0.8341
C)3.2872
D)0.6958
فتح الحزمة
افتح القفل للوصول البطاقات البالغ عددها 55 في هذه المجموعة.
فتح الحزمة
k this deck
28
Provide an appropriate response.
True or false? In the context of regression analysis, if the regression sum of squares is large relative
to the error sum of squares, then the regression equation is useful for making predictions.
True or false? In the context of regression analysis, if the regression sum of squares is large relative
to the error sum of squares, then the regression equation is useful for making predictions.
فتح الحزمة
افتح القفل للوصول البطاقات البالغ عددها 55 في هذه المجموعة.
فتح الحزمة
k this deck
29
Provide an appropriate response.
When performing regression analysis, how can you evaluate how useful the regression
equation is for making predictions?
When performing regression analysis, how can you evaluate how useful the regression
equation is for making predictions?
فتح الحزمة
افتح القفل للوصول البطاقات البالغ عددها 55 في هذه المجموعة.
فتح الحزمة
k this deck
30
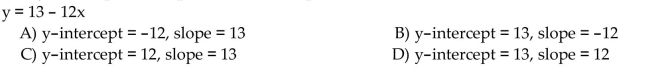
Determine the y-intercept and slope of the linear equation.
فتح الحزمة
افتح القفل للوصول البطاقات البالغ عددها 55 في هذه المجموعة.
فتح الحزمة
k this deck
31
Provide an appropriate response.
فتح الحزمة
افتح القفل للوصول البطاقات البالغ عددها 55 في هذه المجموعة.
فتح الحزمة
k this deck
32
Provide an appropriate response.
فتح الحزمة
افتح القفل للوصول البطاقات البالغ عددها 55 في هذه المجموعة.
فتح الحزمة
k this deck
33
The y-intercept and slope, respectively, of a straight line are given. Find the equation of the line.
فتح الحزمة
افتح القفل للوصول البطاقات البالغ عددها 55 في هذه المجموعة.
فتح الحزمة
k this deck
34
The regression equation for the given data points is provided. Graph the regression equation and the data points.^y
فتح الحزمة
افتح القفل للوصول البطاقات البالغ عددها 55 في هذه المجموعة.
فتح الحزمة
k this deck
35
Obtain the linear correlation coefficient for the data. Round your answer to three decimal places.
فتح الحزمة
افتح القفل للوصول البطاقات البالغ عددها 55 في هذه المجموعة.
فتح الحزمة
k this deck
36
You are given information about a straight line. Determine whether the line slopes upward, slopes downward, or ishorizontal.
The y-intercept is 0 and the slope is -5.2.
A)Is horizontal
B)Slopes upward
C)Slopes downward
The y-intercept is 0 and the slope is -5.2.
A)Is horizontal
B)Slopes upward
C)Slopes downward
فتح الحزمة
افتح القفل للوصول البطاقات البالغ عددها 55 في هذه المجموعة.
فتح الحزمة
k this deck
37
Provide an appropriate response.
فتح الحزمة
افتح القفل للوصول البطاقات البالغ عددها 55 في هذه المجموعة.
فتح الحزمة
k this deck
38
Provide an appropriate response.
فتح الحزمة
افتح القفل للوصول البطاقات البالغ عددها 55 في هذه المجموعة.
فتح الحزمة
k this deck
39
Provide an appropriate response.
True or false? In the context of regression analysis, the regression sum of squares is the variation in
the observed values of the response variable explained by the regression.
True or false? In the context of regression analysis, the regression sum of squares is the variation in
the observed values of the response variable explained by the regression.
فتح الحزمة
افتح القفل للوصول البطاقات البالغ عددها 55 في هذه المجموعة.
فتح الحزمة
k this deck
40
Is the data point, P, an outlier, a potential influential observation, both, or neither?
فتح الحزمة
افتح القفل للوصول البطاقات البالغ عددها 55 في هذه المجموعة.
فتح الحزمة
k this deck
41
Determine the percentage of variation in the observed values of the response variable that is explained by the regression.Round to the nearest tenth of a percent if needed.
فتح الحزمة
افتح القفل للوصول البطاقات البالغ عددها 55 في هذه المجموعة.
فتح الحزمة
k this deck
42
The y-intercept and slope, respectively, of a straight line are given. Find the equation of the line.
فتح الحزمة
افتح القفل للوصول البطاقات البالغ عددها 55 في هذه المجموعة.
فتح الحزمة
k this deck
43
Compute the coefficient of determination. Round your answer to four decimal places.
فتح الحزمة
افتح القفل للوصول البطاقات البالغ عددها 55 في هذه المجموعة.
فتح الحزمة
k this deck
44
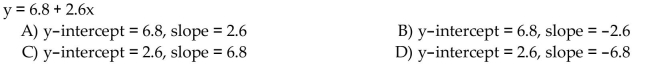
Determine the y-intercept and slope of the linear equation.
y = 1
A)y-intercept = -1, slope = 0
B)y-intercept = 1, slope = 0
C)y-intercept = 0, slope = 1
D)y-intercept = 1, slope = 1
y = 1
A)y-intercept = -1, slope = 0
B)y-intercept = 1, slope = 0
C)y-intercept = 0, slope = 1
D)y-intercept = 1, slope = 1
فتح الحزمة
افتح القفل للوصول البطاقات البالغ عددها 55 في هذه المجموعة.
فتح الحزمة
k this deck
45
Solve the problem.
فتح الحزمة
افتح القفل للوصول البطاقات البالغ عددها 55 في هذه المجموعة.
فتح الحزمة
k this deck
46
Provide an appropriate response.
فتح الحزمة
افتح القفل للوصول البطاقات البالغ عددها 55 في هذه المجموعة.
فتح الحزمة
k this deck
47
Obtain the linear correlation coefficient for the data. Round your answer to three decimal places.
Managers rate employees according to job performance (x)and attitude (y). The results for several randomly selected employees are given below.
Managers rate employees according to job performance (x)and attitude (y). The results for several randomly selected employees are given below.
فتح الحزمة
افتح القفل للوصول البطاقات البالغ عددها 55 في هذه المجموعة.
فتح الحزمة
k this deck
48
You are given information about a straight line. Determine whether the line slopes upward, slopes downward, or ishorizontal.
فتح الحزمة
افتح القفل للوصول البطاقات البالغ عددها 55 في هذه المجموعة.
فتح الحزمة
k this deck
49
Provide an appropriate response.
The table below shows the age and annual income of 12 randomly selected college graduates all living in the city of Seattle. Would it be reasonable to use the regression equation to predict the annual income of a college
Graduate in Seattle who is 90 years old? Explain your answer.
A)No; 90 year olds are outside the age range of the data.
B)No; the regression line does not fit the data very closely.
C)No; regression equations can not be used to predict values for which there is no input data.
D)Yes; the regression line fits the data quite closely.
The table below shows the age and annual income of 12 randomly selected college graduates all living in the city of Seattle.
Would it be reasonable to use the regression equation to predict the annual income of a collegeGraduate in Seattle who is 90 years old? Explain your answer.
A)No; 90 year olds are outside the age range of the data.
B)No; the regression line does not fit the data very closely.
C)No; regression equations can not be used to predict values for which there is no input data.
D)Yes; the regression line fits the data quite closely.
فتح الحزمة
افتح القفل للوصول البطاقات البالغ عددها 55 في هذه المجموعة.
فتح الحزمة
k this deck
50
You are given information about a straight line. Use two points to graph the equation.
The equation of the line is y = 1 - 0.75x.
The equation of the line is y = 1 - 0.75x.
فتح الحزمة
افتح القفل للوصول البطاقات البالغ عددها 55 في هذه المجموعة.
فتح الحزمة
k this deck
51
You are given information about a straight line. Determine whether the line slopes upward, slopes downward, or ishorizontal.
The equation of the line is y = -5.6 - 6x.
A)Slopes downward
B)Is horizontal
C)Slopes upward
The equation of the line is y = -5.6 - 6x.
A)Slopes downward
B)Is horizontal
C)Slopes upward
فتح الحزمة
افتح القفل للوصول البطاقات البالغ عددها 55 في هذه المجموعة.
فتح الحزمة
k this deck
52
Obtain the linear correlation coefficient for the data. Round your answer to three decimal places.
The data below show the cost of advertising (x), in thousands of dollars, and the number of products sold (y), in thousands, for each of eight randomly selected product lines.
The data below show the cost of advertising (x), in thousands of dollars, and the number of products sold (y), in thousands, for each of eight randomly selected product lines.
فتح الحزمة
افتح القفل للوصول البطاقات البالغ عددها 55 في هذه المجموعة.
فتح الحزمة
k this deck
53
Determine the regression equation for the data. Round the final values to three significant digits, if necessary.
فتح الحزمة
افتح القفل للوصول البطاقات البالغ عددها 55 في هذه المجموعة.
فتح الحزمة
k this deck
54
Obtain the linear correlation coefficient for the data. Round your answer to three decimal places.
Two separate tests, x and y, are designed to measure a student's ability to solve problems. Several students are randomly selected to take both tests and their results are shown below.
Two separate tests, x and y, are designed to measure a student's ability to solve problems. Several students are randomly selected to take both tests and their results are shown below.
فتح الحزمة
افتح القفل للوصول البطاقات البالغ عددها 55 في هذه المجموعة.
فتح الحزمة
k this deck
55
Provide an appropriate response.
True or false? In the context of regression analysis, the coefficient of determination is the proportion
of variation in the observed values of the response variable not explained by the regression
True or false? In the context of regression analysis, the coefficient of determination is the proportion
of variation in the observed values of the response variable not explained by the regression
فتح الحزمة
افتح القفل للوصول البطاقات البالغ عددها 55 في هذه المجموعة.
فتح الحزمة
k this deck
فتح الحزمة
افتح القفل للوصول البطاقات البالغ عددها 55 في هذه المجموعة.


