Deck 5: Statistical Reasoning
ملء الشاشة (f)
سؤال
سؤال
سؤال
سؤال
سؤال
The graph below shows the approximate annual percentage growth rate in world population for the years 1960 through
2010. Data is estimated by the UN Census Bureau.
Annual Growth Rate (Percentage)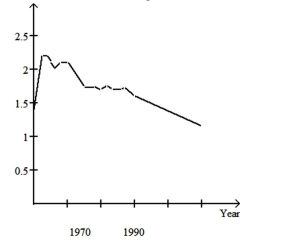 Use the graph to answer the question.
In which year during the period 1960-2010 is estimated world population the greatest?
A)1963
B)1970
C)2010
D)1960
2010. Data is estimated by the UN Census Bureau.
Annual Growth Rate (Percentage)
Use the graph to answer the question.In which year during the period 1960-2010 is estimated world population the greatest?
A)1963
B)1970
C)2010
D)1960
سؤال
The graph below shows the approximate annual percentage growth rate in world population for the years 1960 through
2010. Data is estimated by the UN Census Bureau.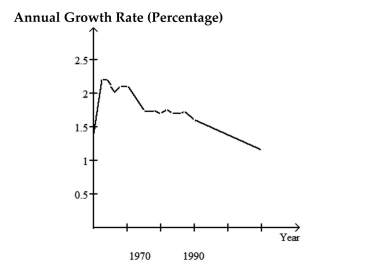 Use the graph to answer the question.
Describe the trend in world population during the period 1990-2000
A)It decreases at a steady rate
B)It increases at a slower and slower rate
C)It decreases at a faster and faster rate
D)It increases at a steady rate
2010. Data is estimated by the UN Census Bureau.
Use the graph to answer the question.Describe the trend in world population during the period 1990-2000
A)It decreases at a steady rate
B)It increases at a slower and slower rate
C)It decreases at a faster and faster rate
D)It increases at a steady rate
سؤال
سؤال
سؤال
سؤال
سؤال
سؤال
سؤال
سؤال
سؤال
سؤال
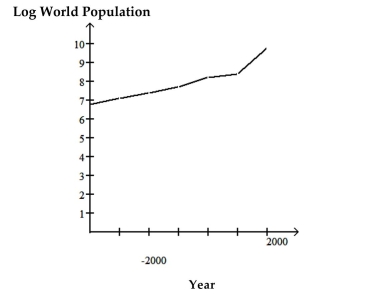
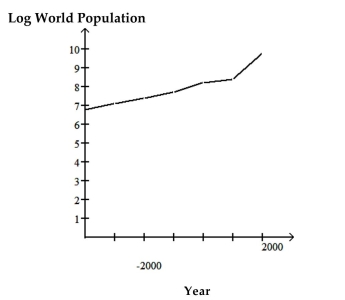
The graph below shows estimated world population for the period 4000 BC  2000 AD. Note that the logarithm of the
world population and not actual population is plotted on the vertical axis. This means, for example, that when the graph
reaches 7 on the vertical scale, world population is and when the graph reaches 9 on the vertical scale, world
population is .
.  Use the graph to answer the question.
During the period 4000 BC to 1000 BC, approximately what was the doubling time for world population?
A)Approximately 23,000 years
B)Approximately 1000 years
C)Approximately 3000 years
D)Approximately 5000 years
2000 AD. Note that the logarithm of theworld population and not actual population is plotted on the vertical axis. This means, for example, that when the graph
reaches 7 on the vertical scale, world population is
and when the graph reaches 9 on the vertical scale, worldpopulation is
. Use the graph to answer the question.During the period 4000 BC to 1000 BC, approximately what was the doubling time for world population?
A)Approximately 23,000 years
B)Approximately 1000 years
C)Approximately 3000 years
D)Approximately 5000 years
سؤال
سؤال
سؤال
سؤال
The graph below shows the approximate annual percentage growth rate in world population for the years 1960 through
2010. Data is estimated by the UN Census Bureau.
Annual Growth Rate (Percentage)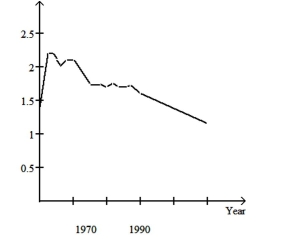 Use the graph to answer the question.
Describe the trend in world population during the period 1976-1978
A)It increases at a faster and faster rate
B)It decreases at a steady rate
C)It remains constant
D)It increases at a steady rate
2010. Data is estimated by the UN Census Bureau.
Annual Growth Rate (Percentage)
Use the graph to answer the question.Describe the trend in world population during the period 1976-1978
A)It increases at a faster and faster rate
B)It decreases at a steady rate
C)It remains constant
D)It increases at a steady rate
سؤال
سؤال
سؤال
سؤال
سؤال
The graph below shows the approximate annual percentage growth rate in world population for the years 1960 through
2010. Data is estimated by the UN Census Bureau.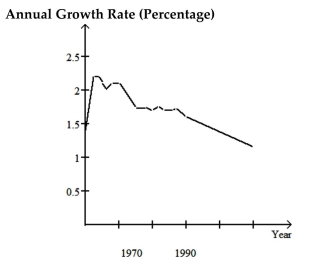 Use the graph to answer the question.
In which year(s), if any, during the period 1960-2010 is world population constant?
A)None
B)1962-1964
C)1962-1964, 1969-1971, 1975-1980
D)1969-1971
2010. Data is estimated by the UN Census Bureau.
Use the graph to answer the question.In which year(s), if any, during the period 1960-2010 is world population constant?
A)None
B)1962-1964
C)1962-1964, 1969-1971, 1975-1980
D)1969-1971
سؤال
سؤال
The graph below shows the approximate annual percentage growth rate in world population for the years 1960 through
2010. Data is estimated by the UN Census Bureau.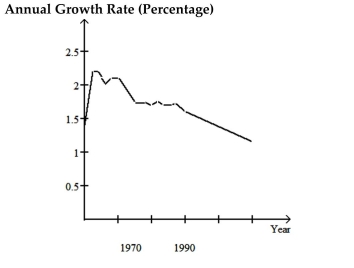 Use the graph to answer the question.
Describe the trend in world population during the period 1960-1962
A)It increases at a constant rate
B)It decreases at a steady rate
C)It increases at a faster and faster rate
D)It remains constant
2010. Data is estimated by the UN Census Bureau.
Use the graph to answer the question.Describe the trend in world population during the period 1960-1962
A)It increases at a constant rate
B)It decreases at a steady rate
C)It increases at a faster and faster rate
D)It remains constant
سؤال
سؤال
سؤال
سؤال
The graph below shows the approximate annual percentage growth rate in world population for the years 1960 through
2010. Data is estimated by the UN Census Bureau.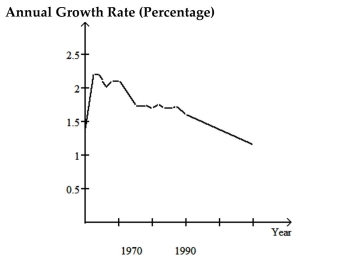 Use the graph to answer the question.
In which year(s)during the period 1960-2010 is world population growing at the fastest rate?
A)1970
B)1984
C)1963-1964
D)2010
2010. Data is estimated by the UN Census Bureau.
Use the graph to answer the question.In which year(s)during the period 1960-2010 is world population growing at the fastest rate?
A)1970
B)1984
C)1963-1964
D)2010
سؤال
سؤال
سؤال
سؤال
The graph below shows estimated world population for the period 4000 BC 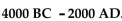 2000 AD. Note that the logarithm of the
world population and not actual population is plotted on the vertical axis. This means, for example, that when the graph
reaches 7 on the vertical scale, world population is and when the graph reaches 9 on the vertical scale, world
population is .
.  Use the graph to answer the question.
How does world population in the year 1000 AD compare with world population in the year 2000 BC?
A)The 1000 AD population is roughly one million larger than the 2000 BC population.
B)The 1000 AD population is roughly 14% larger than the 2000 BC population.
C)The 1000 AD population is roughly ten million larger than the 2000 BC population.
D)The 1000 AD population is roughly ten times as large as the 2000 BC population.
2000 AD. Note that the logarithm of theworld population and not actual population is plotted on the vertical axis. This means, for example, that when the graph
reaches 7 on the vertical scale, world population is
and when the graph reaches 9 on the vertical scale, worldpopulation is
. Use the graph to answer the question.How does world population in the year 1000 AD compare with world population in the year 2000 BC?
A)The 1000 AD population is roughly one million larger than the 2000 BC population.
B)The 1000 AD population is roughly 14% larger than the 2000 BC population.
C)The 1000 AD population is roughly ten million larger than the 2000 BC population.
D)The 1000 AD population is roughly ten times as large as the 2000 BC population.
سؤال
سؤال
سؤال
سؤال
سؤال
سؤال
سؤال
سؤال
سؤال
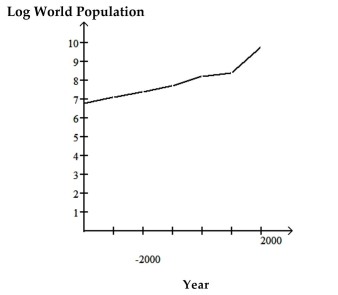
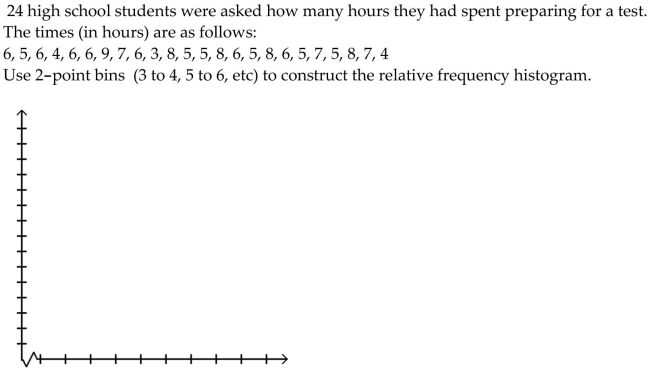
Use the indicated bin size to construct a frequency table for the set of data. Include columns for relative frequency andcumulative frequency.
On a math test, the scores of 24 students were as follows: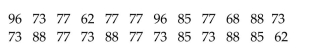

On a math test, the scores of 24 students were as follows:
سؤال
سؤال
سؤال
سؤال
سؤال
سؤال
The graph below shows the approximate annual percentage growth rate in world population for the years 1960 through
2010. Data is estimated by the UN Census Bureau. Use the graph to answer the question.
How does world population in 1978 compare to world population in 1977?
A)It is 1.75 million greater
B)It is 1.75% less
C)It is 1.75% greater
D)It is the same
2010. Data is estimated by the UN Census Bureau.
Use the graph to answer the question.How does world population in 1978 compare to world population in 1977?
A)It is 1.75 million greater
B)It is 1.75% less
C)It is 1.75% greater
D)It is the same
سؤال
سؤال
سؤال
سؤال
سؤال
سؤال
The graph below shows estimated world population for the period 4000 BC 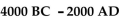 2000 AD. Note that the logarithm of the
world population and not actual population is plotted on the vertical axis. This means, for example, that when the graph
reaches 7 on the vertical scale, world population is and when the graph reaches 9 on the vertical scale, world
population is
 Use the graph to answer the question.
How does world population in the year 2000 AD compare with world population in the year 4000 BC?
A)The 2000 AD population is roughly three billion larger than the 4000 BC population.
B)The 2000 AD population is roughly thirty times as large as the 4000 BC population.
C)The 2000 AD population is roughly 44% larger than the 4000 BC population.
D)The 2000 AD population is roughly one thousand times as large as the 4000 BC population.
2000 AD. Note that the logarithm of theworld population and not actual population is plotted on the vertical axis. This means, for example, that when the graph
reaches 7 on the vertical scale, world population is
and when the graph reaches 9 on the vertical scale, worldpopulation is
Use the graph to answer the question.How does world population in the year 2000 AD compare with world population in the year 4000 BC?
A)The 2000 AD population is roughly three billion larger than the 4000 BC population.
B)The 2000 AD population is roughly thirty times as large as the 4000 BC population.
C)The 2000 AD population is roughly 44% larger than the 4000 BC population.
D)The 2000 AD population is roughly one thousand times as large as the 4000 BC population.
سؤال
The graph below shows estimated world population for the period 4000 BC  2000 AD. Note that the logarithm of the
world population and not actual population is plotted on the vertical axis. This means, for example, that when the graph
reaches 7 on the vertical scale, world population is and when the graph reaches 9 on the vertical scale, world
population is .
.
Log World Population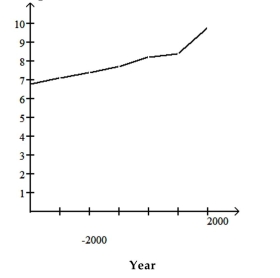 Use the graph to answer the question.
Describe the general trend in world population during the period 2000 BC to the year 1 AD.
A)World population increases at a slower and slower rate.
B)World population increases at a constant rate.
C)World population is constant.
D)World population increases at a faster and faster rate.
2000 AD. Note that the logarithm of theworld population and not actual population is plotted on the vertical axis. This means, for example, that when the graph
reaches 7 on the vertical scale, world population is
and when the graph reaches 9 on the vertical scale, worldpopulation is
.Log World Population
Use the graph to answer the question.Describe the general trend in world population during the period 2000 BC to the year 1 AD.
A)World population increases at a slower and slower rate.
B)World population increases at a constant rate.
C)World population is constant.
D)World population increases at a faster and faster rate.
سؤال
سؤال
سؤال
سؤال
Use the graph to answer the question.
The bar graph below shows the relative frequencies of the different blood types. Write a
sentence describing what is revealed by the graph.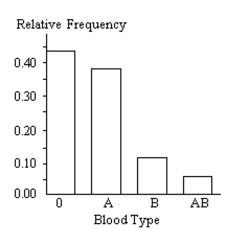
The bar graph below shows the relative frequencies of the different blood types. Write a
sentence describing what is revealed by the graph.
سؤال
سؤال
Answer the question.
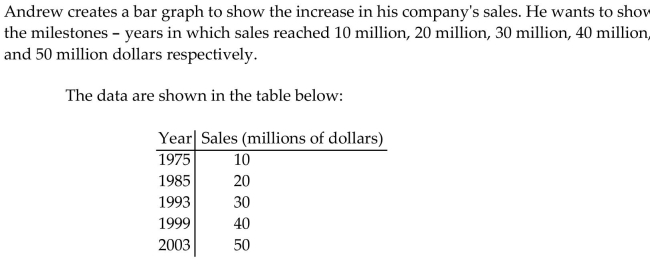 In the graph, Andrew draws 5 equally spaced bars of heights 1 in, 2 in, 3 in, 4 in, and 5 in
respectively. The height of each bar corresponds to the amount of sales. He labels each bar
with the corresponding year (1975, 1985, 1993, 1999, 2003 respectively). Why is the graph
misleading?
In the graph, Andrew draws 5 equally spaced bars of heights 1 in, 2 in, 3 in, 4 in, and 5 inrespectively. The height of each bar corresponds to the amount of sales. He labels each bar
with the corresponding year (1975, 1985, 1993, 1999, 2003 respectively). Why is the graph
misleading?
سؤال
Answer the question.
The bar graph below shows the number of car accidents occurring in one city in each of the
years 1993 through 1998. The number of accidents dropped in 1995 after a new speed limit
was imposed. Why is the graph misleading? How would you redesign the graph so that it
is less misleading? What impression is conveyed by the graph?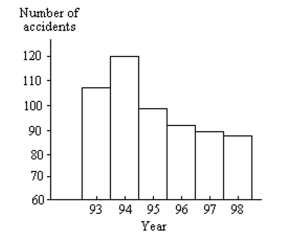
سؤال
Construct th  e specified histogram.
30 police detectives were asked how many days they had taken off in the previous year.
The results are summarized in the frequency table below .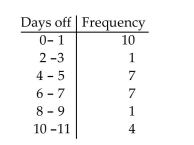 Construct a histogram.
e specified histogram.30 police detectives were asked how many days they had taken off in the previous year.
The results are summarized in the frequency table below .
Construct a histogram. سؤال
Answer the question.
The bar graph below shows the average cost of renting a studio in a certain city in each of
the years 1994 through 1998.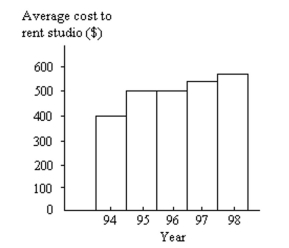 By what percentage does the average rental price increase from 1994 to 1995? Obtain a
truncated version of the graph by sliding a piece of paper over the bottom portion of the
graph so that the scale on the vertical axis starts at 300. In the truncated graph, by what
percentage does the price appear to increase from 1994 to 1995? Why is the truncated
graph misleading?
The bar graph below shows the average cost of renting a studio in a certain city in each of
the years 1994 through 1998.
By what percentage does the average rental price increase from 1994 to 1995? Obtain atruncated version of the graph by sliding a piece of paper over the bottom portion of the
graph so that the scale on the vertical axis starts at 300. In the truncated graph, by what
percentage does the price appear to increase from 1994 to 1995? Why is the truncated
graph misleading?
سؤال
سؤال
Make a bar graph to represent the data.
The following table shows the number of male infants born at Hospital X on New Year's
Day (Jan. 1). Create a horizontal bar graph.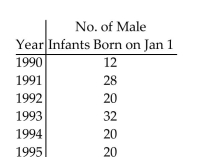
The following table shows the number of male infants born at Hospital X on New Year's
Day (Jan. 1). Create a horizontal bar graph.
سؤال
سؤال
سؤال
Create a graphical display for the data given. You may choose any graphic type that you feel is appropriate. Write a fewsentences explaining why you chose this type of display and a few sentences describing any interesting patterns in thedata.
The table below shows the number of AIDS diagnoses for the United Kingdom by year.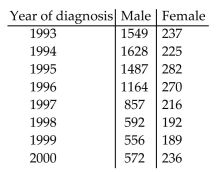
The table below shows the number of AIDS diagnoses for the United Kingdom by year.
سؤال
Make a bar graph to represent the data.
The table lists the winners of the Wimbledon women's singles title for the years 1976-1995.
Construct a vertical bar graph for the given relative frequencies.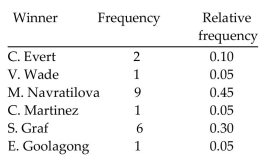
The table lists the winners of the Wimbledon women's singles title for the years 1976-1995.
Construct a vertical bar graph for the given relative frequencies.
سؤال
Answer the question.
A parcel delivery service lowered its prices and finds that it has delivered twice as many
parcels this year as it did last year. To illustrate this fact, the manager draws a pictogram as
shown below. Each cube depicts a parcel. The side length of the "parcel" on the right is
twice the side length of the "parcel" on the left. Why is this pictogram misleading? What visual impression is portrayed by the pictogram?
A parcel delivery service lowered its prices and finds that it has delivered twice as many
parcels this year as it did last year. To illustrate this fact, the manager draws a pictogram as
shown below. Each cube depicts a parcel. The side length of the "parcel" on the right is
twice the side length of the "parcel" on the left.
Why is this pictogram misleading? What visual impression is portrayed by the pictogram? سؤال
Construct the specified histogram.
سؤال
سؤال
سؤال
سؤال
 Describe how you would apply the five basic steps of a statistical study to the given issue.
You want to know the average amount paid in rent by tenants of the city of Hazelwood.
سؤال
سؤال
 Use the guidelines to evaluate the study. Discuss flaws that you see in the study.
A researcher randomly selects 300 adults from the city of Kentwood by using a random
number generator and a list of residents of the town. She calls the people in the sample and
asks the following question: "Do you agree that more of the city's budget should be spent
on social services for the poor? " She announces that 54% of the people in Kentwood feel
that more of the city's budget should be spent on social services for the poor.

فتح الحزمة
قم بالتسجيل لفتح البطاقات في هذه المجموعة!
Unlock Deck
Unlock Deck
1/230
العب
ملء الشاشة (f)
Deck 5: Statistical Reasoning
1
Answer the question.
A researcher wishes to determine the percentage of voters in a town who favor stronger environmental laws. Which of the following would be the most representative sample?
A)A sample consisting of every 10th person leaving an organic food store
B)A sample selected randomly from the phone book
C)A random sample of college students
D)A sample of listeners who call in to a radio talk show
B
2
Choose the best wording for the question in the study.
A researcher wants to determine the level of support for the war. Which of the following questions would produce the most accurate results?
A)Do you agree that the troops should be brought home to safety now?
B)How do you feel about the war?
C)Do you support the troops?
D)Do you agree that it is important to defend our country against terrorism?
B
3
Answer the question.
In a study to determine the most popular automobile on the road, which of the following is the most representative sample?
A)A random sample of the cars parked at a local high school
B)A random sample of the cars that drive by your house
C)A random sample of the cars parked at an airport
D)A random sample of the cars driving on the highway
D
4
In order to answer the given question, which of the following types of study would be the most appropriate: an
experiment without blinding, an experiment with single blinding, an experiment with double blinding, an observational
study, or a case-control study?
How do lawyers' salaries compare to doctors' salaries?
A)Experiment without blinding
B)Experiment with double blinding
C)Observational study
D)Experiment with single blinding
E)Case-control study
فتح الحزمة
افتح القفل للوصول البطاقات البالغ عددها 230 في هذه المجموعة.
فتح الحزمة
k this deck
5
The graph below shows the approximate annual percentage growth rate in world population for the years 1960 through
2010. Data is estimated by the UN Census Bureau.
Annual Growth Rate (Percentage) Use the graph to answer the question.
In which year during the period 1960-2010 is estimated world population the greatest?
A)1963
B)1970
C)2010
D)1960
2010. Data is estimated by the UN Census Bureau.
Annual Growth Rate (Percentage)
Use the graph to answer the question.In which year during the period 1960-2010 is estimated world population the greatest?
A)1963
B)1970
C)2010
D)1960
فتح الحزمة
افتح القفل للوصول البطاقات البالغ عددها 230 في هذه المجموعة.
فتح الحزمة
k this deck
6
The graph below shows the approximate annual percentage growth rate in world population for the years 1960 through
2010. Data is estimated by the UN Census Bureau. Use the graph to answer the question.
Describe the trend in world population during the period 1990-2000
A)It decreases at a steady rate
B)It increases at a slower and slower rate
C)It decreases at a faster and faster rate
D)It increases at a steady rate
2010. Data is estimated by the UN Census Bureau.
Use the graph to answer the question.Describe the trend in world population during the period 1990-2000
A)It decreases at a steady rate
B)It increases at a slower and slower rate
C)It decreases at a faster and faster rate
D)It increases at a steady rate
فتح الحزمة
افتح القفل للوصول البطاقات البالغ عددها 230 في هذه المجموعة.
فتح الحزمة
k this deck
7
Answer as requested.
Which of the following is likely a coincidence?
A)Higher incidence of skin cancer in regions with more sunshine
B)More crime in neighborhoods with fewer streetlights
C)Higher annual rainfall in states with fewer homicides
D)Higher real estate prices in cities with more employment opportunities
Which of the following is likely a coincidence?
A)Higher incidence of skin cancer in regions with more sunshine
B)More crime in neighborhoods with fewer streetlights
C)Higher annual rainfall in states with fewer homicides
D)Higher real estate prices in cities with more employment opportunities
فتح الحزمة
افتح القفل للوصول البطاقات البالغ عددها 230 في هذه المجموعة.
فتح الحزمة
k this deck
8
Answer the question.
Double blinding is used in an experiment to avoid which of the following problems?
A)If improvement is observed in a patient, it is difficult to know whether this is due to the treatment or the placebo effect
B)If the researcher knows that the patient received the treatment, the researcher may also experience health changes
C)If the patient knows that he received the placebo and not the treatment he may be angry and fail to tell the truth
D)If an experimenter knows whether the patient has received the treatment or the placebo, this may influence how he or she questions the patient
فتح الحزمة
افتح القفل للوصول البطاقات البالغ عددها 230 في هذه المجموعة.
فتح الحزمة
k this deck
9
Answer the question.
Which of the following describes a study in which the participants naturally form groups by choice?
A)Double-blind experiment
B)Observational study
C)Single-blind experiment
D)Case-control study
Which of the following describes a study in which the participants naturally form groups by choice?
A)Double-blind experiment
B)Observational study
C)Single-blind experiment
D)Case-control study
فتح الحزمة
افتح القفل للوصول البطاقات البالغ عددها 230 في هذه المجموعة.
فتح الحزمة
k this deck
10
Answer as requested.
Which of the following is likely a cause-and-effect relationship?
A)When I drive to work, the sun rises.
B)When the rooster crows, the morning glories open.
C)When the temperature drops, consumption of heating oil rises.
D)When I see stars, I also see the moon.
Which of the following is likely a cause-and-effect relationship?
A)When I drive to work, the sun rises.
B)When the rooster crows, the morning glories open.
C)When the temperature drops, consumption of heating oil rises.
D)When I see stars, I also see the moon.
فتح الحزمة
افتح القفل للوصول البطاقات البالغ عددها 230 في هذه المجموعة.
فتح الحزمة
k this deck
11
Choose the best wording for the question in the study.
Proposition EZ proposes to raise the state sales tax by one quarter of a percent. The proceeds will be earmarked for music education in the public schools. If you want to determine whether or not it
Will pass, which of the following survey questions will give you the most accurate results?
A)Do you know which proposition will raise state sales tax and fund music education?
B)Are you planning to vote for Proposition EZ which will raise state sales taxes and support music education?
C)Will you vote for proposition EZ which will raise the amount of state sales tax that you pay every year?
D)Do you believe that music education is important?
فتح الحزمة
افتح القفل للوصول البطاقات البالغ عددها 230 في هذه المجموعة.
فتح الحزمة
k this deck
12
Answer as requested.
Suppose that there is perfect positive correlation between the number of hours studied for a test and score on the test. Which of the following statements must be true? More than one statement
May be true.
A: If we know the number of hours a given student studied, we will be able to perfectly predict
Their test score.
B: If Anne studied twice as long as Manuel, she will score twice as much.
C: If Lu Yi studied ten hours more than Andrea, Lu Yi will score ten points more than Andrea.
D: All data points lie perfectly on a horizontal line.
A)B and C
B)All statements are true
C)A
D)A and D
فتح الحزمة
افتح القفل للوصول البطاقات البالغ عددها 230 في هذه المجموعة.
فتح الحزمة
k this deck
13
In order to answer the given question, which of the following types of study would be the most appropriate: anexperiment without blinding, an experiment with single blinding, an experiment with double blinding, an observationalstudy, or a case-control study?
Are short women more likely to develop breast cancer than tall women?
A)Case-control study
B)Experiment with single blinding
C)Experiment without blinding
D)Experiment with double blinding
E)Observational study
Are short women more likely to develop breast cancer than tall women?
A)Case-control study
B)Experiment with single blinding
C)Experiment without blinding
D)Experiment with double blinding
E)Observational study
فتح الحزمة
افتح القفل للوصول البطاقات البالغ عددها 230 في هذه المجموعة.
فتح الحزمة
k this deck
14
In order to answer the given question, which of the following types of study would be the most appropriate: anexperiment without blinding, an experiment with single blinding, an experiment with double blinding, an observationalstudy, or a case-control study?
Does caffeine cause birth defects?
A)Experiment without blinding
B)Experiment with single blinding
C)Case-control study
D)Observational study
E)Experiment with double blinding
Does caffeine cause birth defects?
A)Experiment without blinding
B)Experiment with single blinding
C)Case-control study
D)Observational study
E)Experiment with double blinding
فتح الحزمة
افتح القفل للوصول البطاقات البالغ عددها 230 في هذه المجموعة.
فتح الحزمة
k this deck
15
Answer the question.
In a study to determine the average weight of a house cat, which of the following is the most representative sample?
A)All of the cats in your neighborhood
B)Some of the cats in each of several neighborhoods
C)All of the cats that a pet groomer sees in one week
D)All of the cats that a veterinarian sees in one week
فتح الحزمة
افتح القفل للوصول البطاقات البالغ عددها 230 في هذه المجموعة.
فتح الحزمة
k this deck
16
The graph below shows estimated world population for the period 4000 BC 2000 AD. Note that the logarithm of the
world population and not actual population is plotted on the vertical axis. This means, for example, that when the graph
reaches 7 on the vertical scale, world population is and when the graph reaches 9 on the vertical scale, world
population is . Use the graph to answer the question.
During the period 4000 BC to 1000 BC, approximately what was the doubling time for world population?
A)Approximately 23,000 years
B)Approximately 1000 years
C)Approximately 3000 years
D)Approximately 5000 years
2000 AD. Note that the logarithm of theworld population and not actual population is plotted on the vertical axis. This means, for example, that when the graph
reaches 7 on the vertical scale, world population is
and when the graph reaches 9 on the vertical scale, worldpopulation is
. Use the graph to answer the question.During the period 4000 BC to 1000 BC, approximately what was the doubling time for world population?
A)Approximately 23,000 years
B)Approximately 1000 years
C)Approximately 3000 years
D)Approximately 5000 years
فتح الحزمة
افتح القفل للوصول البطاقات البالغ عددها 230 في هذه المجموعة.
فتح الحزمة
k this deck
17
In order to answer the given question, which of the following types of study would be the most appropriate: an
experiment without blinding, an experiment with single blinding, an experiment with double blinding, an observational
study, or a case-control study?
Does an hour of meditation per day lower blood pressure?
A)Observational study
B)Experiment with double blinding
C)Experiment with single blinding
D)Experiment without blinding
E)Case-control study
فتح الحزمة
افتح القفل للوصول البطاقات البالغ عددها 230 في هذه المجموعة.
فتح الحزمة
k this deck
18
Choose the best wording for the question in the study.
If you wanted to determine if your customers are satisfied with the selection in your store, which of the following survey questions would give you the most accurate results?
A)Is our selection as good as the selection of our competitor?
B)Is there anything you would have purchased if our stock was not without it?
C)Do you agree that our selection is better than our competitor?
D)Are you satisfied with the selection at this store?
فتح الحزمة
افتح القفل للوصول البطاقات البالغ عددها 230 في هذه المجموعة.
فتح الحزمة
k this deck
19
Answer the question.
Which of the following describes a study in which neither the participants nor the experimenters know which participants are in the control group?
A)Case-control study
B)Observational study
C)Double-blind experiment
D)Single-blind experiment
Which of the following describes a study in which neither the participants nor the experimenters know which participants are in the control group?
A)Case-control study
B)Observational study
C)Double-blind experiment
D)Single-blind experiment
فتح الحزمة
افتح القفل للوصول البطاقات البالغ عددها 230 في هذه المجموعة.
فتح الحزمة
k this deck
20
The graph below shows the approximate annual percentage growth rate in world population for the years 1960 through
2010. Data is estimated by the UN Census Bureau.
Annual Growth Rate (Percentage) Use the graph to answer the question.
Describe the trend in world population during the period 1976-1978
A)It increases at a faster and faster rate
B)It decreases at a steady rate
C)It remains constant
D)It increases at a steady rate
2010. Data is estimated by the UN Census Bureau.
Annual Growth Rate (Percentage)
Use the graph to answer the question.Describe the trend in world population during the period 1976-1978
A)It increases at a faster and faster rate
B)It decreases at a steady rate
C)It remains constant
D)It increases at a steady rate
فتح الحزمة
افتح القفل للوصول البطاقات البالغ عددها 230 في هذه المجموعة.
فتح الحزمة
k this deck
21
In order to answer the given question, which of the following types of study would be the most appropriate: anexperiment without blinding, an experiment with single blinding, an experiment with double blinding, an observationalstudy, or a case-control study?
Does the new medication relieve depression?
A)Experiment with double blinding
B)Experiment without blinding
C)Case-control study
D)Observational study
E)Experiment with single blinding
Does the new medication relieve depression?
A)Experiment with double blinding
B)Experiment without blinding
C)Case-control study
D)Observational study
E)Experiment with single blinding
فتح الحزمة
افتح القفل للوصول البطاقات البالغ عددها 230 في هذه المجموعة.
فتح الحزمة
k this deck
22
Choose the best wording for the question in the study.
In a survey to assess attitudes toward genetically modified foods, which of the following survey questions will give the most accurate results?
A)Do you agree with increasing the production of genetically modified foods which could be harmful to the environment?
B)Do you agree with increasing the production of genetically modified foods to increase the world food supply?
C)How do you feel about allowing untested genetically modified foods to be sold in stores?
D)How do you feel about genetically modified foods?
فتح الحزمة
افتح القفل للوصول البطاقات البالغ عددها 230 في هذه المجموعة.
فتح الحزمة
k this deck
23
Answer the question.
Which of the following describes a study in which the patients do not know whether they are receiving the treatment or the placebo but the experimenters do know?
A)Case-control study
B)Observational study
C)Double-blind experiment
D)Single-blind experiment
Which of the following describes a study in which the patients do not know whether they are receiving the treatment or the placebo but the experimenters do know?
A)Case-control study
B)Observational study
C)Double-blind experiment
D)Single-blind experiment
فتح الحزمة
افتح القفل للوصول البطاقات البالغ عددها 230 في هذه المجموعة.
فتح الحزمة
k this deck
24
Choose the best wording for the question in the study.
A researcher wishes to determine the level of support for a new environmental law. Which of the following questions will produce the most accurate results?
A)How do you feel about the new environmental law?
B)How do you feel about this latest new environmental law?
C)Are you in favor of the new environmental law which will improve the quality of our air?
D)Are you in favor of the new environmental law which will cost taxpayers ten million dollars?
فتح الحزمة
افتح القفل للوصول البطاقات البالغ عددها 230 في هذه المجموعة.
فتح الحزمة
k this deck
25
The graph below shows the approximate annual percentage growth rate in world population for the years 1960 through
2010. Data is estimated by the UN Census Bureau. Use the graph to answer the question.
In which year(s), if any, during the period 1960-2010 is world population constant?
A)None
B)1962-1964
C)1962-1964, 1969-1971, 1975-1980
D)1969-1971
2010. Data is estimated by the UN Census Bureau.
Use the graph to answer the question.In which year(s), if any, during the period 1960-2010 is world population constant?
A)None
B)1962-1964
C)1962-1964, 1969-1971, 1975-1980
D)1969-1971
فتح الحزمة
افتح القفل للوصول البطاقات البالغ عددها 230 في هذه المجموعة.
فتح الحزمة
k this deck
26
Answer the question.
Which of the following quantities of interest would be the most difficult to define?
A)The paint with the best looking finish
B)The least expensive brand of paint
C)How water resistant a brand of paint is
D)The levels of lead in various brands of paint
Which of the following quantities of interest would be the most difficult to define?
A)The paint with the best looking finish
B)The least expensive brand of paint
C)How water resistant a brand of paint is
D)The levels of lead in various brands of paint
فتح الحزمة
افتح القفل للوصول البطاقات البالغ عددها 230 في هذه المجموعة.
فتح الحزمة
k this deck
27
The graph below shows the approximate annual percentage growth rate in world population for the years 1960 through
2010. Data is estimated by the UN Census Bureau. Use the graph to answer the question.
Describe the trend in world population during the period 1960-1962
A)It increases at a constant rate
B)It decreases at a steady rate
C)It increases at a faster and faster rate
D)It remains constant
2010. Data is estimated by the UN Census Bureau.
Use the graph to answer the question.Describe the trend in world population during the period 1960-1962
A)It increases at a constant rate
B)It decreases at a steady rate
C)It increases at a faster and faster rate
D)It remains constant
فتح الحزمة
افتح القفل للوصول البطاقات البالغ عددها 230 في هذه المجموعة.
فتح الحزمة
k this deck
28
Answer as requested.
Which of the following pairs of variables is likely to have no correlation?
A)The unemployment rate and the number of home foreclosures
B)The annual rainfall in Tempe, Arizona and the annual cost of tuition at Yale University
C)The amount of time studying math and grade on a math test
D)The amount of rainfall and the height of the grass
فتح الحزمة
افتح القفل للوصول البطاقات البالغ عددها 230 في هذه المجموعة.
فتح الحزمة
k this deck
29
Answer the question.
Which of the following describes the process by which scientists examine each others' research?
A)Peer review
B)Considering the conclusion
C)Interpretation
D)Participation review
Which of the following describes the process by which scientists examine each others' research?
A)Peer review
B)Considering the conclusion
C)Interpretation
D)Participation review
فتح الحزمة
افتح القفل للوصول البطاقات البالغ عددها 230 في هذه المجموعة.
فتح الحزمة
k this deck
30
In order to answer the given question, which of the following types of study would be the most appropriate: anexperiment without blinding, an experiment with single blinding, an experiment with double blinding, an observationalstudy, or a case-control study?
What percentage of the population reads a newspaper on a regular basis?
A)Experiment with single blinding
B)Case-control study
C)Experiment with double blinding
D)Observational study
E)Experiment without blinding
What percentage of the population reads a newspaper on a regular basis?
A)Experiment with single blinding
B)Case-control study
C)Experiment with double blinding
D)Observational study
E)Experiment without blinding
فتح الحزمة
افتح القفل للوصول البطاقات البالغ عددها 230 في هذه المجموعة.
فتح الحزمة
k this deck
31
The graph below shows the approximate annual percentage growth rate in world population for the years 1960 through
2010. Data is estimated by the UN Census Bureau. Use the graph to answer the question.
In which year(s)during the period 1960-2010 is world population growing at the fastest rate?
A)1970
B)1984
C)1963-1964
D)2010
2010. Data is estimated by the UN Census Bureau.
Use the graph to answer the question.In which year(s)during the period 1960-2010 is world population growing at the fastest rate?
A)1970
B)1984
C)1963-1964
D)2010
فتح الحزمة
افتح القفل للوصول البطاقات البالغ عددها 230 في هذه المجموعة.
فتح الحزمة
k this deck
32
In order to answer the given question, which of the following types of study would be the most appropriate: anexperiment without blinding, an experiment with single blinding, an experiment with double blinding, an observationalstudy, or a case-control study?
Does smoking elevate blood pressure?
A)Case-control study
B)Experiment with single blinding
C)Experiment with double blinding
D)Experiment without blinding
E)Observational study
Does smoking elevate blood pressure?
A)Case-control study
B)Experiment with single blinding
C)Experiment with double blinding
D)Experiment without blinding
E)Observational study
فتح الحزمة
افتح القفل للوصول البطاقات البالغ عددها 230 في هذه المجموعة.
فتح الحزمة
k this deck
33
Answer as requested.
A researcher finds a positive correlation between the amount of wine people drink and the number of friends they have. Which of the following statements must be true? More than one statement
May be true.
A: People who drink more tend, on average, to have more friends.
B: If a person starts drinking more wine, they are likely to find themselves with more friends.
C: If a person stops drinking wine, they are likely to find themselves with fewer friends.
D: If Anna has more friends then Pierre, she must drink more wine than Pierre.
A)A and D
B)A
C)B and C
D)A and B
فتح الحزمة
افتح القفل للوصول البطاقات البالغ عددها 230 في هذه المجموعة.
فتح الحزمة
k this deck
34
Answer the question.
A poll is taken of likely voters the day before the mayoral election in the town of Ingleside. The poll reveals that 54% of voters plan to vote for Anne Sanchez. The margin of error is 3.9 percentage
Points. Which of the following statements best describes Anne Sanchez's chance of winning?
A)She is very likely to win
B)She has a 54% chance of winning
C)She is certain to win
D)It is about 50-50
فتح الحزمة
افتح القفل للوصول البطاقات البالغ عددها 230 في هذه المجموعة.
فتح الحزمة
k this deck
35
The graph below shows estimated world population for the period 4000 BC 2000 AD. Note that the logarithm of the
world population and not actual population is plotted on the vertical axis. This means, for example, that when the graph
reaches 7 on the vertical scale, world population is and when the graph reaches 9 on the vertical scale, world
population is . Use the graph to answer the question.
How does world population in the year 1000 AD compare with world population in the year 2000 BC?
A)The 1000 AD population is roughly one million larger than the 2000 BC population.
B)The 1000 AD population is roughly 14% larger than the 2000 BC population.
C)The 1000 AD population is roughly ten million larger than the 2000 BC population.
D)The 1000 AD population is roughly ten times as large as the 2000 BC population.
2000 AD. Note that the logarithm of theworld population and not actual population is plotted on the vertical axis. This means, for example, that when the graph
reaches 7 on the vertical scale, world population is
and when the graph reaches 9 on the vertical scale, worldpopulation is
. Use the graph to answer the question.How does world population in the year 1000 AD compare with world population in the year 2000 BC?
A)The 1000 AD population is roughly one million larger than the 2000 BC population.
B)The 1000 AD population is roughly 14% larger than the 2000 BC population.
C)The 1000 AD population is roughly ten million larger than the 2000 BC population.
D)The 1000 AD population is roughly ten times as large as the 2000 BC population.
فتح الحزمة
افتح القفل للوصول البطاقات البالغ عددها 230 في هذه المجموعة.
فتح الحزمة
k this deck
36
Answer the question.
Which of the following quantities of interest would be most difficult to determine?
A)The percentage of children who brush their teeth at least twice a day
B)The percentage of second graders who read above grade level
C)The number of children living below the poverty line
D)The number of children not counted in the last census
فتح الحزمة
افتح القفل للوصول البطاقات البالغ عددها 230 في هذه المجموعة.
فتح الحزمة
k this deck
37
Answer as requested.
Which of the following is likely the result of some common underlying cause rather than a direct cause?
A)The more items sold, the greater the revenue.
B)When the NASDAQ rises, the Dow Jones Industrial Average also tends to rise.
C)People who eat a lot of dessert tend to be heavier than those who don't.
D)The more cash I take out at the ATM, the more my account balance decreases.
فتح الحزمة
افتح القفل للوصول البطاقات البالغ عددها 230 في هذه المجموعة.
فتح الحزمة
k this deck
38
In order to answer the given question, which of the following types of study would be the most appropriate: anexperiment without blinding, an experiment with single blinding, an experiment with double blinding, an observationalstudy, or a case-control study?
Can acupuncture relieve anxiety? [The level of anxiety at any given time will be determined by interviewing the patient. The interviewer will be a person other than the acupuncturist.]
A)Case-control study
B)Experiment without blinding
C)Observational study
D)Experiment with single blinding
E)Experiment with double blinding
فتح الحزمة
افتح القفل للوصول البطاقات البالغ عددها 230 في هذه المجموعة.
فتح الحزمة
k this deck
39
Answer the question.
Which of the following describes the bias that occurs when researchers select their sample in such a way that it is unlikely to be representative of the population?
A)Double-blind bias
B)Selection bias
C)Availability bias
D)Participation bias
Which of the following describes the bias that occurs when researchers select their sample in such a way that it is unlikely to be representative of the population?
A)Double-blind bias
B)Selection bias
C)Availability bias
D)Participation bias
فتح الحزمة
افتح القفل للوصول البطاقات البالغ عددها 230 في هذه المجموعة.
فتح الحزمة
k this deck
40
Answer the question.
Which of the following quantities of interest would be the most difficult to measure?
A)The average height of a volleyball team
B)The best looking team member
C)The team member with the longest hair
D)The team member with the highest salary
Which of the following quantities of interest would be the most difficult to measure?
A)The average height of a volleyball team
B)The best looking team member
C)The team member with the longest hair
D)The team member with the highest salary
فتح الحزمة
افتح القفل للوصول البطاقات البالغ عددها 230 في هذه المجموعة.
فتح الحزمة
k this deck
41
Choose the best wording for the question in the study.
A recent magazine article determined that the Gemini is the most popular car on the road. A TV journalist decided to check the accuracy of the article by conducting a survey. Which of the
Following survey questions will give the journalist the most accurate results?
A)What kind of car do you recall seeing most often on the highway?
B)What kind of car do you drive?
C)What do you think is the most popular car on the road?
D)Do you agree that the Gemini is the most popular car on the road?
فتح الحزمة
افتح القفل للوصول البطاقات البالغ عددها 230 في هذه المجموعة.
فتح الحزمة
k this deck
42
Answer the question.
Which of the following describes a study in which the researchers do not attempt to change the characteristics of those being studied?
A)Case-control study
B)Double-blind experiment
C)Single-blind experiment
D)Observational study
Which of the following describes a study in which the researchers do not attempt to change the characteristics of those being studied?
A)Case-control study
B)Double-blind experiment
C)Single-blind experiment
D)Observational study
فتح الحزمة
افتح القفل للوصول البطاقات البالغ عددها 230 في هذه المجموعة.
فتح الحزمة
k this deck
43
Answer the question.
Which of the following quantities of interest would be the most difficult to measure?
A)The crop with the largest tomatoes
B)The levels of pesticides in a tomato crop
C)The largest crop of tomatoes
D)The best tasting tomato crop
Which of the following quantities of interest would be the most difficult to measure?
A)The crop with the largest tomatoes
B)The levels of pesticides in a tomato crop
C)The largest crop of tomatoes
D)The best tasting tomato crop
فتح الحزمة
افتح القفل للوصول البطاقات البالغ عددها 230 في هذه المجموعة.
فتح الحزمة
k this deck
44
Use the indicated bin size to construct a frequency table for the set of data. Include columns for relative frequency andcumulative frequency.
On a math test, the scores of 24 students were as follows:
On a math test, the scores of 24 students were as follows:
فتح الحزمة
افتح القفل للوصول البطاقات البالغ عددها 230 في هذه المجموعة.
فتح الحزمة
k this deck
45
Write the word or phrase that best completes each statement or answers the question.Solve the problem.
A researcher finds a positive correlation between the number of vaccinations and the
incidence of autism. Can you conclude that vaccinations can cause autism? Suggest some
ways that the researcher could go about establishing causality. Refer to the six guidelines
for establishing causality.
A researcher finds a positive correlation between the number of vaccinations and the
incidence of autism. Can you conclude that vaccinations can cause autism? Suggest some
ways that the researcher could go about establishing causality. Refer to the six guidelines
for establishing causality.
فتح الحزمة
افتح القفل للوصول البطاقات البالغ عددها 230 في هذه المجموعة.
فتح الحزمة
k this deck
46
Answer as requested.
Which of the following is not a guideline for establishing causality?
A)Seek evidence that larger amounts of the cause produce larger amounts of the effect.
B)Consider only the suspected cause, ignoring other potential causes.
C)If possible, test the suspected cause with an experiment.
D)Find a physical model that explains how the cause produces the effect.
فتح الحزمة
افتح القفل للوصول البطاقات البالغ عددها 230 في هذه المجموعة.
فتح الحزمة
k this deck
47
In order to answer the given question, which of the following types of study would be the most appropriate: anexperiment without blinding, an experiment with single blinding, an experiment with double blinding, an observationalstudy, or a case-control study?
In which of these four soil types will the plants grow fastest?
A)Experiment with single blinding
B)Observational study
C)Experiment with double blinding
D)Experiment without blinding
E)Case-control study
In which of these four soil types will the plants grow fastest?
A)Experiment with single blinding
B)Observational study
C)Experiment with double blinding
D)Experiment without blinding
E)Case-control study
فتح الحزمة
افتح القفل للوصول البطاقات البالغ عددها 230 في هذه المجموعة.
فتح الحزمة
k this deck
48
Answer the question.
Which of the following study results implies that there is a problem with the quality of education at Rydell High?
A)30% of the senior class scored above average on the writing portion of a national aptitude test.
B)83% of the seniors who applied for admission to Valley State College were accepted.
C)25% of the senior class scored below average on the math portion of a national aptitude test.
D)53% of the senior class was accepted for admission to Valley State College in the fall.
فتح الحزمة
افتح القفل للوصول البطاقات البالغ عددها 230 في هذه المجموعة.
فتح الحزمة
k this deck
49
Answer as requested.
Which of the following best describes our level of confidence in causality when we have discovered a correlation but cannot yet determine whether the correlation implies causality?
A)Cause beyond reasonable doubt
B)Possible cause
C)Probable cause
D)Absolute certainty
Which of the following best describes our level of confidence in causality when we have discovered a correlation but cannot yet determine whether the correlation implies causality?
A)Cause beyond reasonable doubt
B)Possible cause
C)Probable cause
D)Absolute certainty
فتح الحزمة
افتح القفل للوصول البطاقات البالغ عددها 230 في هذه المجموعة.
فتح الحزمة
k this deck
50
The graph below shows the approximate annual percentage growth rate in world population for the years 1960 through
2010. Data is estimated by the UN Census Bureau. Use the graph to answer the question.
How does world population in 1978 compare to world population in 1977?
A)It is 1.75 million greater
B)It is 1.75% less
C)It is 1.75% greater
D)It is the same
2010. Data is estimated by the UN Census Bureau.
Use the graph to answer the question.How does world population in 1978 compare to world population in 1977?
A)It is 1.75 million greater
B)It is 1.75% less
C)It is 1.75% greater
D)It is the same
فتح الحزمة
افتح القفل للوصول البطاقات البالغ عددها 230 في هذه المجموعة.
فتح الحزمة
k this deck
51
Answer the question.
Which of the following is not an argument against using blinding in an experiment?
A)The participants in the experiment don't believe in the placebo effect
B)The experiment is done on plants, not people
C)The experiment involves animals, not people
D)It would be impossible to conceal from the participants whether they are receiving the treatment or the placebo
فتح الحزمة
افتح القفل للوصول البطاقات البالغ عددها 230 في هذه المجموعة.
فتح الحزمة
k this deck
52
Use the guidelines to evaluate the study. Discuss flaws that you see in the study.
The principal of Laney High School interviews all the seniors at his school and asks them
whether they have ever used drugs. The principal of Little Heath High School interviews
all the seniors at her school and asks them whether they have ever used drugs. The results
suggest that Laney has a lower rate of drug use. A researcher concludes that the counseling
program available at Laney High School is effective in lowering drug use.
فتح الحزمة
افتح القفل للوصول البطاقات البالغ عددها 230 في هذه المجموعة.
فتح الحزمة
k this deck
53
Answer as requested.
In studying the relationship between abortion and breast cancer, researchers have identified a hormone that they believe explains how having an abortion can lead to breast cancer. This
Explanation is an example of which of the guidelines for establishing causality?
A)Evidence that larger amounts of the suspected cause produce larger amounts of the effect.
B)A physical model demonstrating how abortion can cause breast cancer
C)Verification that breast cancer rates differ among groups that differ only in the presence or absence of the suspected cause (abortion).
D)An experiment to establish causality between abortion and breast cancer.
فتح الحزمة
افتح القفل للوصول البطاقات البالغ عددها 230 في هذه المجموعة.
فتح الحزمة
k this deck
54
Answer as requested.
Which of the following pairs of variables is likely to have a negative correlation?
A)The unemployment rate and the number of homeless people
B)The price of jet fuel and the price of airline tickets.
C)Height and weight.
D)Interest rates and the number of real estate transactions
Which of the following pairs of variables is likely to have a negative correlation?
A)The unemployment rate and the number of homeless people
B)The price of jet fuel and the price of airline tickets.
C)Height and weight.
D)Interest rates and the number of real estate transactions
فتح الحزمة
افتح القفل للوصول البطاقات البالغ عددها 230 في هذه المجموعة.
فتح الحزمة
k this deck
55
Choose the best wording for the question in the study.
A recent newspaper article stated that Snazzy's is the most popular restaurant in the city. The city council decided to sponsor its own survey to determine the accuracy of the article. Which of the
Following survey questions will give the most accurate results?
A)Which restaurant in the city do you visit most often?
B)Do you agree that Snazzy's is the most popular restaurant in the city?
C)Which restaurant in the city do you think is the most crowded?
D)Which restaurant do you think is the most popular in the city?
فتح الحزمة
افتح القفل للوصول البطاقات البالغ عددها 230 في هذه المجموعة.
فتح الحزمة
k this deck
56
The graph below shows estimated world population for the period 4000 BC 2000 AD. Note that the logarithm of the
world population and not actual population is plotted on the vertical axis. This means, for example, that when the graph
reaches 7 on the vertical scale, world population is and when the graph reaches 9 on the vertical scale, world
population is Use the graph to answer the question.
How does world population in the year 2000 AD compare with world population in the year 4000 BC?
A)The 2000 AD population is roughly three billion larger than the 4000 BC population.
B)The 2000 AD population is roughly thirty times as large as the 4000 BC population.
C)The 2000 AD population is roughly 44% larger than the 4000 BC population.
D)The 2000 AD population is roughly one thousand times as large as the 4000 BC population.
2000 AD. Note that the logarithm of theworld population and not actual population is plotted on the vertical axis. This means, for example, that when the graph
reaches 7 on the vertical scale, world population is
and when the graph reaches 9 on the vertical scale, worldpopulation is
Use the graph to answer the question.How does world population in the year 2000 AD compare with world population in the year 4000 BC?
A)The 2000 AD population is roughly three billion larger than the 4000 BC population.
B)The 2000 AD population is roughly thirty times as large as the 4000 BC population.
C)The 2000 AD population is roughly 44% larger than the 4000 BC population.
D)The 2000 AD population is roughly one thousand times as large as the 4000 BC population.
فتح الحزمة
افتح القفل للوصول البطاقات البالغ عددها 230 في هذه المجموعة.
فتح الحزمة
k this deck
57
The graph below shows estimated world population for the period 4000 BC 2000 AD. Note that the logarithm of the
world population and not actual population is plotted on the vertical axis. This means, for example, that when the graph
reaches 7 on the vertical scale, world population is and when the graph reaches 9 on the vertical scale, world
population is .
Log World Population Use the graph to answer the question.
Describe the general trend in world population during the period 2000 BC to the year 1 AD.
A)World population increases at a slower and slower rate.
B)World population increases at a constant rate.
C)World population is constant.
D)World population increases at a faster and faster rate.
2000 AD. Note that the logarithm of theworld population and not actual population is plotted on the vertical axis. This means, for example, that when the graph
reaches 7 on the vertical scale, world population is
and when the graph reaches 9 on the vertical scale, worldpopulation is
.Log World Population
Use the graph to answer the question.Describe the general trend in world population during the period 2000 BC to the year 1 AD.
A)World population increases at a slower and slower rate.
B)World population increases at a constant rate.
C)World population is constant.
D)World population increases at a faster and faster rate.
فتح الحزمة
افتح القفل للوصول البطاقات البالغ عددها 230 في هذه المجموعة.
فتح الحزمة
k this deck
58
Answer the question.
Which of the following describes the bias that can occur when members of a study's sample are volunteers?
A)Participation bias
B)Single-blind bias
C)Selection bias
D)Sample bias
Which of the following describes the bias that can occur when members of a study's sample are volunteers?
A)Participation bias
B)Single-blind bias
C)Selection bias
D)Sample bias
فتح الحزمة
افتح القفل للوصول البطاقات البالغ عددها 230 في هذه المجموعة.
فتح الحزمة
k this deck
59
Describe how you would apply the five basic steps of a statistical study to the given issue.
As a marketing executive for a computer company you wish to determine the average
length of time that owners of personal computers in the U.S. keep a computer before
buying a newer model.
As a marketing executive for a computer company you wish to determine the average
length of time that owners of personal computers in the U.S. keep a computer before
buying a newer model.
فتح الحزمة
افتح القفل للوصول البطاقات البالغ عددها 230 في هذه المجموعة.
فتح الحزمة
k this deck
60
In order to answer the given question, which of the following types of study would be the most appropriate: anexperiment without blinding, an experiment with single blinding, an experiment with double blinding, an observationalstudy, or a case-control study?
Do Super-Slimmer Shakes increase weight loss?
A)Experiment without blinding
B)Observational study
C)Experiment with single blinding
D)Experiment with double blinding
E)Case-control study
Do Super-Slimmer Shakes increase weight loss?
A)Experiment without blinding
B)Observational study
C)Experiment with single blinding
D)Experiment with double blinding
E)Case-control study
فتح الحزمة
افتح القفل للوصول البطاقات البالغ عددها 230 في هذه المجموعة.
فتح الحزمة
k this deck
61
Use the graph to answer the question.
The bar graph below shows the relative frequencies of the different blood types. Write a
sentence describing what is revealed by the graph.
The bar graph below shows the relative frequencies of the different blood types. Write a
sentence describing what is revealed by the graph.
فتح الحزمة
افتح القفل للوصول البطاقات البالغ عددها 230 في هذه المجموعة.
فتح الحزمة
k this deck
62
Solve the problem.
A researcher finds a negative correlation between blood pressure and the number of
vacations that people take. Can you conclude that taking vacations lowers blood
pressure? Propose other explanations for the correlation. Suggest some ways that the
researcher could go about establishing causality. Refer to the six guidelines for establishing
causality.
فتح الحزمة
افتح القفل للوصول البطاقات البالغ عددها 230 في هذه المجموعة.
فتح الحزمة
k this deck
63
Answer the question.
In the graph, Andrew draws 5 equally spaced bars of heights 1 in, 2 in, 3 in, 4 in, and 5 in
respectively. The height of each bar corresponds to the amount of sales. He labels each bar
with the corresponding year (1975, 1985, 1993, 1999, 2003 respectively). Why is the graph
misleading?
In the graph, Andrew draws 5 equally spaced bars of heights 1 in, 2 in, 3 in, 4 in, and 5 inrespectively. The height of each bar corresponds to the amount of sales. He labels each bar
with the corresponding year (1975, 1985, 1993, 1999, 2003 respectively). Why is the graph
misleading?
فتح الحزمة
افتح القفل للوصول البطاقات البالغ عددها 230 في هذه المجموعة.
فتح الحزمة
k this deck
64
Answer the question.
The bar graph below shows the number of car accidents occurring in one city in each of the
years 1993 through 1998. The number of accidents dropped in 1995 after a new speed limit
was imposed. Why is the graph misleading? How would you redesign the graph so that it
is less misleading? What impression is conveyed by the graph?
فتح الحزمة
افتح القفل للوصول البطاقات البالغ عددها 230 في هذه المجموعة.
فتح الحزمة
k this deck
65
Construct th e specified histogram.
30 police detectives were asked how many days they had taken off in the previous year.
The results are summarized in the frequency table below . Construct a histogram.
e specified histogram.30 police detectives were asked how many days they had taken off in the previous year.
The results are summarized in the frequency table below .
Construct a histogram. فتح الحزمة
افتح القفل للوصول البطاقات البالغ عددها 230 في هذه المجموعة.
فتح الحزمة
k this deck
66
Answer the question.
The bar graph below shows the average cost of renting a studio in a certain city in each of
the years 1994 through 1998. By what percentage does the average rental price increase from 1994 to 1995? Obtain a
truncated version of the graph by sliding a piece of paper over the bottom portion of the
graph so that the scale on the vertical axis starts at 300. In the truncated graph, by what
percentage does the price appear to increase from 1994 to 1995? Why is the truncated
graph misleading?
The bar graph below shows the average cost of renting a studio in a certain city in each of
the years 1994 through 1998.
By what percentage does the average rental price increase from 1994 to 1995? Obtain atruncated version of the graph by sliding a piece of paper over the bottom portion of the
graph so that the scale on the vertical axis starts at 300. In the truncated graph, by what
percentage does the price appear to increase from 1994 to 1995? Why is the truncated
graph misleading?
فتح الحزمة
افتح القفل للوصول البطاقات البالغ عددها 230 في هذه المجموعة.
فتح الحزمة
k this deck
67
Describe how you would apply the five basic steps of a statistical study to the given issue.
As an executive of a large software company, you want to know whether there has been an
increase in levels of stress amongst your employees.
As an executive of a large software company, you want to know whether there has been an
increase in levels of stress amongst your employees.
فتح الحزمة
افتح القفل للوصول البطاقات البالغ عددها 230 في هذه المجموعة.
فتح الحزمة
k this deck
68
Make a bar graph to represent the data.
The following table shows the number of male infants born at Hospital X on New Year's
Day (Jan. 1). Create a horizontal bar graph.
The following table shows the number of male infants born at Hospital X on New Year's
Day (Jan. 1). Create a horizontal bar graph.
فتح الحزمة
افتح القفل للوصول البطاقات البالغ عددها 230 في هذه المجموعة.
فتح الحزمة
k this deck
69
Use the guidelines to evaluate the study. Discuss flaws that you see in the study.
An acupuncturist notes that after a month of acupuncture 80% of her patients who had
been suffering from depression are feeling better. The acupuncturist determines the level
of depression by interviewing the patients at the beginning of the month and at the end of
the month. She concludes that acupuncture has an 80% success rate in relieving depression.
فتح الحزمة
افتح القفل للوصول البطاقات البالغ عددها 230 في هذه المجموعة.
فتح الحزمة
k this deck
70
Describe how you would apply the five basic steps of a statistical study to the given issue.
You want to know the percentage of college seniors who regret their choice of major.
You want to know the percentage of college seniors who regret their choice of major.
فتح الحزمة
افتح القفل للوصول البطاقات البالغ عددها 230 في هذه المجموعة.
فتح الحزمة
k this deck
71
Create a graphical display for the data given. You may choose any graphic type that you feel is appropriate. Write a fewsentences explaining why you chose this type of display and a few sentences describing any interesting patterns in thedata.
The table below shows the number of AIDS diagnoses for the United Kingdom by year.
The table below shows the number of AIDS diagnoses for the United Kingdom by year.
فتح الحزمة
افتح القفل للوصول البطاقات البالغ عددها 230 في هذه المجموعة.
فتح الحزمة
k this deck
72
Make a bar graph to represent the data.
The table lists the winners of the Wimbledon women's singles title for the years 1976-1995.
Construct a vertical bar graph for the given relative frequencies.
The table lists the winners of the Wimbledon women's singles title for the years 1976-1995.
Construct a vertical bar graph for the given relative frequencies.
فتح الحزمة
افتح القفل للوصول البطاقات البالغ عددها 230 في هذه المجموعة.
فتح الحزمة
k this deck
73
Answer the question.
A parcel delivery service lowered its prices and finds that it has delivered twice as many
parcels this year as it did last year. To illustrate this fact, the manager draws a pictogram as
shown below. Each cube depicts a parcel. The side length of the "parcel" on the right is
twice the side length of the "parcel" on the left. Why is this pictogram misleading? What visual impression is portrayed by the pictogram?
A parcel delivery service lowered its prices and finds that it has delivered twice as many
parcels this year as it did last year. To illustrate this fact, the manager draws a pictogram as
shown below. Each cube depicts a parcel. The side length of the "parcel" on the right is
twice the side length of the "parcel" on the left.
Why is this pictogram misleading? What visual impression is portrayed by the pictogram? فتح الحزمة
افتح القفل للوصول البطاقات البالغ عددها 230 في هذه المجموعة.
فتح الحزمة
k this deck
74
Construct the specified histogram.
فتح الحزمة
افتح القفل للوصول البطاقات البالغ عددها 230 في هذه المجموعة.
فتح الحزمة
k this deck
75
Solve the problem.
A researcher suspects that pesticides in foods cause cancer. Suggest some ways that she
could go about establishing causality. Refer to the six guidelines for establishing causality.
For each guideline suggest some research that should be pursued. Discuss any challenges
that the researcher would face in establishing causality.
فتح الحزمة
افتح القفل للوصول البطاقات البالغ عددها 230 في هذه المجموعة.
فتح الحزمة
k this deck
76
Answer the question.
The mayor of one city has been conducting an anti-smoking campaign in high schools.
Each year local government researchers estimate the number of teenagers in the city who
smoke. The number of smokers has declined steadily in each of the past five years. The
mayor's office constructs a bar graph showing the number of teenage smokers in each of
the past five years. If the mayor wished to exaggerate the success of his anti-smoking
campaign, would it be to his advantage to truncate the bar graph? Explain your thinking.
فتح الحزمة
افتح القفل للوصول البطاقات البالغ عددها 230 في هذه المجموعة.
فتح الحزمة
k this deck
77
Use the guidelines to evaluate the study. Discuss flaws that you see in the study.
A researcher is interested in why Americans have such a high divorce rate. She randomly
selects 100 American married couples and 100 Japanese married couples. She invites each
couple to come into her office and interviews each couple, asking them about their
satisfaction with their marriage.
The researcher also notes that a high percentage of the American women had full time jobs
outside the home, whereas a high percentage of the Japanese women did not have full time
jobs. The researcher concluded that marriages in which the woman has a full time job have
a lower rate of success.
فتح الحزمة
افتح القفل للوصول البطاقات البالغ عددها 230 في هذه المجموعة.
فتح الحزمة
k this deck
78
Describe how you would apply the five basic steps of a statistical study to the given issue.You want to know the average amount paid in rent by tenants of the city of Hazelwood.
فتح الحزمة
افتح القفل للوصول البطاقات البالغ عددها 230 في هذه المجموعة.
فتح الحزمة
k this deck
79
Use the guidelines to evaluate the study. Discuss flaws that you see in the study.
The host of a conservative talk show asked his listeners to respond to the following
question: "Do you think that environmental laws which restrict growth should be
weakened?" Twenty people responded, and the next day the talk show host announced
that the results of his survey suggested that 76% of Americans feel that environmental laws
should be weakened.
فتح الحزمة
افتح القفل للوصول البطاقات البالغ عددها 230 في هذه المجموعة.
فتح الحزمة
k this deck
80
Use the guidelines to evaluate the study. Discuss flaws that you see in the study.A researcher randomly selects 300 adults from the city of Kentwood by using a random
number generator and a list of residents of the town. She calls the people in the sample and
asks the following question: "Do you agree that more of the city's budget should be spent
on social services for the poor? " She announces that 54% of the people in Kentwood feel
that more of the city's budget should be spent on social services for the poor.
فتح الحزمة
افتح القفل للوصول البطاقات البالغ عددها 230 في هذه المجموعة.
فتح الحزمة
k this deck
فتح الحزمة
افتح القفل للوصول البطاقات البالغ عددها 230 في هذه المجموعة.


