Deck 3: Relationships Between Categorical Variablescontingency Tables
ملء الشاشة (f)
سؤال
سؤال
سؤال
سؤال
سؤال
سؤال
Here is a stacked bar chart for data collected about employee blood pressure. 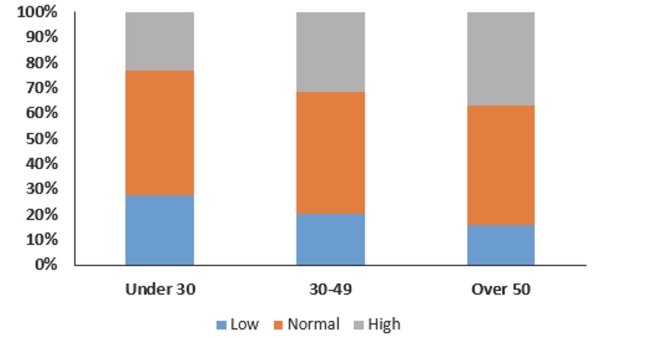 This chart shows
A)the distribution of a quantitative variable.
B)the contingency distribution of blood pressure type.
C)the conditional distribution of blood pressure type.
D)the marginal distribution of blood pressure type.
E)the joint distribution of blood pressure type.
This chart showsA)the distribution of a quantitative variable.
B)the contingency distribution of blood pressure type.
C)the conditional distribution of blood pressure type.
D)the marginal distribution of blood pressure type.
E)the joint distribution of blood pressure type.
سؤال
سؤال
The following is a bar chart summarizing consumer preferences for various brands of digital
Cameras.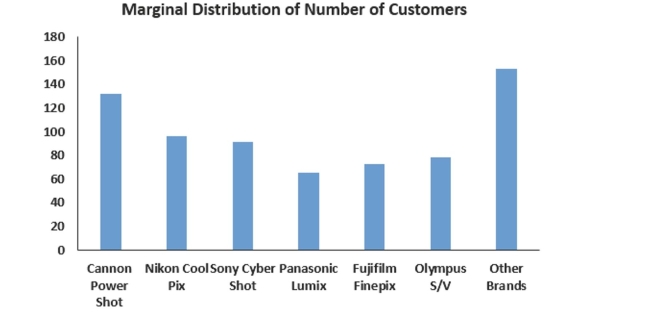
This bar chart shows
A)the marginal distribution of brands.
B)the conditional distribution of brands.
C)the contingency distribution of brands.
D)the distribution for a quantitative variable.
E)none of the above.
Cameras.
This bar chart shows
A)the marginal distribution of brands.
B)the conditional distribution of brands.
C)the contingency distribution of brands.
D)the distribution for a quantitative variable.
E)none of the above.
سؤال
سؤال
سؤال
سؤال
سؤال
What is the marginal distribution of milk consumption?
سؤال
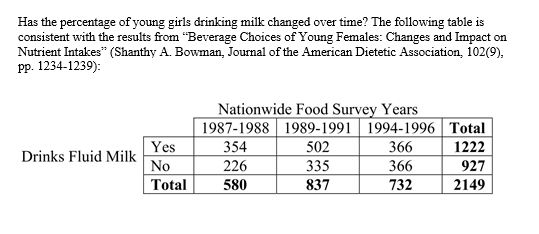
Has the percentage of young girls drinking milk changed over time? The following table is consistent with the results from "Beverage Choices of Young Females: Changes and Impact on Nutrient Intakes" (Shanthy A. Bowman, Journal of the American Dietetic Association, 102(9), pp. 1234-1239):
-Consider the following pie charts of a subset of the data above:
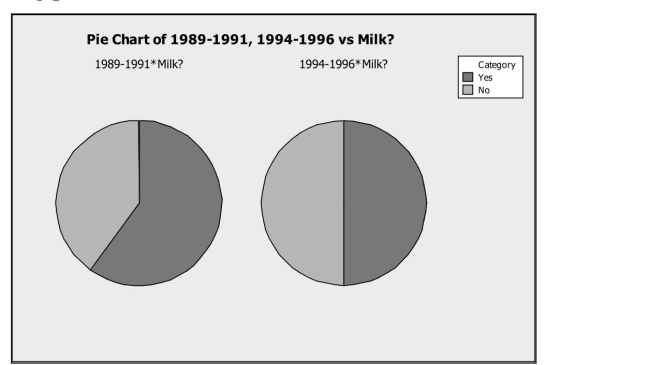
Do the pie charts above indicate that milk consumption by young girls is independent of the
nationwide survey year? Explain.
-Consider the following pie charts of a subset of the data above:
Do the pie charts above indicate that milk consumption by young girls is independent of the
nationwide survey year? Explain.
سؤال
سؤال
Do you think that milk consumption by young girls is independent of the nationwide survey
year? Use statistics to justify your reasoning.
سؤال
سؤال
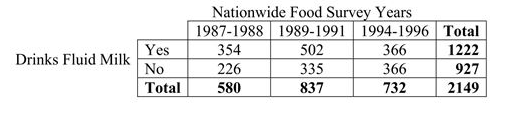
Has the percentage of young girls drinking milk changed over time? The following table is consistent with the results from "Beverage Choices of Young Females: Changes and Impact on Nutrient Intakes" (Shanthy A. Bowman, Journal of the American Dietetic Association, 102(9), pp. 1234-1239):
-a. What percent of the young girls reported that they drink milk? ______
b. What percent of the young girls were in the 1989-1991 survey?_______
c. What percent of the young girls who reported that they drink milk were in the 1989-1991 survey?_____
d. What percent of the young girls in 1989-1991 reported they drink milk?_______
سؤال
سؤال
سؤال
Accenture, a consulting firm, conducted an online survey of 500 US consumers from in 2013. 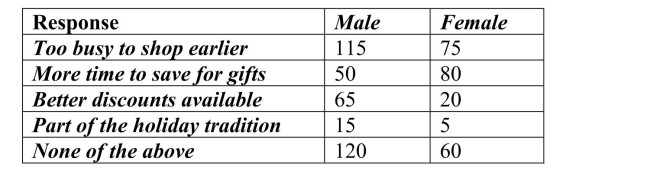 What percentage of men were felt that better discounts were available on "Black Friday"?
A)26.5%
B)65%
C)20%
D)17.8%
E)5.5%
What percentage of men were felt that better discounts were available on "Black Friday"?A)26.5%
B)65%
C)20%
D)17.8%
E)5.5%
سؤال
A regional survey was carried out to gauge public opinion on the controversial Arizona
Immigration Law.The results are displayed in the segmented bar chart below.Which of the
Following statements is true?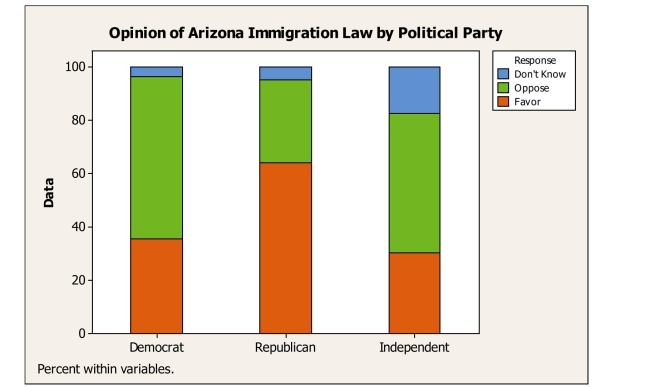
A)A greater percentage of Republicans oppose the law compared to Democrats.
B)A greater percentage of Republicans oppose the law compared to Independents.
C)Opinion about the law appears to be independent of political party affiliation.
D)A greater percentage of Democrats oppose the law compared to Republicans.
E)The segmented bar chart is not appropriate for these data.
سؤال
Accenture, a consulting firm, conducted an online survey of 500 US consumers from in 2013. 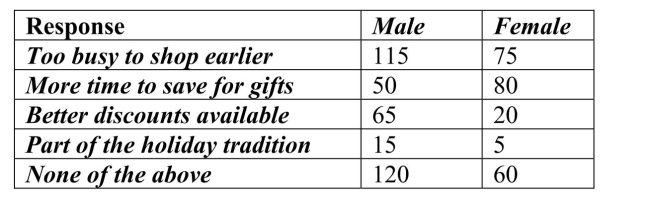 What percentage of those who thought that better discounts were available on "Black Friday"
Were female?
A)81.3%
B)33.3%
C)11.1%
D)47.2%
E)23.5%
What percentage of those who thought that better discounts were available on "Black Friday"Were female?
A)81.3%
B)33.3%
C)11.1%
D)47.2%
E)23.5%
سؤال
A regional survey was carried out to gauge public opinion on the controversial Arizona
Immigration Law (results shown below).How many respondents are Republican and favor
The law?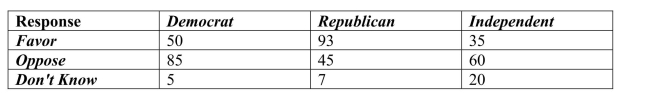
A)93
B)45
C)145
D)7
Immigration Law (results shown below).How many respondents are Republican and favor
The law?
A)93
B)45
C)145
D)7
سؤال
سؤال
A regional survey was carried out to gauge public opinion on the controversial Arizona
Immigration Law (results shown below).Of respondents who are Democrat, what percent
Oppose the law?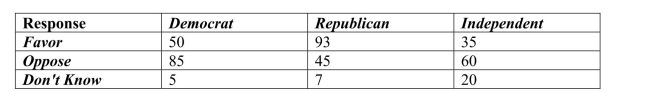
A)13%
B)35%
C)22%
D)45%
E)61%
Immigration Law (results shown below).Of respondents who are Democrat, what percent
Oppose the law?
A)13%
B)35%
C)22%
D)45%
E)61%
سؤال
Accenture, a consulting firm, conducted an online survey of 500 US consumers in September 2013.Based on their response to the question "What is your motive for shopping late in the
Season?" which of the following would be appropriate method(s) for displaying the male
Only data shown in the table?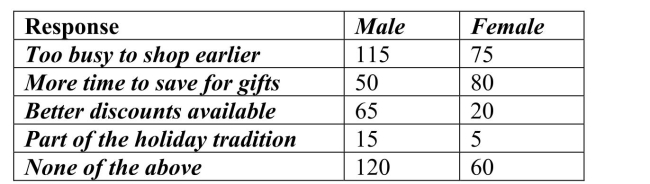
A)Contingency table.
B)Pie chart.
C)Segmented bar chart.
D)Side by side bar chart.
E)All of the above.
Season?" which of the following would be appropriate method(s) for displaying the male
Only data shown in the table?
A)Contingency table.
B)Pie chart.
C)Segmented bar chart.
D)Side by side bar chart.
E)All of the above.
سؤال
A regional survey was carried out to gauge public opinion on the controversial Arizona
Immigration Law (results shown below).What percent oppose the law?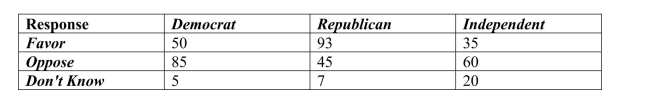
A)48%
B)45%
C)32%
D)25%
E)61%
Immigration Law (results shown below).What percent oppose the law?
A)48%
B)45%
C)32%
D)25%
E)61%
سؤال

فتح الحزمة
قم بالتسجيل لفتح البطاقات في هذه المجموعة!
Unlock Deck
Unlock Deck
1/29
العب
ملء الشاشة (f)
Deck 3: Relationships Between Categorical Variablescontingency Tables
1
A company interested in the health of its employees started a health program including
Monitoring blood pressure.Based on age, employees were categorized according to ranges of Blood pressure by age intervals.Data are shown in the table below.
Of all employees, the percentage of those under 50 years old is
A)17.1% (82/480).
B)40.6% (195/480).
C)13.5% (65/480).
D)36.9% (72/195).
E)49.4% (285/480).
49.4% (285/480).
2
A company interested in the health of its employees started a health program including
Monitoring blood pressure.Based on age, employees were categorized according to ranges of
Blood pressure by age intervals.Data are shown in the table below.
The percentage of employees who are over age 50 and have high blood pressure is
A)46.8% (72/154).
B)32.1% (154/480).
C)31.6% (59/187).
D)36.9% (72/195).
36.9% (72/195).
3
To determine if people's preference in dogs had changed in the recent years, organizers of a local
dog show asked people who attended the show to indicate which breed was their favorite. This
information was compiled by dog breed and gender of the people who responded. The table
summarizes the responses.
Do you think the breed selection is independent of gender? Give statistical evidence to
support your conclusion.
The breed selection does not appear to be independent of gender.Overall, 56% of the respondents were females,
but females were over-represented among those who favored Golden Retrievers (64%) and Dalmatians (62%),
yet a much lower percentage (47%) among those who chose Labradors.
but females were over-represented among those who favored Golden Retrievers (64%) and Dalmatians (62%),
yet a much lower percentage (47%) among those who chose Labradors.
4
To determine if people's preference in dogs had changed in the recent years, organizers of a local
dog show asked people who attended the show to indicate which breed was their favorite. This
information was compiled by dog breed and gender of the people who responded. The table
summarizes the responses.
-Which of the W's are unknown for these data?
dog show asked people who attended the show to indicate which breed was their favorite. This
information was compiled by dog breed and gender of the people who responded. The table
summarizes the responses.
-Which of the W's are unknown for these data?
فتح الحزمة
افتح القفل للوصول البطاقات البالغ عددها 29 في هذه المجموعة.
فتح الحزمة
k this deck
5
To determine if people's preference in dogs had changed in the recent years, organizers of a local
dog show asked people who attended the show to indicate which breed was their favorite. This
information was compiled by dog breed and gender of the people who responded. The table
summarizes the responses.
-Write a sentence or two about the conditional relative frequency distribution of the breeds
among female respondents.
فتح الحزمة
افتح القفل للوصول البطاقات البالغ عددها 29 في هذه المجموعة.
فتح الحزمة
k this deck
6
Here is a stacked bar chart for data collected about employee blood pressure. This chart shows
A)the distribution of a quantitative variable.
B)the contingency distribution of blood pressure type.
C)the conditional distribution of blood pressure type.
D)the marginal distribution of blood pressure type.
E)the joint distribution of blood pressure type.
This chart showsA)the distribution of a quantitative variable.
B)the contingency distribution of blood pressure type.
C)the conditional distribution of blood pressure type.
D)the marginal distribution of blood pressure type.
E)the joint distribution of blood pressure type.
فتح الحزمة
افتح القفل للوصول البطاقات البالغ عددها 29 في هذه المجموعة.
فتح الحزمة
k this deck
7
A large national retailer of electronics conducted a survey to determine consumer preferences
For various brands of digital cameras and the data are summarized in the table shown below.
The percentage of consumers who are male and prefer Fujifilm is
A)44.3 % (305/688).
B)10.6% (73/688).
C)38.4% (28/73).
D)56.2% (41/73).
E)4.1% (28/688).
For various brands of digital cameras and the data are summarized in the table shown below.
The percentage of consumers who are male and prefer Fujifilm is
A)44.3 % (305/688).
B)10.6% (73/688).
C)38.4% (28/73).
D)56.2% (41/73).
E)4.1% (28/688).
فتح الحزمة
افتح القفل للوصول البطاقات البالغ عددها 29 في هذه المجموعة.
فتح الحزمة
k this deck
8
The following is a bar chart summarizing consumer preferences for various brands of digital
Cameras.
This bar chart shows
A)the marginal distribution of brands.
B)the conditional distribution of brands.
C)the contingency distribution of brands.
D)the distribution for a quantitative variable.
E)none of the above.
Cameras.
This bar chart shows
A)the marginal distribution of brands.
B)the conditional distribution of brands.
C)the contingency distribution of brands.
D)the distribution for a quantitative variable.
E)none of the above.
فتح الحزمة
افتح القفل للوصول البطاقات البالغ عددها 29 في هذه المجموعة.
فتح الحزمة
k this deck
9
A large national retailer of electronics conducted a survey to determine consumer preferences
For various brands of digital cameras and the data are summarized in the table shown below.
Of the consumers who prefer Olympus, what percentage is female?
A)47.4 % (37/78).
B)6.0% (41/688).
C)52.6% (41/78).
D)11.7% (45/383).
E)11.3% (78/688).
For various brands of digital cameras and the data are summarized in the table shown below.
Of the consumers who prefer Olympus, what percentage is female?
A)47.4 % (37/78).
B)6.0% (41/688).
C)52.6% (41/78).
D)11.7% (45/383).
E)11.3% (78/688).
فتح الحزمة
افتح القفل للوصول البطاقات البالغ عددها 29 في هذه المجموعة.
فتح الحزمة
k this deck
10
A company interested in the health of its employees started a health program including
Monitoring blood pressure.Based on age, employees were categorized according to ranges of
Blood pressure by age intervals.Data are shown in the table below.
Of all employees, the percentage who are over 50 and have high blood pressure is
A)46.8% (72/154).
B)15.0% (72/480).
C)31.6% (59/187).
D)36.9% (72/195).
E)47.2% (92/195).
فتح الحزمة
افتح القفل للوصول البطاقات البالغ عددها 29 في هذه المجموعة.
فتح الحزمة
k this deck
11
In May, 2010, the Pew Research Center for the People & the Press carried out a national
Survey to gauge opinion on the Arizona Immigration Law.Responses (Favor, Oppose, Don't
Know) were examined according to groups defined by political party affiliation (Democrat,
Republican, Independent).Which of the following would be appropriate for displaying these
Data?
A)Contingency table.
B)Pie charts.
C)Segmented bar chart.
D)Side by side bar chart.
E)All of the above.
فتح الحزمة
افتح القفل للوصول البطاقات البالغ عددها 29 في هذه المجموعة.
فتح الحزمة
k this deck
12
A company interested in the health of its employees started a health program including
Monitoring blood pressure.Based on age, employees were categorized according to ranges of
Blood pressure by age intervals.Data are shown in the table below.
The percentage of employees with normal or low blood pressure is
A)67.9% (326/480).
B)47.9% (230/480).
C)41.7% (96/230).
D)80.0% (384/480).
E)20.0% (96/480).
فتح الحزمة
افتح القفل للوصول البطاقات البالغ عددها 29 في هذه المجموعة.
فتح الحزمة
k this deck
13
What is the marginal distribution of milk consumption?
فتح الحزمة
افتح القفل للوصول البطاقات البالغ عددها 29 في هذه المجموعة.
فتح الحزمة
k this deck
14
Has the percentage of young girls drinking milk changed over time? The following table is consistent with the results from "Beverage Choices of Young Females: Changes and Impact on Nutrient Intakes" (Shanthy A. Bowman, Journal of the American Dietetic Association, 102(9), pp. 1234-1239):
-Consider the following pie charts of a subset of the data above:
Do the pie charts above indicate that milk consumption by young girls is independent of the
nationwide survey year? Explain.
-Consider the following pie charts of a subset of the data above:
Do the pie charts above indicate that milk consumption by young girls is independent of the
nationwide survey year? Explain.
فتح الحزمة
افتح القفل للوصول البطاقات البالغ عددها 29 في هذه المجموعة.
فتح الحزمة
k this deck
15
A large national retailer of electronics conducted a survey to determine consumer preferences
For various brands of digital cameras and the data are summarized in the table shown below.
Of the consumers who are male, the percentage who prefer Sony is
A)44.3 % (305/688).
B)10.8% (33/305).
C)36.3% (33/91).
D)4.8% (33/688).
For various brands of digital cameras and the data are summarized in the table shown below.
Of the consumers who are male, the percentage who prefer Sony is
A)44.3 % (305/688).
B)10.8% (33/305).
C)36.3% (33/91).
D)4.8% (33/688).
فتح الحزمة
افتح القفل للوصول البطاقات البالغ عددها 29 في هذه المجموعة.
فتح الحزمة
k this deck
16
Do you think that milk consumption by young girls is independent of the nationwide survey
year? Use statistics to justify your reasoning.
فتح الحزمة
افتح القفل للوصول البطاقات البالغ عددها 29 في هذه المجموعة.
فتح الحزمة
k this deck
17
To determine if people's preference in dogs had changed in the recent years, organizers of a local
dog show asked people who attended the show to indicate which breed was their favorite. This
information was compiled by dog breed and gender of the people who responded. The table
summarizes the responses.
-Find each percent.
a. What percent of the responses were from males who favor Labradors?______
b. What percent of the male responses favor Labradors?__________
c. What percent of the people who choose Labradors were males?_________
فتح الحزمة
افتح القفل للوصول البطاقات البالغ عددها 29 في هذه المجموعة.
فتح الحزمة
k this deck
18
Has the percentage of young girls drinking milk changed over time? The following table is consistent with the results from "Beverage Choices of Young Females: Changes and Impact on Nutrient Intakes" (Shanthy A. Bowman, Journal of the American Dietetic Association, 102(9), pp. 1234-1239):
-a. What percent of the young girls reported that they drink milk? ______
b. What percent of the young girls were in the 1989-1991 survey?_______
c. What percent of the young girls who reported that they drink milk were in the 1989-1991 survey?_____
d. What percent of the young girls in 1989-1991 reported they drink milk?_______
فتح الحزمة
افتح القفل للوصول البطاقات البالغ عددها 29 في هذه المجموعة.
فتح الحزمة
k this deck
19
To determine if people's preference in dogs had changed in the recent years, organizers of a local
dog show asked people who attended the show to indicate which breed was their favorite. This
information was compiled by dog breed and gender of the people who responded. The table
summarizes the responses.
-Identify the variables and tell whether each is categorical or quantitative.
dog show asked people who attended the show to indicate which breed was their favorite. This
information was compiled by dog breed and gender of the people who responded. The table
summarizes the responses.
-Identify the variables and tell whether each is categorical or quantitative.
فتح الحزمة
افتح القفل للوصول البطاقات البالغ عددها 29 في هذه المجموعة.
فتح الحزمة
k this deck
20
To determine if people's preference in dogs had changed in the recent years, organizers of a local
dog show asked people who attended the show to indicate which breed was their favorite. This
information was compiled by dog breed and gender of the people who responded. The table
summarizes the responses.
-What is the marginal distribution of breeds?
dog show asked people who attended the show to indicate which breed was their favorite. This
information was compiled by dog breed and gender of the people who responded. The table
summarizes the responses.
-What is the marginal distribution of breeds?
فتح الحزمة
افتح القفل للوصول البطاقات البالغ عددها 29 في هذه المجموعة.
فتح الحزمة
k this deck
21
Accenture, a consulting firm, conducted an online survey of 500 US consumers from in 2013. What percentage of men were felt that better discounts were available on "Black Friday"?
A)26.5%
B)65%
C)20%
D)17.8%
E)5.5%
What percentage of men were felt that better discounts were available on "Black Friday"?A)26.5%
B)65%
C)20%
D)17.8%
E)5.5%
فتح الحزمة
افتح القفل للوصول البطاقات البالغ عددها 29 في هذه المجموعة.
فتح الحزمة
k this deck
22
A regional survey was carried out to gauge public opinion on the controversial Arizona
Immigration Law.The results are displayed in the segmented bar chart below.Which of the
Following statements is true?
A)A greater percentage of Republicans oppose the law compared to Democrats.
B)A greater percentage of Republicans oppose the law compared to Independents.
C)Opinion about the law appears to be independent of political party affiliation.
D)A greater percentage of Democrats oppose the law compared to Republicans.
E)The segmented bar chart is not appropriate for these data.
فتح الحزمة
افتح القفل للوصول البطاقات البالغ عددها 29 في هذه المجموعة.
فتح الحزمة
k this deck
23
Accenture, a consulting firm, conducted an online survey of 500 US consumers from in 2013. What percentage of those who thought that better discounts were available on "Black Friday"
Were female?
A)81.3%
B)33.3%
C)11.1%
D)47.2%
E)23.5%
What percentage of those who thought that better discounts were available on "Black Friday"Were female?
A)81.3%
B)33.3%
C)11.1%
D)47.2%
E)23.5%
فتح الحزمة
افتح القفل للوصول البطاقات البالغ عددها 29 في هذه المجموعة.
فتح الحزمة
k this deck
24
A regional survey was carried out to gauge public opinion on the controversial Arizona
Immigration Law (results shown below).How many respondents are Republican and favor
The law?
A)93
B)45
C)145
D)7
Immigration Law (results shown below).How many respondents are Republican and favor
The law?
A)93
B)45
C)145
D)7
فتح الحزمة
افتح القفل للوصول البطاقات البالغ عددها 29 في هذه المجموعة.
فتح الحزمة
k this deck
25
A regional survey was carried out to gauge public opinion on the controversial Arizona
Immigration Law.Based on the results displayed in the table below, what percent of
Respondents is Independent?
A)35%
B)9%
C)29%
D)45%
E)25%
Immigration Law.Based on the results displayed in the table below, what percent of
Respondents is Independent?
A)35%
B)9%
C)29%
D)45%
E)25%
فتح الحزمة
افتح القفل للوصول البطاقات البالغ عددها 29 في هذه المجموعة.
فتح الحزمة
k this deck
26
A regional survey was carried out to gauge public opinion on the controversial Arizona
Immigration Law (results shown below).Of respondents who are Democrat, what percent
Oppose the law?
A)13%
B)35%
C)22%
D)45%
E)61%
Immigration Law (results shown below).Of respondents who are Democrat, what percent
Oppose the law?
A)13%
B)35%
C)22%
D)45%
E)61%
فتح الحزمة
افتح القفل للوصول البطاقات البالغ عددها 29 في هذه المجموعة.
فتح الحزمة
k this deck
27
Accenture, a consulting firm, conducted an online survey of 500 US consumers in September 2013.Based on their response to the question "What is your motive for shopping late in the
Season?" which of the following would be appropriate method(s) for displaying the male
Only data shown in the table?
A)Contingency table.
B)Pie chart.
C)Segmented bar chart.
D)Side by side bar chart.
E)All of the above.
Season?" which of the following would be appropriate method(s) for displaying the male
Only data shown in the table?
A)Contingency table.
B)Pie chart.
C)Segmented bar chart.
D)Side by side bar chart.
E)All of the above.
فتح الحزمة
افتح القفل للوصول البطاقات البالغ عددها 29 في هذه المجموعة.
فتح الحزمة
k this deck
28
A regional survey was carried out to gauge public opinion on the controversial Arizona
Immigration Law (results shown below).What percent oppose the law?
A)48%
B)45%
C)32%
D)25%
E)61%
Immigration Law (results shown below).What percent oppose the law?
A)48%
B)45%
C)32%
D)25%
E)61%
فتح الحزمة
افتح القفل للوصول البطاقات البالغ عددها 29 في هذه المجموعة.
فتح الحزمة
k this deck
29
A regional survey was carried out to gauge public opinion on the controversial Arizona
Immigration Law (results shown below).Of respondents who oppose the law, what percent
Is Democrat?
A)13%
B)35%
C)22%
D)45%
Immigration Law (results shown below).Of respondents who oppose the law, what percent
Is Democrat?
A)13%
B)35%
C)22%
D)45%
فتح الحزمة
افتح القفل للوصول البطاقات البالغ عددها 29 في هذه المجموعة.
فتح الحزمة
k this deck
فتح الحزمة
افتح القفل للوصول البطاقات البالغ عددها 29 في هذه المجموعة.


