Deck 12: Voting Methods
ملء الشاشة (f)
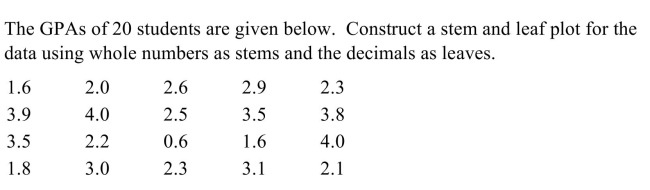
سؤال
سؤال
سؤال
سؤال
سؤال
سؤال
سؤال
سؤال
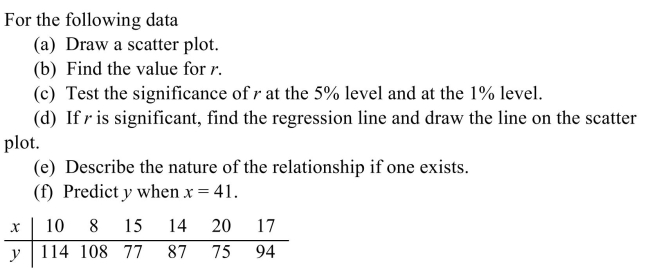
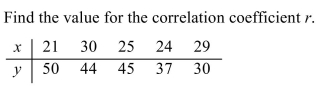
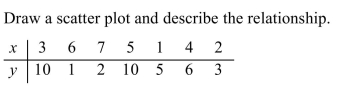
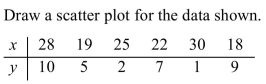
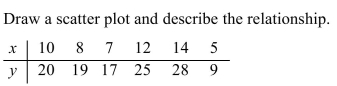
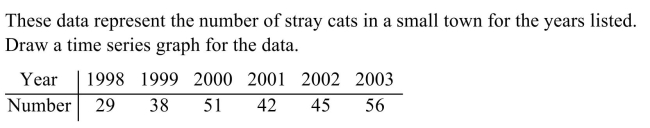
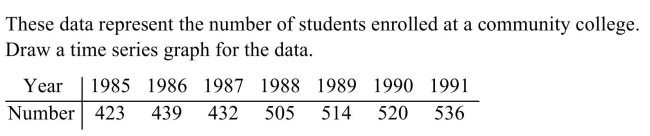
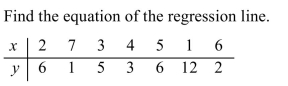
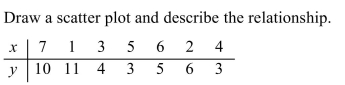
For the following data (a) Draw a scatter plot. (b) Find the value for r. (c) Test the significance of r at the 5% level and at the 1% level. (d) If r is significant, find the regression line and draw the line on the scatter plot. (e) Describe the nature of the relationship if one exists. (f) Predict y when x = 20. 
سؤال
سؤال
سؤال
سؤال
سؤال
سؤال
سؤال
سؤال
سؤال
سؤال
سؤال
سؤال
سؤال
سؤال
سؤال
سؤال
سؤال
سؤال
سؤال
سؤال
سؤال
سؤال
سؤال
سؤال
سؤال
سؤال
سؤال
سؤال
سؤال
سؤال
سؤال
سؤال
سؤال
سؤال
سؤال
سؤال
سؤال
سؤال
سؤال
سؤال
سؤال
سؤال
سؤال
سؤال
سؤال
سؤال
سؤال
سؤال
سؤال
سؤال
سؤال
سؤال
سؤال
سؤال
سؤال
سؤال
سؤال
سؤال
سؤال
سؤال
سؤال
سؤال
سؤال
سؤال
سؤال
سؤال
سؤال
سؤال
سؤال
سؤال
سؤال
سؤال

فتح الحزمة
قم بالتسجيل لفتح البطاقات في هذه المجموعة!
Unlock Deck
Unlock Deck
1/102
العب
ملء الشاشة (f)
Deck 12: Voting Methods
1
Find the midrange. 36 43 15 12 2 38 40 13
22.5
2
The average amount customers at a certain grocery store spend yearly is $647.87. Assume the variable is normally distributed. If the standard deviation is $98.39, find the probability that a randomly selected customer spends less than $677.39.
0.618 = 61.8%
3
For the 8 test scores shown, which score corresponds to a percentile rank of 62.5? 16) 94 23 40 32 64 39 17 54
54
4
فتح الحزمة
افتح القفل للوصول البطاقات البالغ عددها 102 في هذه المجموعة.
فتح الحزمة
k this deck
5
فتح الحزمة
افتح القفل للوصول البطاقات البالغ عددها 102 في هذه المجموعة.
فتح الحزمة
k this deck
6
Find the area under the normal distribution curve to the left of z = -1.50.
فتح الحزمة
افتح القفل للوصول البطاقات البالغ عددها 102 في هذه المجموعة.
فتح الحزمة
k this deck
7
فتح الحزمة
افتح القفل للوصول البطاقات البالغ عددها 102 في هذه المجموعة.
فتح الحزمة
k this deck
8
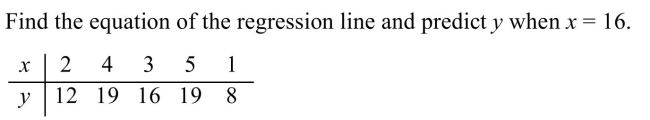
For the following data (a) Draw a scatter plot. (b) Find the value for r. (c) Test the significance of r at the 5% level and at the 1% level. (d) If r is significant, find the regression line and draw the line on the scatter plot. (e) Describe the nature of the relationship if one exists. (f) Predict y when x = 20.
فتح الحزمة
افتح القفل للوصول البطاقات البالغ عددها 102 في هذه المجموعة.
فتح الحزمة
k this deck
9
فتح الحزمة
افتح القفل للوصول البطاقات البالغ عددها 102 في هذه المجموعة.
فتح الحزمة
k this deck
10
فتح الحزمة
افتح القفل للوصول البطاقات البالغ عددها 102 في هذه المجموعة.
فتح الحزمة
k this deck
11
فتح الحزمة
افتح القفل للوصول البطاقات البالغ عددها 102 في هذه المجموعة.
فتح الحزمة
k this deck
12
فتح الحزمة
افتح القفل للوصول البطاقات البالغ عددها 102 في هذه المجموعة.
فتح الحزمة
k this deck
13
فتح الحزمة
افتح القفل للوصول البطاقات البالغ عددها 102 في هذه المجموعة.
فتح الحزمة
k this deck
14
فتح الحزمة
افتح القفل للوصول البطاقات البالغ عددها 102 في هذه المجموعة.
فتح الحزمة
k this deck
15
فتح الحزمة
افتح القفل للوصول البطاقات البالغ عددها 102 في هذه المجموعة.
فتح الحزمة
k this deck
16
فتح الحزمة
افتح القفل للوصول البطاقات البالغ عددها 102 في هذه المجموعة.
فتح الحزمة
k this deck
فتح الحزمة
افتح القفل للوصول البطاقات البالغ عددها 102 في هذه المجموعة.
فتح الحزمة
k this deck
17
فتح الحزمة
افتح القفل للوصول البطاقات البالغ عددها 102 في هذه المجموعة.
فتح الحزمة
k this deck
فتح الحزمة
افتح القفل للوصول البطاقات البالغ عددها 102 في هذه المجموعة.
فتح الحزمة
k this deck
18
فتح الحزمة
افتح القفل للوصول البطاقات البالغ عددها 102 في هذه المجموعة.
فتح الحزمة
k this deck
19
Find the area under the normal distribution curve between z = 0 and z = -2.65.
فتح الحزمة
افتح القفل للوصول البطاقات البالغ عددها 102 في هذه المجموعة.
فتح الحزمة
k this deck
20
فتح الحزمة
افتح القفل للوصول البطاقات البالغ عددها 102 في هذه المجموعة.
فتح الحزمة
k this deck
21
فتح الحزمة
افتح القفل للوصول البطاقات البالغ عددها 102 في هذه المجموعة.
فتح الحزمة
k this deck
22
فتح الحزمة
افتح القفل للوصول البطاقات البالغ عددها 102 في هذه المجموعة.
فتح الحزمة
k this deck
23
For the 8 test scores shown, find the percentile rank of 68. 29 87 68 34 60 31 30 61
فتح الحزمة
افتح القفل للوصول البطاقات البالغ عددها 102 في هذه المجموعة.
فتح الحزمة
k this deck
24
فتح الحزمة
افتح القفل للوصول البطاقات البالغ عددها 102 في هذه المجموعة.
فتح الحزمة
k this deck
25
فتح الحزمة
افتح القفل للوصول البطاقات البالغ عددها 102 في هذه المجموعة.
فتح الحزمة
k this deck
26
فتح الحزمة
افتح القفل للوصول البطاقات البالغ عددها 102 في هذه المجموعة.
فتح الحزمة
k this deck
27
فتح الحزمة
افتح القفل للوصول البطاقات البالغ عددها 102 في هذه المجموعة.
فتح الحزمة
k this deck
28
فتح الحزمة
افتح القفل للوصول البطاقات البالغ عددها 102 في هذه المجموعة.
فتح الحزمة
k this deck
29
فتح الحزمة
افتح القفل للوصول البطاقات البالغ عددها 102 في هذه المجموعة.
فتح الحزمة
k this deck
30
فتح الحزمة
افتح القفل للوصول البطاقات البالغ عددها 102 في هذه المجموعة.
فتح الحزمة
k this deck
31
Find the median. 20 21 22 26 27 33 25
فتح الحزمة
افتح القفل للوصول البطاقات البالغ عددها 102 في هذه المجموعة.
فتح الحزمة
k this deck
32
The average hourly wage of employees of a certain company is $13.74. Assume the variable is normally distributed. If the standard deviation is $4.25, find the probability that a randomly selected employee earns more than $20.54.
فتح الحزمة
افتح القفل للوصول البطاقات البالغ عددها 102 في هذه المجموعة.
فتح الحزمة
k this deck
33
فتح الحزمة
افتح القفل للوصول البطاقات البالغ عددها 102 في هذه المجموعة.
فتح الحزمة
k this deck
34
Find the range. 7 40 6 45 26 4 28 46
فتح الحزمة
افتح القفل للوصول البطاقات البالغ عددها 102 في هذه المجموعة.
فتح الحزمة
k this deck
35
فتح الحزمة
افتح القفل للوصول البطاقات البالغ عددها 102 في هذه المجموعة.
فتح الحزمة
k this deck
36
فتح الحزمة
افتح القفل للوصول البطاقات البالغ عددها 102 في هذه المجموعة.
فتح الحزمة
k this deck
37
فتح الحزمة
افتح القفل للوصول البطاقات البالغ عددها 102 في هذه المجموعة.
فتح الحزمة
k this deck
38
فتح الحزمة
افتح القفل للوصول البطاقات البالغ عددها 102 في هذه المجموعة.
فتح الحزمة
k this deck
39
Find the variance and standard deviation. 36) 16 6 14 50 6 46
فتح الحزمة
افتح القفل للوصول البطاقات البالغ عددها 102 في هذه المجموعة.
فتح الحزمة
k this deck
40
فتح الحزمة
افتح القفل للوصول البطاقات البالغ عددها 102 في هذه المجموعة.
فتح الحزمة
k this deck
41
Find the mean. 12 8 14 12 11 18 18 12
فتح الحزمة
افتح القفل للوصول البطاقات البالغ عددها 102 في هذه المجموعة.
فتح الحزمة
k this deck
42
فتح الحزمة
افتح القفل للوصول البطاقات البالغ عددها 102 في هذه المجموعة.
فتح الحزمة
k this deck
43
فتح الحزمة
افتح القفل للوصول البطاقات البالغ عددها 102 في هذه المجموعة.
فتح الحزمة
k this deck
44
فتح الحزمة
افتح القفل للوصول البطاقات البالغ عددها 102 في هذه المجموعة.
فتح الحزمة
k this deck
45
فتح الحزمة
افتح القفل للوصول البطاقات البالغ عددها 102 في هذه المجموعة.
فتح الحزمة
k this deck
46
فتح الحزمة
افتح القفل للوصول البطاقات البالغ عددها 102 في هذه المجموعة.
فتح الحزمة
k this deck
47
فتح الحزمة
افتح القفل للوصول البطاقات البالغ عددها 102 في هذه المجموعة.
فتح الحزمة
k this deck
48
فتح الحزمة
افتح القفل للوصول البطاقات البالغ عددها 102 في هذه المجموعة.
فتح الحزمة
k this deck
49
Find the area under the normal distribution curve between z = 0 and z = 1.25.
فتح الحزمة
افتح القفل للوصول البطاقات البالغ عددها 102 في هذه المجموعة.
فتح الحزمة
k this deck
50
The average selling price of homes in a certain city is $125,400. Assume the variable is normally distributed with a standard deviation of $62,700. If 151 homes are for sale, how many homes will sell for more than $97,185?
فتح الحزمة
افتح القفل للوصول البطاقات البالغ عددها 102 في هذه المجموعة.
فتح الحزمة
k this deck
51
فتح الحزمة
افتح القفل للوصول البطاقات البالغ عددها 102 في هذه المجموعة.
فتح الحزمة
k this deck
52
فتح الحزمة
افتح القفل للوصول البطاقات البالغ عددها 102 في هذه المجموعة.
فتح الحزمة
k this deck
53
فتح الحزمة
افتح القفل للوصول البطاقات البالغ عددها 102 في هذه المجموعة.
فتح الحزمة
k this deck
54
Find the mode. 22 16 8 14 16 13 14 34
فتح الحزمة
افتح القفل للوصول البطاقات البالغ عددها 102 في هذه المجموعة.
فتح الحزمة
k this deck
55
فتح الحزمة
افتح القفل للوصول البطاقات البالغ عددها 102 في هذه المجموعة.
فتح الحزمة
k this deck
56
فتح الحزمة
افتح القفل للوصول البطاقات البالغ عددها 102 في هذه المجموعة.
فتح الحزمة
k this deck
57
فتح الحزمة
افتح القفل للوصول البطاقات البالغ عددها 102 في هذه المجموعة.
فتح الحزمة
k this deck
58
فتح الحزمة
افتح القفل للوصول البطاقات البالغ عددها 102 في هذه المجموعة.
فتح الحزمة
k this deck
59
فتح الحزمة
افتح القفل للوصول البطاقات البالغ عددها 102 في هذه المجموعة.
فتح الحزمة
k this deck
60
فتح الحزمة
افتح القفل للوصول البطاقات البالغ عددها 102 في هذه المجموعة.
فتح الحزمة
k this deck
61
Find the area under the normal distribution curve to the left of z = 0.55.
A) 0.291
B) 0.709
C) 0.209
D) -0.209
A) 0.291
B) 0.709
C) 0.209
D) -0.209
فتح الحزمة
افتح القفل للوصول البطاقات البالغ عددها 102 في هذه المجموعة.
فتح الحزمة
k this deck
62
Find the area under the normal distribution curve between z = 0.30 and z = 2.10.
A) 0.600
B) 0.482
C) 0.364
D) 0.118
A) 0.600
B) 0.482
C) 0.364
D) 0.118
فتح الحزمة
افتح القفل للوصول البطاقات البالغ عددها 102 في هذه المجموعة.
فتح الحزمة
k this deck
63
فتح الحزمة
افتح القفل للوصول البطاقات البالغ عددها 102 في هذه المجموعة.
فتح الحزمة
k this deck
64
An aptitude test has a mean of 400 and a standard deviation of 40. The test scores are normally distributed. If 2500 people take the test, find the number of people who will score between 314 and 490.
A) 35
B) 2430
C) 70
D) 2465
A) 35
B) 2430
C) 70
D) 2465
فتح الحزمة
افتح القفل للوصول البطاقات البالغ عددها 102 في هذه المجموعة.
فتح الحزمة
k this deck
65
For the 20 test scores shown, find the percentile rank for a score of 86. 75 63 92 74 86 50 77 82 98 65 71 89 75 66 87 59 70 83 91 73
A) 30th percentile
B) 75th percentile
C) 70th percentile
D) 80th percentile
A) 30th percentile
B) 75th percentile
C) 70th percentile
D) 80th percentile
فتح الحزمة
افتح القفل للوصول البطاقات البالغ عددها 102 في هذه المجموعة.
فتح الحزمة
k this deck
66
Find the variance. 2 14 32 31 29 24
A) 139.6
B) 11.82
C) 720.4
D) 116.33
A) 139.6
B) 11.82
C) 720.4
D) 116.33
فتح الحزمة
افتح القفل للوصول البطاقات البالغ عددها 102 في هذه المجموعة.
فتح الحزمة
k this deck
67
A) 111.1
B) 109.9
C) 107.5
D) 105.6
فتح الحزمة
افتح القفل للوصول البطاقات البالغ عددها 102 في هذه المجموعة.
فتح الحزمة
k this deck
68
A) 0.763
B) 0.968
C) 0.874
D) 0.551
فتح الحزمة
افتح القفل للوصول البطاقات البالغ عددها 102 في هذه المجموعة.
فتح الحزمة
k this deck
69
فتح الحزمة
افتح القفل للوصول البطاقات البالغ عددها 102 في هذه المجموعة.
فتح الحزمة
k this deck
70
Assume a data set is normally distributed with mean 14 and standard deviation 1.5. If the data set contains 30 data values, approximately how many of the data values will fall within the range 12.5 to 15.5?
A) 13
B) 20
C) 29
D) 10
A) 13
B) 20
C) 29
D) 10
فتح الحزمة
افتح القفل للوصول البطاقات البالغ عددها 102 في هذه المجموعة.
فتح الحزمة
k this deck
71
فتح الحزمة
افتح القفل للوصول البطاقات البالغ عددها 102 في هذه المجموعة.
فتح الحزمة
k this deck
72
Suppose the average size (in square feet) of homes in a certain region is 2101. Assume the variable is normally distributed with standard deviation 120. If a person in the region was intending to build a 2227 square foot home but downsized and built a 1873 square foot home, what was the change in percentile rank from the original plan to the actual home that was built?
A) The change in percentile rank is 71.
B) The change in percentile rank is 94.
C) The change in percentile rank is 82.
D) The change in percentile rank is 12.
A) The change in percentile rank is 71.
B) The change in percentile rank is 94.
C) The change in percentile rank is 82.
D) The change in percentile rank is 12.
فتح الحزمة
افتح القفل للوصول البطاقات البالغ عددها 102 في هذه المجموعة.
فتح الحزمة
k this deck
73
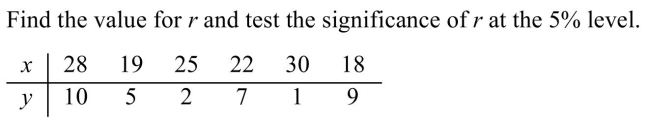
Determine whether a correlation coefficient of r = -0.67 is significant at the 5% level for a sample size of 10.
A) r is significant at 5%.
B) r is not significant at 5%.
A) r is significant at 5%.
B) r is not significant at 5%.
فتح الحزمة
افتح القفل للوصول البطاقات البالغ عددها 102 في هذه المجموعة.
فتح الحزمة
k this deck
74
Find the area under the normal distribution curve to the right of z = 0.35.
فتح الحزمة
افتح القفل للوصول البطاقات البالغ عددها 102 في هذه المجموعة.
فتح الحزمة
k this deck
75
Find the standard deviation. 33 38 38 46 27 16
A) 90.67
B) 10.43
C) 9.52
D) 108.8
A) 90.67
B) 10.43
C) 9.52
D) 108.8
فتح الحزمة
افتح القفل للوصول البطاقات البالغ عددها 102 في هذه المجموعة.
فتح الحزمة
k this deck
76
فتح الحزمة
افتح القفل للوصول البطاقات البالغ عددها 102 في هذه المجموعة.
فتح الحزمة
k this deck
77
Assume a data set is normally distributed with mean 129 and standard deviation 35. If the data set contains 350 data values, approximately how many of the data values will fall within the range 59 to 199?
A) 88
B) 239
C) 123
D) 334
A) 88
B) 239
C) 123
D) 334
فتح الحزمة
افتح القفل للوصول البطاقات البالغ عددها 102 في هذه المجموعة.
فتح الحزمة
k this deck
78
Find the mean, median, mode, and midrange for the data provided. The data shows hours spent at work for a group of men.
A) mean: 47.225, median: 45.2, mode: no mode, midrange: 47.3
B) mean: 45.2, median: 47.225, mode: 45.2, midrange: 35.2
C) mean: 47.225, median: 47.3, mode: no mode, midrange: 47.3
D) mean: 45.2, median: 47.225, mode: 47.3, midrange: 35.2
A) mean: 47.225, median: 45.2, mode: no mode, midrange: 47.3
B) mean: 45.2, median: 47.225, mode: 45.2, midrange: 35.2
C) mean: 47.225, median: 47.3, mode: no mode, midrange: 47.3
D) mean: 45.2, median: 47.225, mode: 47.3, midrange: 35.2
فتح الحزمة
افتح القفل للوصول البطاقات البالغ عددها 102 في هذه المجموعة.
فتح الحزمة
k this deck
79
فتح الحزمة
افتح القفل للوصول البطاقات البالغ عددها 102 في هذه المجموعة.
فتح الحزمة
k this deck
80
A) Nonlinear relationship
B) Positive linear relationship
C) No relationship
D) Negative linear relationship
فتح الحزمة
افتح القفل للوصول البطاقات البالغ عددها 102 في هذه المجموعة.
فتح الحزمة
k this deck
فتح الحزمة
افتح القفل للوصول البطاقات البالغ عددها 102 في هذه المجموعة.


