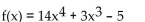
Deck 6: Higher-Degree Polynomial and Rational Functions
ملء الشاشة (f)
سؤال
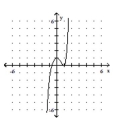
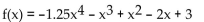
Determine whether the polynomial function is cubic or quartic.
A) Cubic
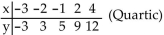
B) Quartic
A) Cubic
B) Quartic
سؤال
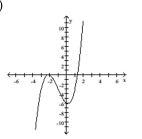
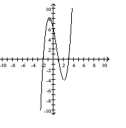
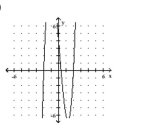
Use the given graph of the polynomial function to estimate the x-intercepts.
A)
В)
C)
D)
A)
В)
C)
D)
سؤال
سؤال
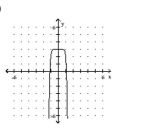
Determine whether the polynomial function is cubic or quartic.
A) Cubic
B) Quartic
A) Cubic
B) Quartic
سؤال
سؤال
سؤال
سؤال
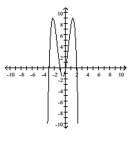
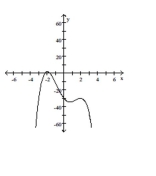
Use the given graph of the polynomial function to state whether the leading coefficient is positive or negative and
whether the polynomial function is cubic or quartic.
A) Positive; Cubic
B) Negative; Quartic
C) Positive; Quartic
D) Negative; Cubic
whether the polynomial function is cubic or quartic.
A) Positive; Cubic
B) Negative; Quartic
C) Positive; Quartic
D) Negative; Cubic
سؤال
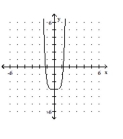
Determine whether the polynomial function is cubic or quartic.
A) Quartic
B) Cubic
A) Quartic
B) Cubic
سؤال
Use the given graph of the polynomial function to estimate the x-intercepts.
A)
B)
C)
D)
A)
B)
C)
D)
سؤال
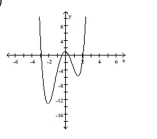
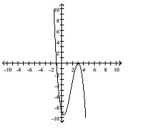
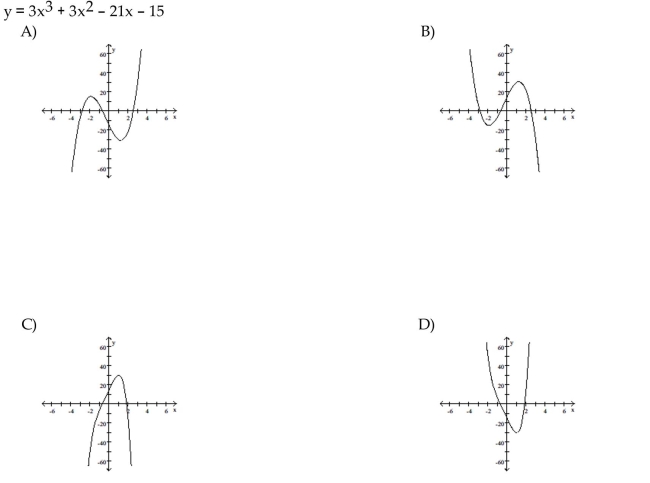
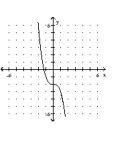
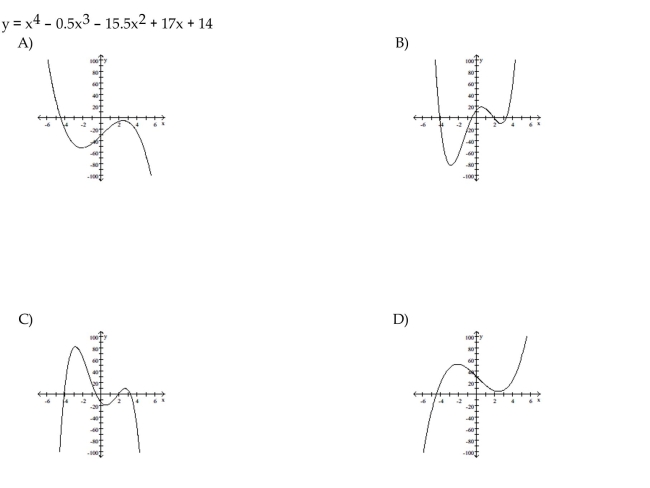
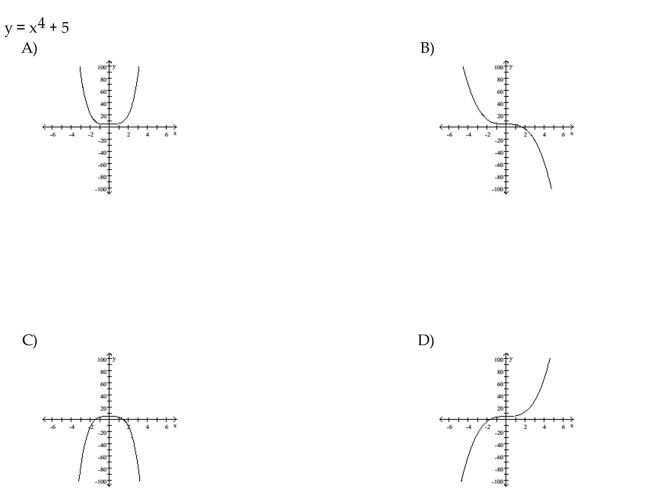
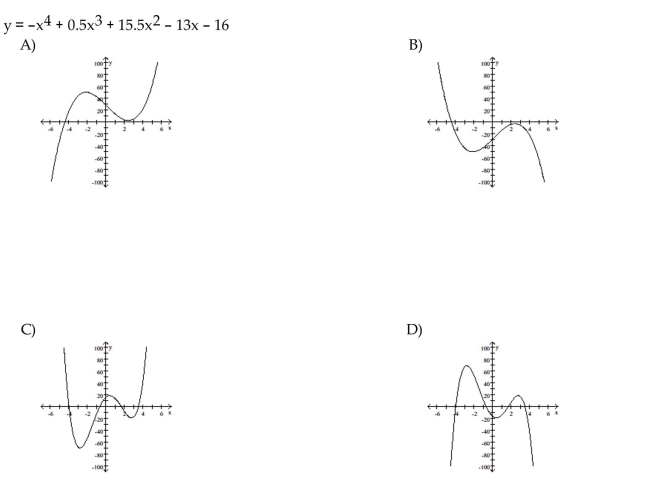
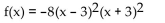
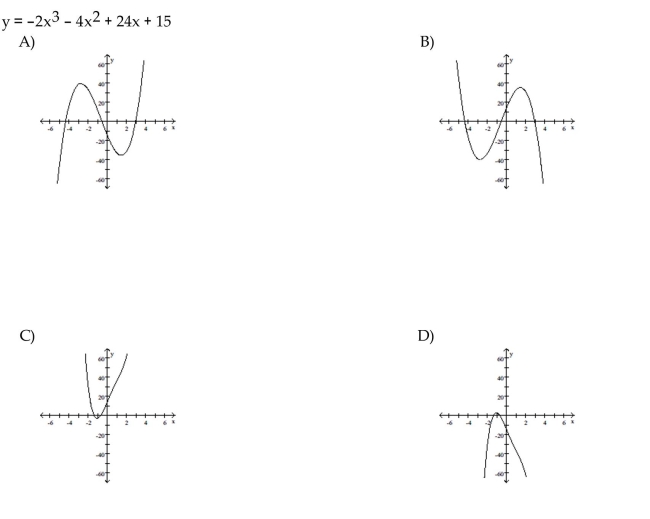
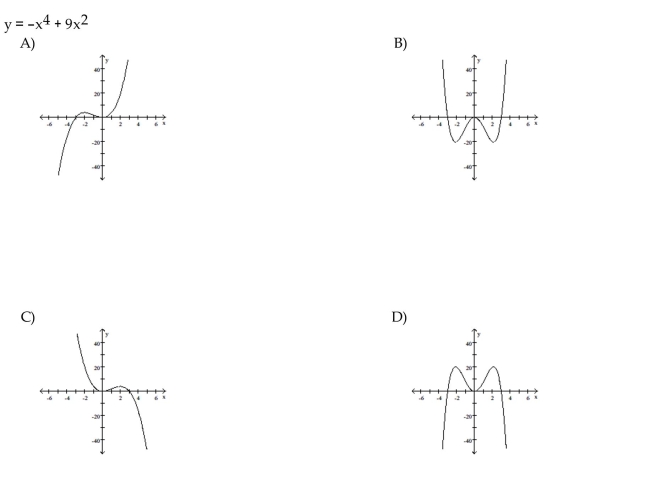
Match the polynomial function with the graph.
سؤال
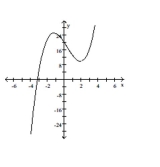
Use the given graph of the polynomial function to state whether the leading coefficient is positive or negative and
whether the polynomial function is cubic or quartic.
A) Negative; Cubic
B) Positive; Cubic
C) Negative; Quartic
D) Positive; Quartic
whether the polynomial function is cubic or quartic.
A) Negative; Cubic
B) Positive; Cubic
C) Negative; Quartic
D) Positive; Quartic
سؤال
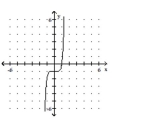
Use the given graph of the polynomial function to state whether the leading coefficient is positive or negative and
whether the polynomial function is cubic or quartic.
A) Negative; Quartic
B) Positive; Cubic
C) Negative; Cubic
D) Positive; Quartic
whether the polynomial function is cubic or quartic.
A) Negative; Quartic
B) Positive; Cubic
C) Negative; Cubic
D) Positive; Quartic
سؤال
Use the given graph of the polynomial function to state whether the leading coefficient is positive or negative and
whether the polynomial function is cubic or quartic.
A) Negative; Cubic
B) Negative; Quartic
C) Positive; Quartic
D) Positive; Cubic
whether the polynomial function is cubic or quartic.
A) Negative; Cubic
B) Negative; Quartic
C) Positive; Quartic
D) Positive; Cubic
سؤال
Use the given graph of the polynomial function to estimate the x-intercepts.
A)
B)
C)
D)
A)
B)
C)
D)
سؤال
سؤال
Use the given graph of the polynomial function to state whether the leading coefficient is positive or negative and
whether the polynomial function is cubic or quartic.
A) Positive; Quartic
B) Negative; Cubic
C) Positive; Cubic
D) Negative; Quartic
whether the polynomial function is cubic or quartic.
A) Positive; Quartic
B) Negative; Cubic
C) Positive; Cubic
D) Negative; Quartic
سؤال
سؤال
Use the given graph of the polynomial function to state whether the leading coefficient is positive or negative and
whether the polynomial function is cubic or quartic.
A) Positive; Cubic
B) Negative; Cubic
C) Negative; Quartic
D) Positive; Quartic
whether the polynomial function is cubic or quartic.
A) Positive; Cubic
B) Negative; Cubic
C) Negative; Quartic
D) Positive; Quartic
سؤال
Determine whether the polynomial function is cubic or quartic.
A) Quartic
B) Cubic
A) Quartic
B) Cubic
سؤال
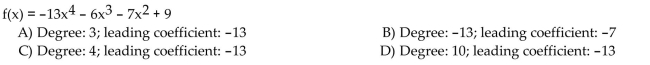
State the degree and leading coefficient of the polynomial function.

سؤال
State the degree and leading coefficient of the polynomial function.

سؤال
Predict the end behavior of the graph of the function.
A) Up on left side, down on right side
B) Down on left side, up on right side
C) Up on both sides
D) Down on both sides
A) Up on left side, down on right side
B) Down on left side, up on right side
C) Up on both sides
D) Down on both sides
سؤال
Match the polynomial function with the graph.
سؤال
Match the polynomial function with the graph.
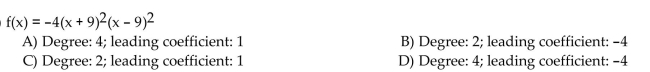
سؤال
State the degree and leading coefficient of the polynomial function.
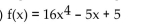
A) Degree: 6; leading coefficient: 16
B) Degree: 5; leading coefficient: 16
C) Degree: 16; leading coefficient: 4
D) Degree: 4; leading coefficient: 16
A) Degree: 6; leading coefficient: 16
B) Degree: 5; leading coefficient: 16
C) Degree: 16; leading coefficient: 4
D) Degree: 4; leading coefficient: 16
سؤال
State the degree and leading coefficient of the polynomial function.
سؤال
State the degree and leading coefficient of the polynomial function.

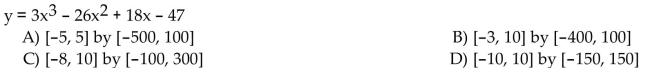
سؤال
Determine a window that will provide a comprehensive graph of the polynomial function.
سؤال
State the degree and leading coefficient of the polynomial function.
A) Degree: 14; leading coefficient: 4
B) Degree: 8; leading coefficient: 14
C) Degree: 7; leading coefficient: 14
D) Degree: 4; leading coefficient: 14
A) Degree: 14; leading coefficient: 4
B) Degree: 8; leading coefficient: 14
C) Degree: 7; leading coefficient: 14
D) Degree: 4; leading coefficient: 14
سؤال
Match the polynomial function with the graph.
سؤال
Predict the end behavior of the graph of the function.
A) Down on both sides
B) Up on the right side, down on the left side
C) Up on both sides
D) Down on the right side, up on the left side
A) Down on both sides
B) Up on the right side, down on the left side
C) Up on both sides
D) Down on the right side, up on the left side
سؤال
Choose the graph that satisfies the given conditions.
Polynomial of degree 3 with three distinct x nd a positive leading coefficient
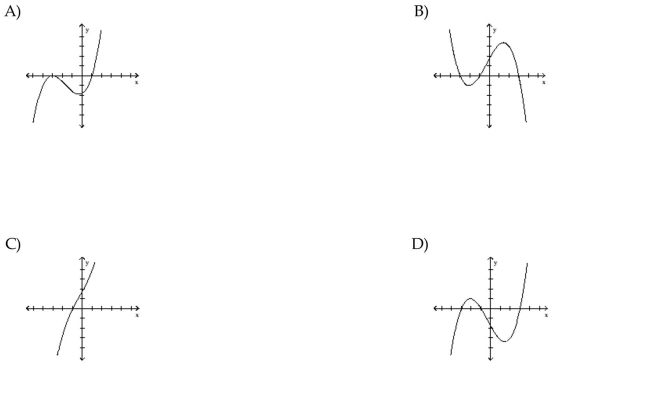
Polynomial of degree 3 with three distinct x
nd a positive leading coefficient سؤال
Match the polynomial function with the graph.
سؤال
Predict the end behavior of the graph of the function.
A) Down on both sides
B) Up on both sides
C) Down on the right side, up on the left side
D) Up on the right side, down on the left side
A) Down on both sides
B) Up on both sides
C) Down on the right side, up on the left side
D) Up on the right side, down on the left side
سؤال
Predict the end behavior of the graph of the function.
A) Down on both sides
B) Up on left side, down on right side
C) Down on left side, up on right side
D) Up on both sides
A) Down on both sides
B) Up on left side, down on right side
C) Down on left side, up on right side
D) Up on both sides
سؤال
Match the polynomial function with the graph.
سؤال
Determine a window that will provide a comprehensive graph of the polynomial function.

سؤال
Predict the end behavior of the graph of the function.
A) Down on left side, up on right side
B) Up on left side, down on right side
C) Down on both sides
D) Up on both sides
A) Down on left side, up on right side
B) Up on left side, down on right side
C) Down on both sides
D) Up on both sides
سؤال
State the degree and leading coefficient of the polynomial function.
سؤال
Choose the graph that satisfies the given conditions.
Degree 4 with four x s and a negative leading coefficient
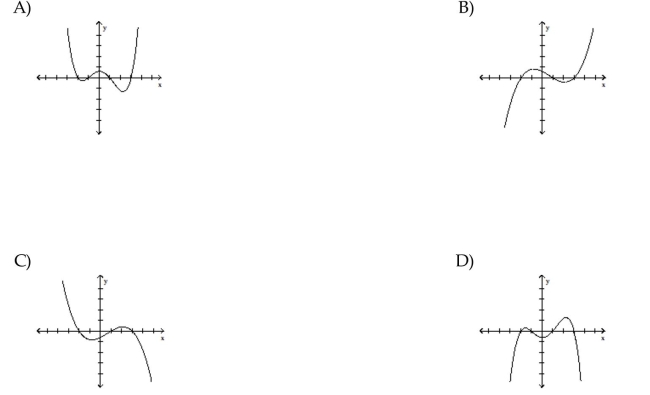
Degree 4 with four x
s and a negative leading coefficient سؤال
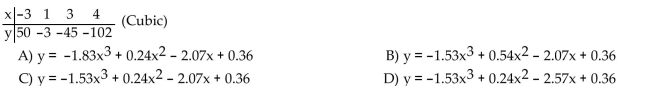
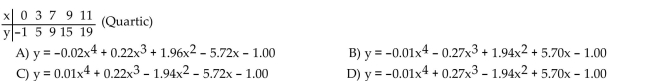
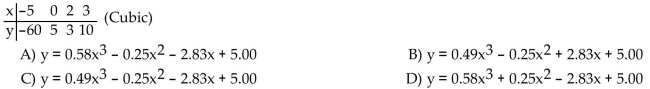
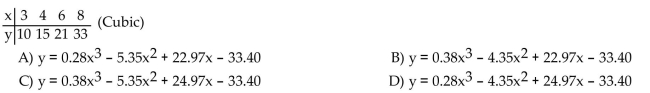
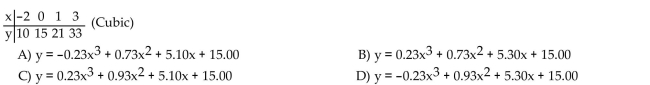
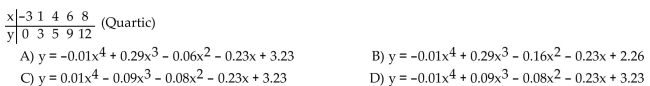
Find the cubic or quartic function that models the data in the table.
سؤال
سؤال
Use a graphing calculator to estimate the local maximum and local minimum values of the function to the nearest
hundredth.

hundredth.
سؤال
Use a graphing calculator to estimate the local maximum and local minimum values of the function to the nearest
hundredth.
The polynomial measures the concentration of a dye in the bloodstream x seconds after it is injected. Does the concentration increase between 12 and 13 seconds?
A) No
B) Yes
hundredth.
The polynomial
measures the concentration of a dye in the bloodstream x seconds after it is injected. Does the concentration increase between 12 and 13 seconds?A) No
B) Yes
سؤال
 5 is an approximation of the total profit (in thousands of dollars) from the sale of x hundred thousand tires. Find the number of hundred thousands of tires that must be sold to maximize
Profit.
A) 5.5 hundred thousand
B) 5 hundred thousand
C) 4 hundred thousand
D) 4.5 hundred thousand
سؤال
Find the cubic or quartic function that models the data in the table.
سؤال
سؤال
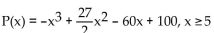
Suppose that the population of a certain city during a certain time period can be approximated by 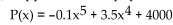 , where x is time in years since 2010. By sketching a graph of P(x), estimate during what time period the population of the city would be increasing.
A) Between 2010 and 2024
B) Between 2015 and 2045
C) Between 2015 and 2038
D) Between 2010 and 2038
, where x is time in years since 2010. By sketching a graph of P(x), estimate during what time period the population of the city would be increasing.A) Between 2010 and 2024
B) Between 2015 and 2045
C) Between 2015 and 2038
D) Between 2010 and 2038
سؤال
Ariel, a marine biologist, models a population P of crabs, t days after being left to reproduce, with the function  . Assuming that this model continues to be accurate, when will this population become extinct? (Round to the nearest day.)
A) 707 days
B) 911 days
C) 1512 days
D) 547 days
. Assuming that this model continues to be accurate, when will this population become extinct? (Round to the nearest day.)A) 707 days
B) 911 days
C) 1512 days
D) 547 days
سؤال
Use a graphing calculator to estimate the local maximum and local minimum values of the function to the nearest
hundredth.
The polynomial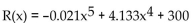 approximates the shark population in a particular area, where x is the number of years from 1985. Use a graphing calculator to describe the shark population from the years
1985 to 2010.
A) The population decreases.
B) The population increases.
C) The population remains stable.
hundredth.
The polynomial
approximates the shark population in a particular area, where x is the number of years from 1985. Use a graphing calculator to describe the shark population from the years1985 to 2010.
A) The population decreases.
B) The population increases.
C) The population remains stable.
سؤال
Use a graphing calculator to estimate the local maximum and local minimum values of the function to the nearest
hundredth.

hundredth.
سؤال
Choose the graph that satisfies the given conditions.
Polynomial of degree 4 with two distinc s and a negative leading coefficient
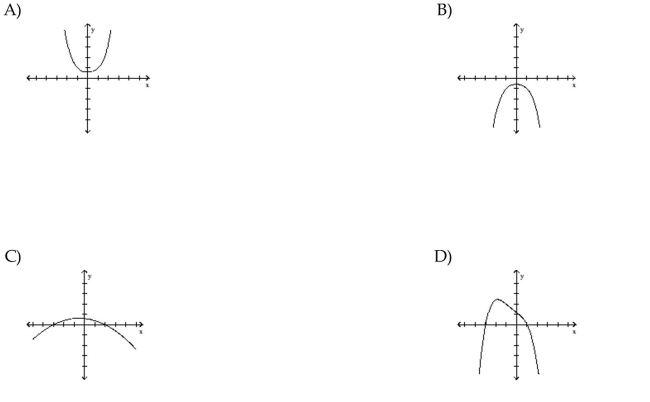
Polynomial of degree 4 with two distinc
s and a negative leading coefficient سؤال
Choose the graph that satisfies the given conditions.
Quartic polynomial with one x intercept and a positive leading coefficient
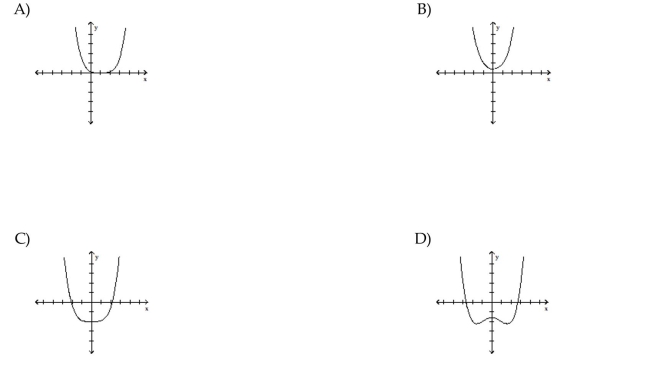
Quartic polynomial with one x
intercept and a positive leading coefficient سؤال
Find the cubic or quartic function that models the data in the table.
سؤال
Find the cubic or quartic function that models the data in the table.
سؤال
Find the cubic or quartic function that models the data in the table.
سؤال
A population of birds in a small county can be modeled by the polynomial 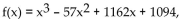 where x=1 corresponds to July 1, x=2 to July 2 , and so on. On what day does f estimate the population to be 8550 ?
A) July 13 th
B) July 12 th
C) July 11 th
D) July 14th
where x=1 corresponds to July 1, x=2 to July 2 , and so on. On what day does f estimate the population to be 8550 ? A) July 13 th
B) July 12 th
C) July 11 th
D) July 14th
سؤال
Choose the graph that satisfies the given conditions.
Degree 3 with one x intercept and a positive leading coefficient
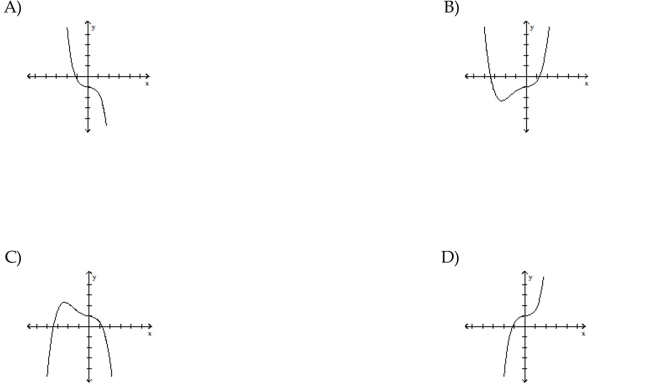
Degree 3 with one x
intercept and a positive leading coefficient سؤال
 0 is an approximation of the number of salmon swimming upstream to spawn, where x represents the water temperature in degrees Celsius. Find the temperature that produces the
Maximum number of salmon.

سؤال
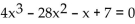
Solve the polynomial equation.

سؤال
A) 1,-1,7
B)

C) 2,-2,7
D)

سؤال
The table shows the number of dollars spent in Country X (in millions) on environmental protection programs during the years 2000(x=1) through 2010(x=11) . Find the cubic model that is the best fit for this data. Round coefficients to three decimal places.
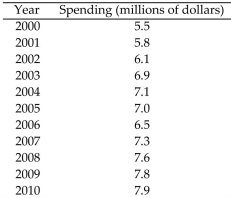
A)
B)
C)
D)
A)
B)
C)
D)
سؤال
Solve the polynomial equation by factoring.

سؤال
Solve the polynomial equation by factoring.

سؤال
The table below gives the violent crime rate (per 100,000 people) for a particular state every five years from 1970 to 2010. 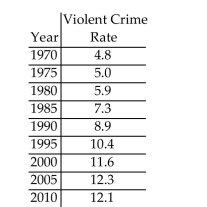 Use technology to find the cubic function that is the best fit for this data, where x is the number of years after 1970. Round to five decimal places.
Use technology to find the cubic function that is the best fit for this data, where x is the number of years after 1970. Round to five decimal places. سؤال

A) 6,-6
B) 9,-9
C) 3,-3
D) 18,-18
سؤال
Solve the polynomial equation by factoring.

سؤال
The table below gives the number of births, in thousands, to females over the age of 35 for a particular state every two years from 1994 to 2010. 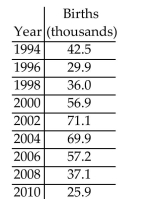 Use technology to find the quartic function that is the best fit for this data, where x is the number of years after 1994.
Round to five decimal places.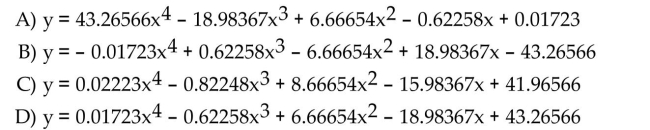
Use technology to find the quartic function that is the best fit for this data, where x is the number of years after 1994.Round to five decimal places.
سؤال
Solve the polynomial equation.

سؤال
Find the cubic or quartic function that models the data in the table.
سؤال
The table below gives the violent crime rate (per 100,000 people) for a particular state every five years from 1970 to 2010. 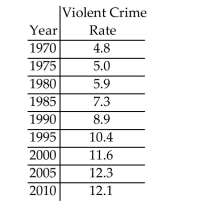 Use technology to find the cubic function that is the best fit for this data, where x is the number of years after 1970. Use the model to estimate the violent crime rate for the year 2014.
A) 11.6
B) 11.4
C) 11.8
D) 11
Use technology to find the cubic function that is the best fit for this data, where x is the number of years after 1970. Use the model to estimate the violent crime rate for the year 2014.A) 11.6
B) 11.4
C) 11.8
D) 11
سؤال
Solve the polynomial equation by factoring.

سؤال
Solve the polynomial equation.

سؤال
Solve the polynomial equation by factoring.

سؤال
The table below gives the number of births, in thousands, to females over the age of 35 for a particular state every two years from 1994 to 2010. 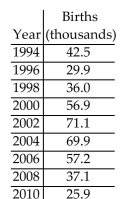 Use technology to find the quartic function that is the best fit for this data, where x is the number of years after 1994.
According to the model, how many births were there to females over the age of 35 in this state in 2014?
A) 106,368
B) 108,868
C) 94,368
D) 101,318
Use technology to find the quartic function that is the best fit for this data, where x is the number of years after 1994.According to the model, how many births were there to females over the age of 35 in this state in 2014?
A) 106,368
B) 108,868
C) 94,368
D) 101,318
سؤال
The table below gives the number of births, in thousands, to females over the age of 35 for a particular state every two years from 1994 to 2010. 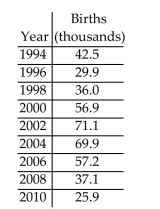 Use technology to find the quartic function that is the best fit for this data, where x is the number of years after 1994.
According to the model, when will the number of births to females over the age of 35 first reach 80,000?
A) 2015
B) 2014
C) 2016
D) 2013
Use technology to find the quartic function that is the best fit for this data, where x is the number of years after 1994.According to the model, when will the number of births to females over the age of 35 first reach 80,000?
A) 2015
B) 2014
C) 2016
D) 2013
سؤال
The table below gives the violent crime rate (per 100,000 people) for a particular state every five years from 1970 to 2010. 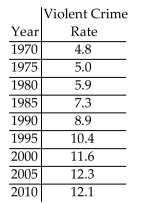 Use technology to find the cubic function that is the best fit for this data, where x is the number of years after 1970. Use the model to estimate the year having a violent crime rate of 11.4 per 100,000.
A) 2012
B) 2016
C) 2011
D) 2014
Use technology to find the cubic function that is the best fit for this data, where x is the number of years after 1970. Use the model to estimate the year having a violent crime rate of 11.4 per 100,000.A) 2012
B) 2016
C) 2011
D) 2014
سؤال
Solve the polynomial equation by factoring.

سؤال
A)

B)

C)

D)


فتح الحزمة
قم بالتسجيل لفتح البطاقات في هذه المجموعة!
Unlock Deck
Unlock Deck
1/262
العب
ملء الشاشة (f)
Deck 6: Higher-Degree Polynomial and Rational Functions
1
Determine whether the polynomial function is cubic or quartic.
A) Cubic
B) Quartic
A) Cubic
B) Quartic
A
2
Use the given graph of the polynomial function to estimate the x-intercepts.
A)
В)
C)
D)
A)
В)
C)
D)
C
3
A) [-10,5] by [-300,300]
B) [-30,80] by [-8000,4000]
C) [-10,10] by [-10,10]
D) [-5,10] by [-100,300]
B
4
Determine whether the polynomial function is cubic or quartic.
A) Cubic
B) Quartic
A) Cubic
B) Quartic
فتح الحزمة
افتح القفل للوصول البطاقات البالغ عددها 262 في هذه المجموعة.
فتح الحزمة
k this deck
5
A) [-3,3] by [-3,4]
B) [-2,2] by [-10,-5]
C) [-3,3] by [-10,5]
D) [-5,5] by [-2,1]
فتح الحزمة
افتح القفل للوصول البطاقات البالغ عددها 262 في هذه المجموعة.
فتح الحزمة
k this deck
6
A) [-10,10] by [-10,10]
B) [-6,6] by [-10,200]
C) [-10,10] by [-100,100]
D) [-3,3] by [-10,30]
فتح الحزمة
افتح القفل للوصول البطاقات البالغ عددها 262 في هذه المجموعة.
فتح الحزمة
k this deck
7
A) [-5000,5000] by [-150,150]
B) [-10,10] by [-1200,2000]
C) [-6,6] by [-3000,3000]
D) [-20,20] by [-5000,8000]
فتح الحزمة
افتح القفل للوصول البطاقات البالغ عددها 262 في هذه المجموعة.
فتح الحزمة
k this deck
8
Use the given graph of the polynomial function to state whether the leading coefficient is positive or negative and
whether the polynomial function is cubic or quartic.
A) Positive; Cubic
B) Negative; Quartic
C) Positive; Quartic
D) Negative; Cubic
whether the polynomial function is cubic or quartic.
A) Positive; Cubic
B) Negative; Quartic
C) Positive; Quartic
D) Negative; Cubic
فتح الحزمة
افتح القفل للوصول البطاقات البالغ عددها 262 في هذه المجموعة.
فتح الحزمة
k this deck
9
Determine whether the polynomial function is cubic or quartic.
A) Quartic
B) Cubic
A) Quartic
B) Cubic
فتح الحزمة
افتح القفل للوصول البطاقات البالغ عددها 262 في هذه المجموعة.
فتح الحزمة
k this deck
10
Use the given graph of the polynomial function to estimate the x-intercepts.
A)
B)
C)
D)
A)
B)
C)
D)
فتح الحزمة
افتح القفل للوصول البطاقات البالغ عددها 262 في هذه المجموعة.
فتح الحزمة
k this deck
11
Match the polynomial function with the graph.
فتح الحزمة
افتح القفل للوصول البطاقات البالغ عددها 262 في هذه المجموعة.
فتح الحزمة
k this deck
12
Use the given graph of the polynomial function to state whether the leading coefficient is positive or negative and
whether the polynomial function is cubic or quartic.
A) Negative; Cubic
B) Positive; Cubic
C) Negative; Quartic
D) Positive; Quartic
whether the polynomial function is cubic or quartic.
A) Negative; Cubic
B) Positive; Cubic
C) Negative; Quartic
D) Positive; Quartic
فتح الحزمة
افتح القفل للوصول البطاقات البالغ عددها 262 في هذه المجموعة.
فتح الحزمة
k this deck
13
Use the given graph of the polynomial function to state whether the leading coefficient is positive or negative and
whether the polynomial function is cubic or quartic.
A) Negative; Quartic
B) Positive; Cubic
C) Negative; Cubic
D) Positive; Quartic
whether the polynomial function is cubic or quartic.
A) Negative; Quartic
B) Positive; Cubic
C) Negative; Cubic
D) Positive; Quartic
فتح الحزمة
افتح القفل للوصول البطاقات البالغ عددها 262 في هذه المجموعة.
فتح الحزمة
k this deck
14
Use the given graph of the polynomial function to state whether the leading coefficient is positive or negative and
whether the polynomial function is cubic or quartic.
A) Negative; Cubic
B) Negative; Quartic
C) Positive; Quartic
D) Positive; Cubic
whether the polynomial function is cubic or quartic.
A) Negative; Cubic
B) Negative; Quartic
C) Positive; Quartic
D) Positive; Cubic
فتح الحزمة
افتح القفل للوصول البطاقات البالغ عددها 262 في هذه المجموعة.
فتح الحزمة
k this deck
15
Use the given graph of the polynomial function to estimate the x-intercepts.
A)
B)
C)
D)
A)
B)
C)
D)
فتح الحزمة
افتح القفل للوصول البطاقات البالغ عددها 262 في هذه المجموعة.
فتح الحزمة
k this deck
16
A) [-5,5] by [-500,100]
B) [-8,10] by [-100,300]
C) [-3,10] by [-400,100]
D) [-10,10] by [-150,150]
فتح الحزمة
افتح القفل للوصول البطاقات البالغ عددها 262 في هذه المجموعة.
فتح الحزمة
k this deck
17
Use the given graph of the polynomial function to state whether the leading coefficient is positive or negative and
whether the polynomial function is cubic or quartic.
A) Positive; Quartic
B) Negative; Cubic
C) Positive; Cubic
D) Negative; Quartic
whether the polynomial function is cubic or quartic.
A) Positive; Quartic
B) Negative; Cubic
C) Positive; Cubic
D) Negative; Quartic
فتح الحزمة
افتح القفل للوصول البطاقات البالغ عددها 262 في هذه المجموعة.
فتح الحزمة
k this deck
18
A) [-2,8] by [-250,150]
B) [-5,5] by [-200,50]
C) [-100,100] by [-10,10]
D) [-6,6] by [-50,100]
فتح الحزمة
افتح القفل للوصول البطاقات البالغ عددها 262 في هذه المجموعة.
فتح الحزمة
k this deck
19
Use the given graph of the polynomial function to state whether the leading coefficient is positive or negative and
whether the polynomial function is cubic or quartic.
A) Positive; Cubic
B) Negative; Cubic
C) Negative; Quartic
D) Positive; Quartic
whether the polynomial function is cubic or quartic.
A) Positive; Cubic
B) Negative; Cubic
C) Negative; Quartic
D) Positive; Quartic
فتح الحزمة
افتح القفل للوصول البطاقات البالغ عددها 262 في هذه المجموعة.
فتح الحزمة
k this deck
20
Determine whether the polynomial function is cubic or quartic.
A) Quartic
B) Cubic
A) Quartic
B) Cubic
فتح الحزمة
افتح القفل للوصول البطاقات البالغ عددها 262 في هذه المجموعة.
فتح الحزمة
k this deck
21
State the degree and leading coefficient of the polynomial function.
فتح الحزمة
افتح القفل للوصول البطاقات البالغ عددها 262 في هذه المجموعة.
فتح الحزمة
k this deck
22
State the degree and leading coefficient of the polynomial function.
فتح الحزمة
افتح القفل للوصول البطاقات البالغ عددها 262 في هذه المجموعة.
فتح الحزمة
k this deck
23
Predict the end behavior of the graph of the function.
A) Up on left side, down on right side
B) Down on left side, up on right side
C) Up on both sides
D) Down on both sides
A) Up on left side, down on right side
B) Down on left side, up on right side
C) Up on both sides
D) Down on both sides
فتح الحزمة
افتح القفل للوصول البطاقات البالغ عددها 262 في هذه المجموعة.
فتح الحزمة
k this deck
24
Match the polynomial function with the graph.
فتح الحزمة
افتح القفل للوصول البطاقات البالغ عددها 262 في هذه المجموعة.
فتح الحزمة
k this deck
25
Match the polynomial function with the graph.
فتح الحزمة
افتح القفل للوصول البطاقات البالغ عددها 262 في هذه المجموعة.
فتح الحزمة
k this deck
26
State the degree and leading coefficient of the polynomial function.
A) Degree: 6; leading coefficient: 16
B) Degree: 5; leading coefficient: 16
C) Degree: 16; leading coefficient: 4
D) Degree: 4; leading coefficient: 16
A) Degree: 6; leading coefficient: 16
B) Degree: 5; leading coefficient: 16
C) Degree: 16; leading coefficient: 4
D) Degree: 4; leading coefficient: 16
فتح الحزمة
افتح القفل للوصول البطاقات البالغ عددها 262 في هذه المجموعة.
فتح الحزمة
k this deck
27
State the degree and leading coefficient of the polynomial function.
فتح الحزمة
افتح القفل للوصول البطاقات البالغ عددها 262 في هذه المجموعة.
فتح الحزمة
k this deck
28
State the degree and leading coefficient of the polynomial function.
فتح الحزمة
افتح القفل للوصول البطاقات البالغ عددها 262 في هذه المجموعة.
فتح الحزمة
k this deck
29
Determine a window that will provide a comprehensive graph of the polynomial function.
فتح الحزمة
افتح القفل للوصول البطاقات البالغ عددها 262 في هذه المجموعة.
فتح الحزمة
k this deck
30
State the degree and leading coefficient of the polynomial function.
A) Degree: 14; leading coefficient: 4
B) Degree: 8; leading coefficient: 14
C) Degree: 7; leading coefficient: 14
D) Degree: 4; leading coefficient: 14
A) Degree: 14; leading coefficient: 4
B) Degree: 8; leading coefficient: 14
C) Degree: 7; leading coefficient: 14
D) Degree: 4; leading coefficient: 14
فتح الحزمة
افتح القفل للوصول البطاقات البالغ عددها 262 في هذه المجموعة.
فتح الحزمة
k this deck
31
Match the polynomial function with the graph.
فتح الحزمة
افتح القفل للوصول البطاقات البالغ عددها 262 في هذه المجموعة.
فتح الحزمة
k this deck
32
Predict the end behavior of the graph of the function.
A) Down on both sides
B) Up on the right side, down on the left side
C) Up on both sides
D) Down on the right side, up on the left side
A) Down on both sides
B) Up on the right side, down on the left side
C) Up on both sides
D) Down on the right side, up on the left side
فتح الحزمة
افتح القفل للوصول البطاقات البالغ عددها 262 في هذه المجموعة.
فتح الحزمة
k this deck
33
Choose the graph that satisfies the given conditions.
Polynomial of degree 3 with three distinct x nd a positive leading coefficient
Polynomial of degree 3 with three distinct x
nd a positive leading coefficient فتح الحزمة
افتح القفل للوصول البطاقات البالغ عددها 262 في هذه المجموعة.
فتح الحزمة
k this deck
34
Match the polynomial function with the graph.
فتح الحزمة
افتح القفل للوصول البطاقات البالغ عددها 262 في هذه المجموعة.
فتح الحزمة
k this deck
35
Predict the end behavior of the graph of the function.
A) Down on both sides
B) Up on both sides
C) Down on the right side, up on the left side
D) Up on the right side, down on the left side
A) Down on both sides
B) Up on both sides
C) Down on the right side, up on the left side
D) Up on the right side, down on the left side
فتح الحزمة
افتح القفل للوصول البطاقات البالغ عددها 262 في هذه المجموعة.
فتح الحزمة
k this deck
36
Predict the end behavior of the graph of the function.
A) Down on both sides
B) Up on left side, down on right side
C) Down on left side, up on right side
D) Up on both sides
A) Down on both sides
B) Up on left side, down on right side
C) Down on left side, up on right side
D) Up on both sides
فتح الحزمة
افتح القفل للوصول البطاقات البالغ عددها 262 في هذه المجموعة.
فتح الحزمة
k this deck
37
Match the polynomial function with the graph.
فتح الحزمة
افتح القفل للوصول البطاقات البالغ عددها 262 في هذه المجموعة.
فتح الحزمة
k this deck
38
Determine a window that will provide a comprehensive graph of the polynomial function.
فتح الحزمة
افتح القفل للوصول البطاقات البالغ عددها 262 في هذه المجموعة.
فتح الحزمة
k this deck
39
Predict the end behavior of the graph of the function.
A) Down on left side, up on right side
B) Up on left side, down on right side
C) Down on both sides
D) Up on both sides
A) Down on left side, up on right side
B) Up on left side, down on right side
C) Down on both sides
D) Up on both sides
فتح الحزمة
افتح القفل للوصول البطاقات البالغ عددها 262 في هذه المجموعة.
فتح الحزمة
k this deck
40
State the degree and leading coefficient of the polynomial function.
فتح الحزمة
افتح القفل للوصول البطاقات البالغ عددها 262 في هذه المجموعة.
فتح الحزمة
k this deck
41
Choose the graph that satisfies the given conditions.
Degree 4 with four x s and a negative leading coefficient
Degree 4 with four x
s and a negative leading coefficient فتح الحزمة
افتح القفل للوصول البطاقات البالغ عددها 262 في هذه المجموعة.
فتح الحزمة
k this deck
42
Find the cubic or quartic function that models the data in the table.
فتح الحزمة
افتح القفل للوصول البطاقات البالغ عددها 262 في هذه المجموعة.
فتح الحزمة
k this deck
43
Find the cubic or quartic function that models the data in the table.
-
A)
B)
C)
D)
-
A)
B)
C)
D)
فتح الحزمة
افتح القفل للوصول البطاقات البالغ عددها 262 في هذه المجموعة.
فتح الحزمة
k this deck
44
Use a graphing calculator to estimate the local maximum and local minimum values of the function to the nearest
hundredth.
hundredth.
فتح الحزمة
افتح القفل للوصول البطاقات البالغ عددها 262 في هذه المجموعة.
فتح الحزمة
k this deck
45
Use a graphing calculator to estimate the local maximum and local minimum values of the function to the nearest
hundredth.
The polynomial measures the concentration of a dye in the bloodstream x seconds after it is injected. Does the concentration increase between 12 and 13 seconds?
A) No
B) Yes
hundredth.
The polynomial
measures the concentration of a dye in the bloodstream x seconds after it is injected. Does the concentration increase between 12 and 13 seconds?A) No
B) Yes
فتح الحزمة
افتح القفل للوصول البطاقات البالغ عددها 262 في هذه المجموعة.
فتح الحزمة
k this deck
46
5 is an approximation of the total profit (in thousands of dollars) from the sale of x hundred thousand tires. Find the number of hundred thousands of tires that must be sold to maximizeProfit.
A) 5.5 hundred thousand
B) 5 hundred thousand
C) 4 hundred thousand
D) 4.5 hundred thousand
فتح الحزمة
افتح القفل للوصول البطاقات البالغ عددها 262 في هذه المجموعة.
فتح الحزمة
k this deck
47
Find the cubic or quartic function that models the data in the table.
فتح الحزمة
افتح القفل للوصول البطاقات البالغ عددها 262 في هذه المجموعة.
فتح الحزمة
k this deck
48
Use a graphing calculator to estimate the local maximum and local minimum values of the function to the nearest
hundredth.
The following polynomial approximates the rabbit population in a particular area, R(x) = -0.135x5 + 2.952x4 + 3500, where x is the number of years from 1995. Use a graphing calculator to
Describe the rabbit population from the years 1995 to 2010.
A) The population decreases.
B) The population remains stable.
C) The population increases.
فتح الحزمة
افتح القفل للوصول البطاقات البالغ عددها 262 في هذه المجموعة.
فتح الحزمة
k this deck
49
Suppose that the population of a certain city during a certain time period can be approximated by , where x is time in years since 2010. By sketching a graph of P(x), estimate during what time period the population of the city would be increasing.
A) Between 2010 and 2024
B) Between 2015 and 2045
C) Between 2015 and 2038
D) Between 2010 and 2038
, where x is time in years since 2010. By sketching a graph of P(x), estimate during what time period the population of the city would be increasing.A) Between 2010 and 2024
B) Between 2015 and 2045
C) Between 2015 and 2038
D) Between 2010 and 2038
فتح الحزمة
افتح القفل للوصول البطاقات البالغ عددها 262 في هذه المجموعة.
فتح الحزمة
k this deck
50
Ariel, a marine biologist, models a population P of crabs, t days after being left to reproduce, with the function . Assuming that this model continues to be accurate, when will this population become extinct? (Round to the nearest day.)
A) 707 days
B) 911 days
C) 1512 days
D) 547 days
. Assuming that this model continues to be accurate, when will this population become extinct? (Round to the nearest day.)A) 707 days
B) 911 days
C) 1512 days
D) 547 days
فتح الحزمة
افتح القفل للوصول البطاقات البالغ عددها 262 في هذه المجموعة.
فتح الحزمة
k this deck
51
Use a graphing calculator to estimate the local maximum and local minimum values of the function to the nearest
hundredth.
The polynomial approximates the shark population in a particular area, where x is the number of years from 1985. Use a graphing calculator to describe the shark population from the years
1985 to 2010.
A) The population decreases.
B) The population increases.
C) The population remains stable.
hundredth.
The polynomial
approximates the shark population in a particular area, where x is the number of years from 1985. Use a graphing calculator to describe the shark population from the years1985 to 2010.
A) The population decreases.
B) The population increases.
C) The population remains stable.
فتح الحزمة
افتح القفل للوصول البطاقات البالغ عددها 262 في هذه المجموعة.
فتح الحزمة
k this deck
52
Use a graphing calculator to estimate the local maximum and local minimum values of the function to the nearest
hundredth.
hundredth.
فتح الحزمة
افتح القفل للوصول البطاقات البالغ عددها 262 في هذه المجموعة.
فتح الحزمة
k this deck
53
Choose the graph that satisfies the given conditions.
Polynomial of degree 4 with two distinc s and a negative leading coefficient
Polynomial of degree 4 with two distinc
s and a negative leading coefficient فتح الحزمة
افتح القفل للوصول البطاقات البالغ عددها 262 في هذه المجموعة.
فتح الحزمة
k this deck
54
Choose the graph that satisfies the given conditions.
Quartic polynomial with one x intercept and a positive leading coefficient
Quartic polynomial with one x
intercept and a positive leading coefficient فتح الحزمة
افتح القفل للوصول البطاقات البالغ عددها 262 في هذه المجموعة.
فتح الحزمة
k this deck
55
Find the cubic or quartic function that models the data in the table.
فتح الحزمة
افتح القفل للوصول البطاقات البالغ عددها 262 في هذه المجموعة.
فتح الحزمة
k this deck
56
Find the cubic or quartic function that models the data in the table.
فتح الحزمة
افتح القفل للوصول البطاقات البالغ عددها 262 في هذه المجموعة.
فتح الحزمة
k this deck
57
Find the cubic or quartic function that models the data in the table.
فتح الحزمة
افتح القفل للوصول البطاقات البالغ عددها 262 في هذه المجموعة.
فتح الحزمة
k this deck
58
A population of birds in a small county can be modeled by the polynomial where x=1 corresponds to July 1, x=2 to July 2 , and so on. On what day does f estimate the population to be 8550 ?
A) July 13 th
B) July 12 th
C) July 11 th
D) July 14th
where x=1 corresponds to July 1, x=2 to July 2 , and so on. On what day does f estimate the population to be 8550 ? A) July 13 th
B) July 12 th
C) July 11 th
D) July 14th
فتح الحزمة
افتح القفل للوصول البطاقات البالغ عددها 262 في هذه المجموعة.
فتح الحزمة
k this deck
59
Choose the graph that satisfies the given conditions.
Degree 3 with one x intercept and a positive leading coefficient
Degree 3 with one x
intercept and a positive leading coefficient فتح الحزمة
افتح القفل للوصول البطاقات البالغ عددها 262 في هذه المجموعة.
فتح الحزمة
k this deck
60
0 is an approximation of the number of salmon swimming upstream to spawn, where x represents the water temperature in degrees Celsius. Find the temperature that produces theMaximum number of salmon.
فتح الحزمة
افتح القفل للوصول البطاقات البالغ عددها 262 في هذه المجموعة.
فتح الحزمة
k this deck
61
Solve the polynomial equation.
فتح الحزمة
افتح القفل للوصول البطاقات البالغ عددها 262 في هذه المجموعة.
فتح الحزمة
k this deck
62
A) 1,-1,7
B)
C) 2,-2,7
D)
فتح الحزمة
افتح القفل للوصول البطاقات البالغ عددها 262 في هذه المجموعة.
فتح الحزمة
k this deck
63
The table shows the number of dollars spent in Country X (in millions) on environmental protection programs during the years 2000(x=1) through 2010(x=11) . Find the cubic model that is the best fit for this data. Round coefficients to three decimal places.
A)
B)
C)
D)
A)
B)
C)
D)
فتح الحزمة
افتح القفل للوصول البطاقات البالغ عددها 262 في هذه المجموعة.
فتح الحزمة
k this deck
64
Solve the polynomial equation by factoring.
فتح الحزمة
افتح القفل للوصول البطاقات البالغ عددها 262 في هذه المجموعة.
فتح الحزمة
k this deck
65
Solve the polynomial equation by factoring.
فتح الحزمة
افتح القفل للوصول البطاقات البالغ عددها 262 في هذه المجموعة.
فتح الحزمة
k this deck
66
The table below gives the violent crime rate (per 100,000 people) for a particular state every five years from 1970 to 2010. Use technology to find the cubic function that is the best fit for this data, where x is the number of years after 1970. Round to five decimal places.
Use technology to find the cubic function that is the best fit for this data, where x is the number of years after 1970. Round to five decimal places. فتح الحزمة
افتح القفل للوصول البطاقات البالغ عددها 262 في هذه المجموعة.
فتح الحزمة
k this deck
67
A) 6,-6
B) 9,-9
C) 3,-3
D) 18,-18
فتح الحزمة
افتح القفل للوصول البطاقات البالغ عددها 262 في هذه المجموعة.
فتح الحزمة
k this deck
68
Solve the polynomial equation by factoring.
فتح الحزمة
افتح القفل للوصول البطاقات البالغ عددها 262 في هذه المجموعة.
فتح الحزمة
k this deck
69
The table below gives the number of births, in thousands, to females over the age of 35 for a particular state every two years from 1994 to 2010. Use technology to find the quartic function that is the best fit for this data, where x is the number of years after 1994.
Round to five decimal places.
Use technology to find the quartic function that is the best fit for this data, where x is the number of years after 1994.Round to five decimal places.
فتح الحزمة
افتح القفل للوصول البطاقات البالغ عددها 262 في هذه المجموعة.
فتح الحزمة
k this deck
70
Solve the polynomial equation.
فتح الحزمة
افتح القفل للوصول البطاقات البالغ عددها 262 في هذه المجموعة.
فتح الحزمة
k this deck
71
Find the cubic or quartic function that models the data in the table.
فتح الحزمة
افتح القفل للوصول البطاقات البالغ عددها 262 في هذه المجموعة.
فتح الحزمة
k this deck
72
The table below gives the violent crime rate (per 100,000 people) for a particular state every five years from 1970 to 2010. Use technology to find the cubic function that is the best fit for this data, where x is the number of years after 1970. Use the model to estimate the violent crime rate for the year 2014.
A) 11.6
B) 11.4
C) 11.8
D) 11
Use technology to find the cubic function that is the best fit for this data, where x is the number of years after 1970. Use the model to estimate the violent crime rate for the year 2014.A) 11.6
B) 11.4
C) 11.8
D) 11
فتح الحزمة
افتح القفل للوصول البطاقات البالغ عددها 262 في هذه المجموعة.
فتح الحزمة
k this deck
73
Solve the polynomial equation by factoring.
فتح الحزمة
افتح القفل للوصول البطاقات البالغ عددها 262 في هذه المجموعة.
فتح الحزمة
k this deck
74
Solve the polynomial equation.
فتح الحزمة
افتح القفل للوصول البطاقات البالغ عددها 262 في هذه المجموعة.
فتح الحزمة
k this deck
75
Solve the polynomial equation by factoring.
فتح الحزمة
افتح القفل للوصول البطاقات البالغ عددها 262 في هذه المجموعة.
فتح الحزمة
k this deck
76
The table below gives the number of births, in thousands, to females over the age of 35 for a particular state every two years from 1994 to 2010. Use technology to find the quartic function that is the best fit for this data, where x is the number of years after 1994.
According to the model, how many births were there to females over the age of 35 in this state in 2014?
A) 106,368
B) 108,868
C) 94,368
D) 101,318
Use technology to find the quartic function that is the best fit for this data, where x is the number of years after 1994.According to the model, how many births were there to females over the age of 35 in this state in 2014?
A) 106,368
B) 108,868
C) 94,368
D) 101,318
فتح الحزمة
افتح القفل للوصول البطاقات البالغ عددها 262 في هذه المجموعة.
فتح الحزمة
k this deck
77
The table below gives the number of births, in thousands, to females over the age of 35 for a particular state every two years from 1994 to 2010. Use technology to find the quartic function that is the best fit for this data, where x is the number of years after 1994.
According to the model, when will the number of births to females over the age of 35 first reach 80,000?
A) 2015
B) 2014
C) 2016
D) 2013
Use technology to find the quartic function that is the best fit for this data, where x is the number of years after 1994.According to the model, when will the number of births to females over the age of 35 first reach 80,000?
A) 2015
B) 2014
C) 2016
D) 2013
فتح الحزمة
افتح القفل للوصول البطاقات البالغ عددها 262 في هذه المجموعة.
فتح الحزمة
k this deck
78
The table below gives the violent crime rate (per 100,000 people) for a particular state every five years from 1970 to 2010. Use technology to find the cubic function that is the best fit for this data, where x is the number of years after 1970. Use the model to estimate the year having a violent crime rate of 11.4 per 100,000.
A) 2012
B) 2016
C) 2011
D) 2014
Use technology to find the cubic function that is the best fit for this data, where x is the number of years after 1970. Use the model to estimate the year having a violent crime rate of 11.4 per 100,000.A) 2012
B) 2016
C) 2011
D) 2014
فتح الحزمة
افتح القفل للوصول البطاقات البالغ عددها 262 في هذه المجموعة.
فتح الحزمة
k this deck
79
Solve the polynomial equation by factoring.
فتح الحزمة
افتح القفل للوصول البطاقات البالغ عددها 262 في هذه المجموعة.
فتح الحزمة
k this deck
80
A)
B)
C)
D)
فتح الحزمة
افتح القفل للوصول البطاقات البالغ عددها 262 في هذه المجموعة.
فتح الحزمة
k this deck
فتح الحزمة
افتح القفل للوصول البطاقات البالغ عددها 262 في هذه المجموعة.


