Deck 4: Describing the Relation Between Two Variables
ملء الشاشة (f)
سؤال
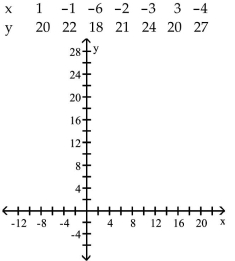
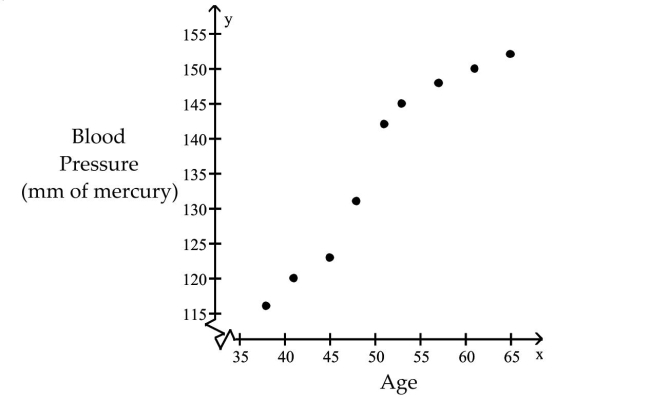
The data below are the ages and systolic blood pressures (measured in millimeters of mercury) of 9 randomlyselected adults. 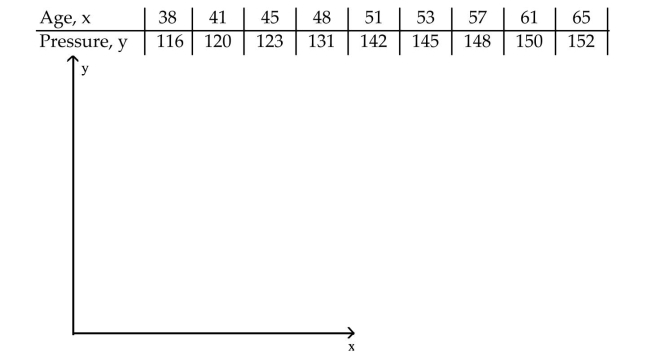
سؤال
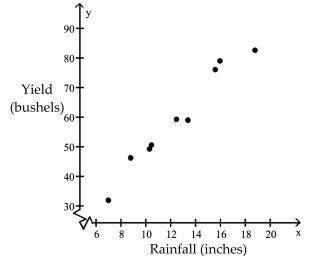
In an area of the Great Plains, records were kept on the relationship between the rainfall (in inches) and theyield of wheat (bushels per acre). 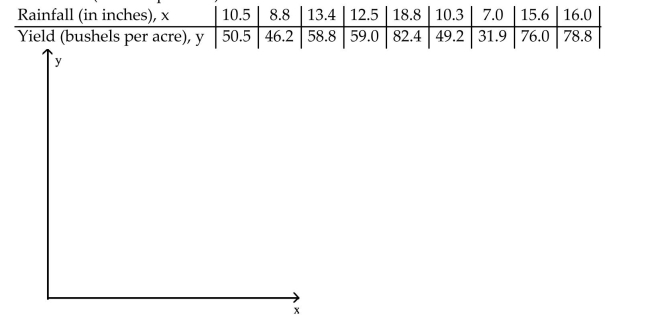
سؤال
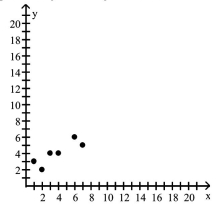
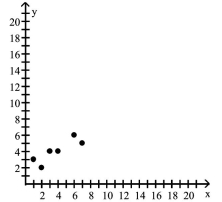
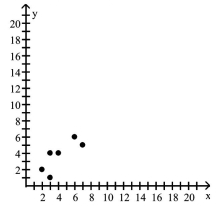
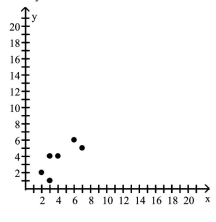
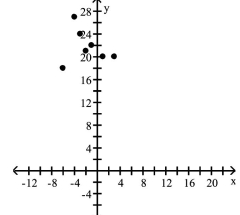
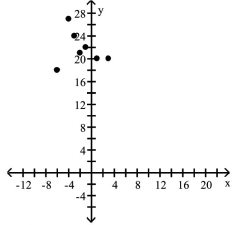
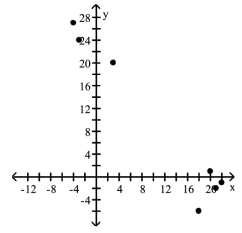
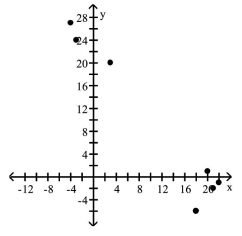
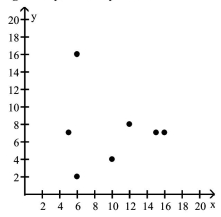
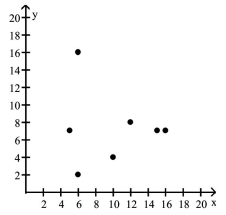
In which scatter diagram is r = 1? 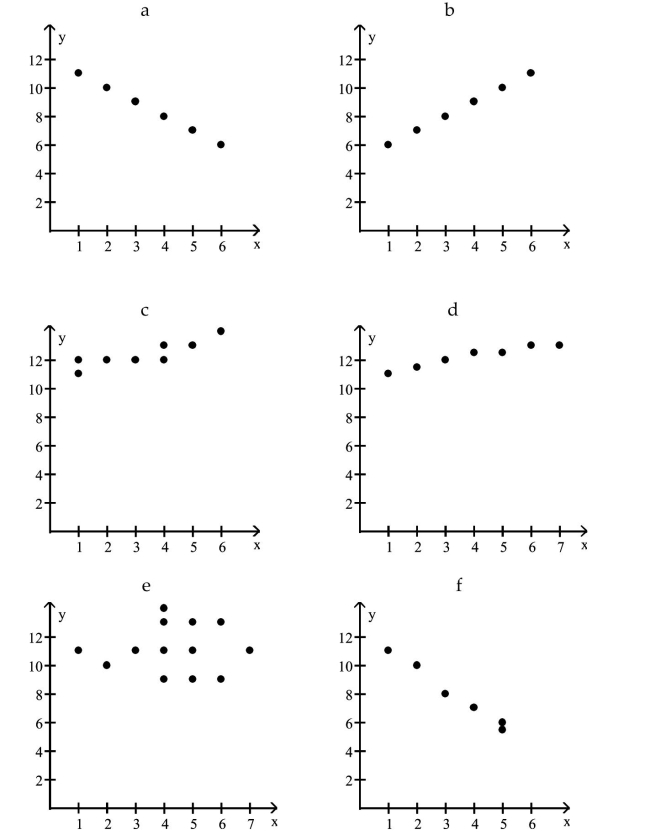
A) b
B) a
C) f
D) d
A) b
B) a
C) f
D) d
سؤال
There is a strong negative correlation between years of education and births per woman. 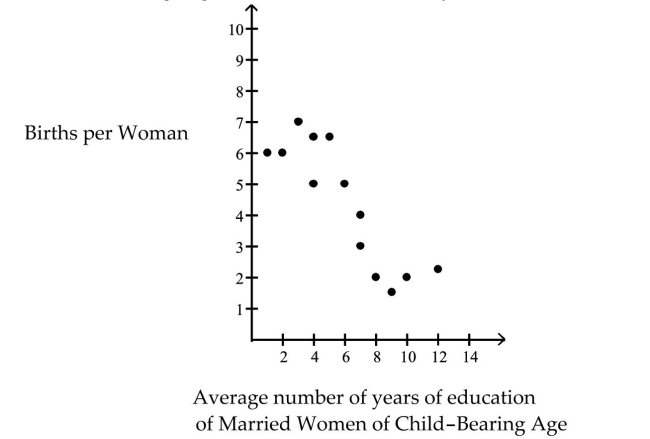
سؤال
The data below are the final exam scores of 10 randomly selected history students and the number of hoursthey studied for the exam. 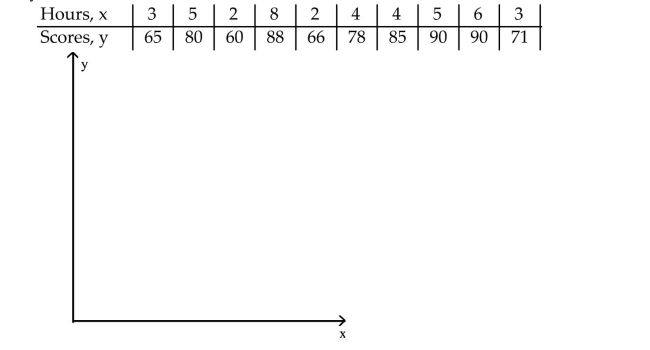
سؤال
A manager wishes to determine the relationship between the number of miles (in hundreds of miles) themanagerʹs sales representatives travel per month and the amount of sales (in thousands of dollars) per month. 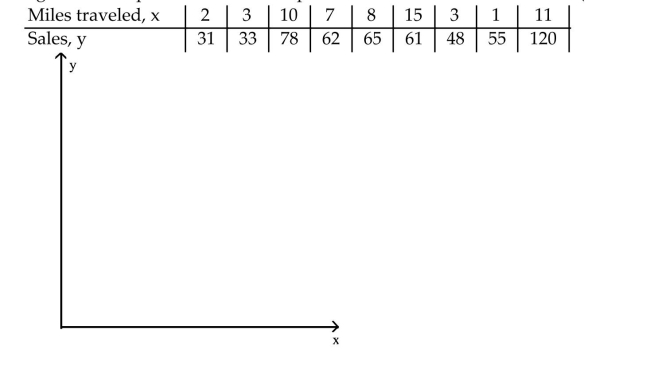
سؤال
In which scatter diagram is r = 0.01? 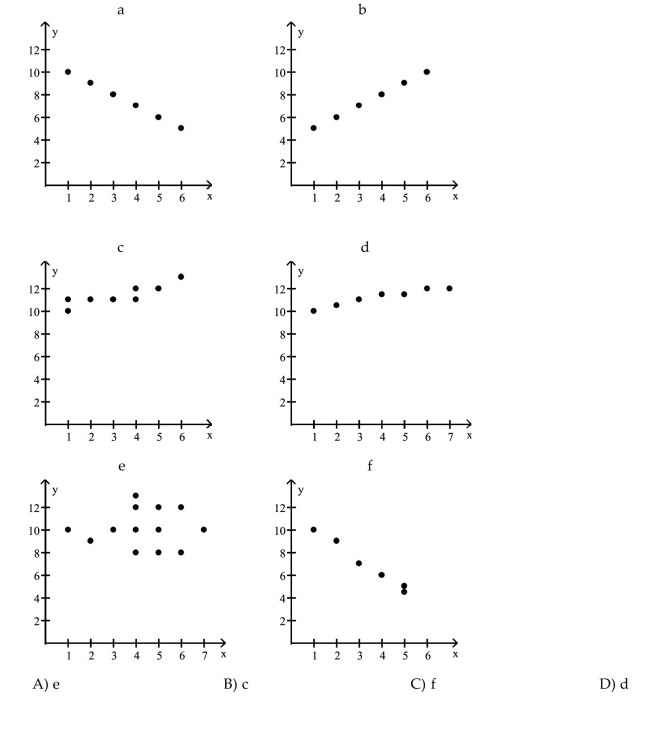
سؤال
The data below are the temperatures on randomly chosen days during a summer class and the number ofabsences on those days. 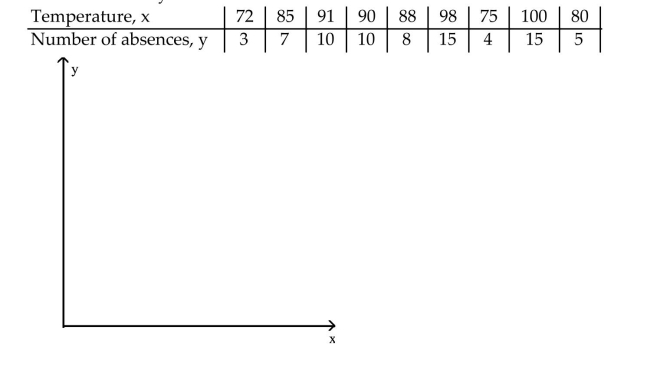
سؤال
In which scatter diagram is r = -1? 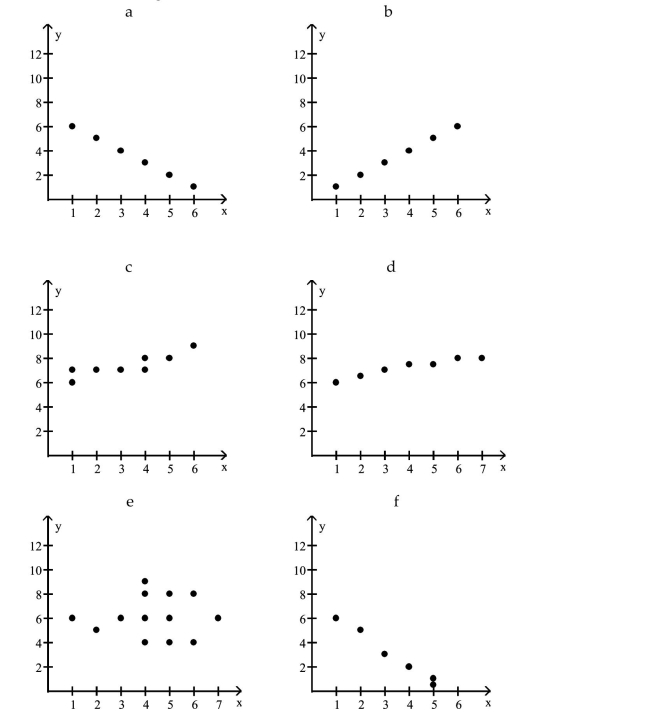
A) a
B) b
C) f
D) d
A) a
B) b
C) f
D) d
سؤال
سؤال
The data below are the number of absences and the final grades of 9 randomly selected students from aliterature class. 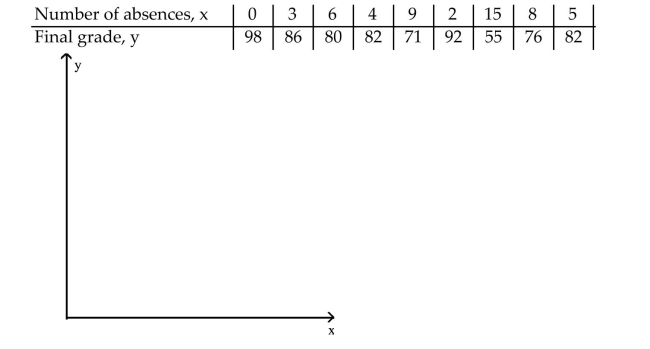
سؤال
In order for employees of a company to work in a foreign office, they must take a test in the language of thecountry where they plan to work. The data below show the relationship between the number of years thatemployees have studied a particular language and the grades they received on the proficiency exam. 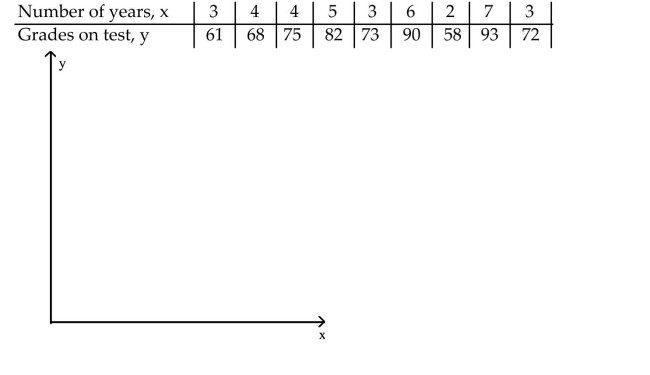
سؤال
A) The variables appear to be positively, linearly related.
B) The variables do not appear to be linearly related.
C) The variables appear to be
D) The variables do not appear to be negatively, linearly related. linearly related.
سؤال
There is no correlation between years of education and births per woman. 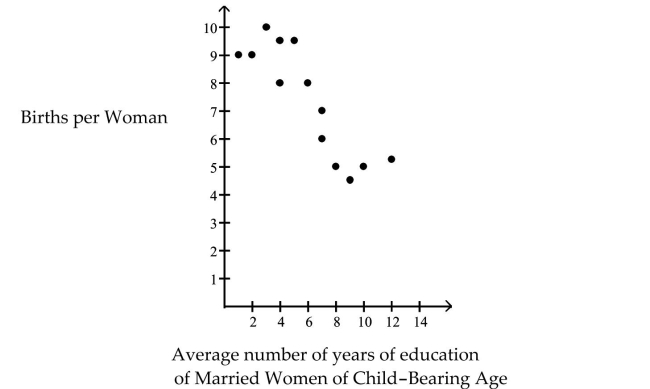
سؤال
Five brands of cigarettes were tested for the amounts of tar and nicotine they contained. All measurements arein milligrams per cigarette. 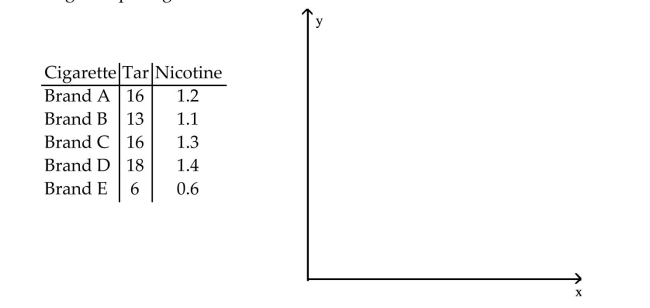
سؤال
The scores of nine members of a local community college womenʹs golf team in two rounds of tournament playare listed below. 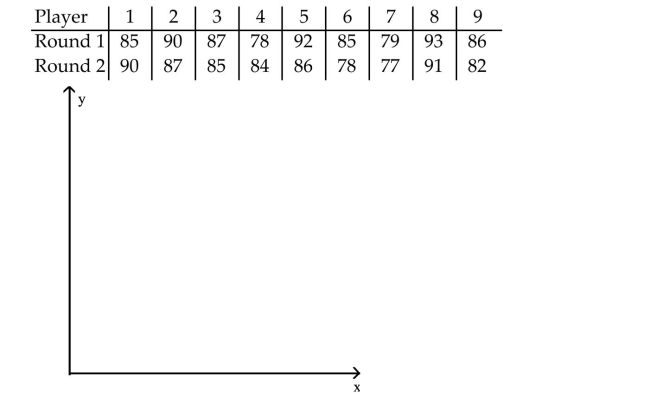
سؤال
Which scatter diagram indicates a perfect positive correlation? 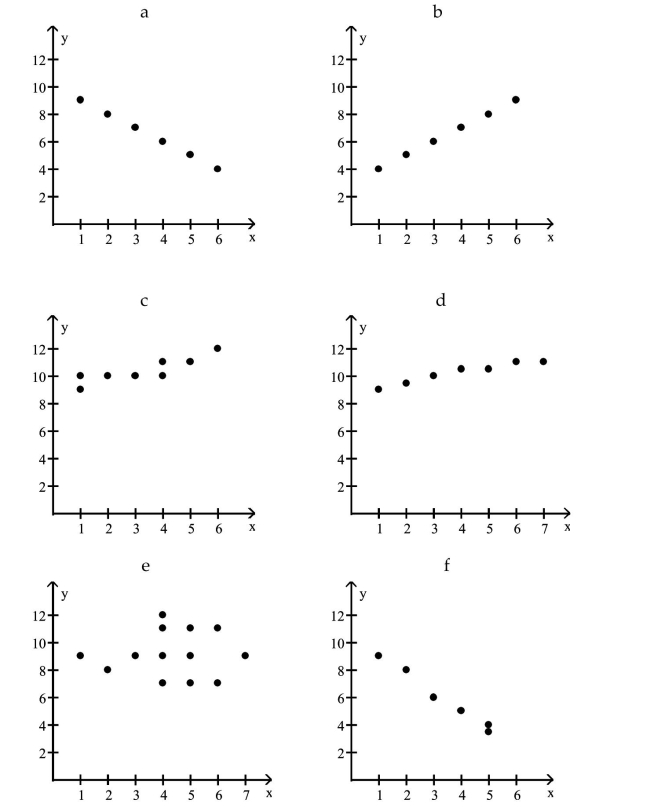
A) b
B) a
C) c
D) f
A) b
B) a
C) c
D) f
سؤال
A) The variables do not appear to be
B) The variables appear to be linearly related. negatively, linearly related.
C) The variables do not appear to be linearly related.
D) The variables appear to be positively, linearly related.
سؤال
There is a strong positive correlation between years of education and births per woman. 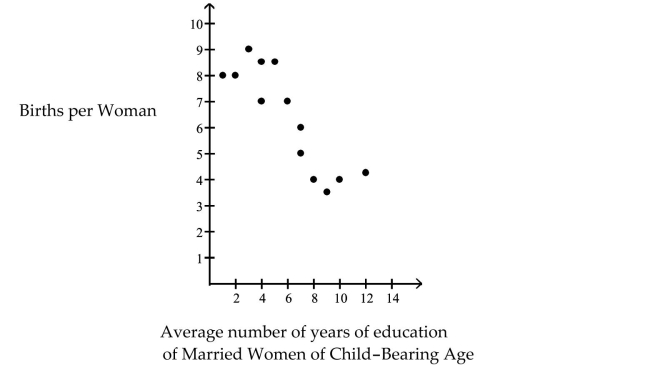
سؤال
A) The variables appear to be

B) The variables do not appear to be positively, linearly related. linearly related.
C) The variables appear to be
D) The variables do not appear to be negatively, linearly related. linearly related.
سؤال
Calculate the linear correlation coefficient for the data below. 
A) -0.104
B) -0.132
C) -0.549
D) -0.581
A) -0.104
B) -0.132
C) -0.549
D) -0.581
سؤال
سؤال
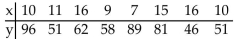
Calculate the linear correlation coefficient for the data below. 
A) -0.995
B) -0.671
C) -0.778
D) -0.885
A) -0.995
B) -0.671
C) -0.778
D) -0.885
سؤال
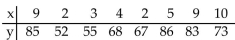
Calculate the linear correlation coefficient for the data below. 
A) 0.990
B) 0.881
C) 0.819
D) 0.792
A) 0.990
B) 0.881
C) 0.819
D) 0.792
سؤال
The data below are the final exam scores of 10 randomly selected calculus students and the number of hoursthey slept the night before the exam. Calculate the linear correlation coefficient. 
A) 0.847
B) 0.991
C) 0.761
D) 0.654
A) 0.847
B) 0.991
C) 0.761
D) 0.654
سؤال
سؤال
The data below represent the numbers of absences and the final grades of 15 randomly selected students froman astronomy class. Construct a scatter diagram for the data. Do you detect a trend? 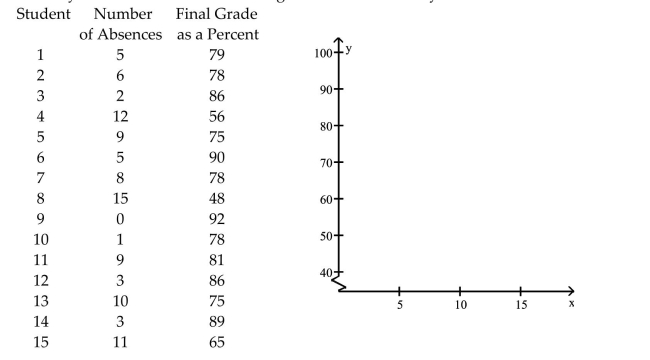
سؤال
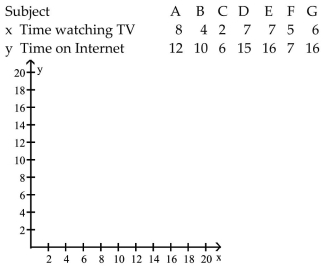
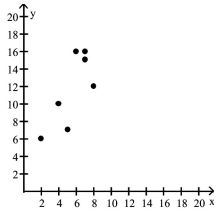
Construct a scatter diagram for the given data. Determine whether there is a positive linear correlation,negative linear correlation, or no linear correlation. 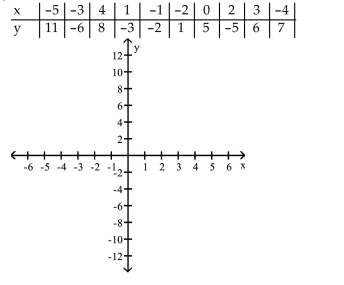
سؤال
سؤال
Construct a scatter diagram for the given data. Determine whether there is a positive linear correlation,negative linear correlation, or no linear correlation. 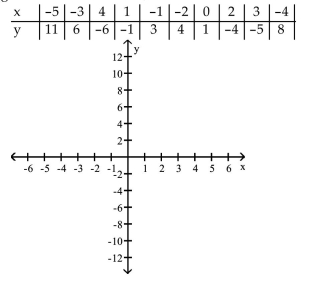
سؤال
سؤال
The data below are the number of hours worked (per week) and the final grades of 9 randomly selectedstudents from a drama class. Calculate the linear correlation coefficient. 
A) -0.991
B) -0.888
C) -0.918
D) -0.899
A) -0.991
B) -0.888
C) -0.918
D) -0.899
سؤال
There is a causal relationship between years of education and births per woman. 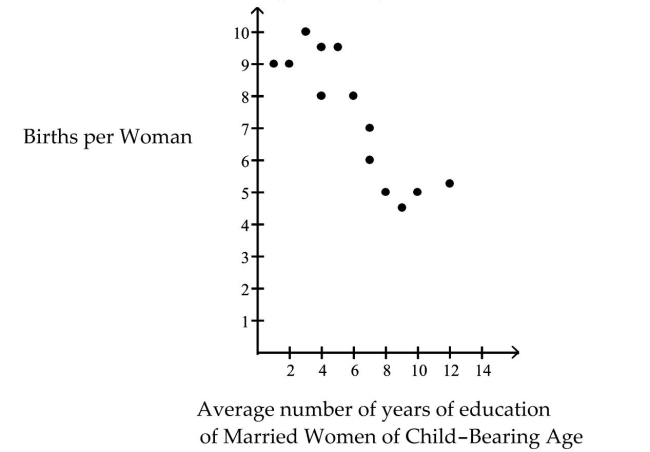
سؤال
The data below are the average one-way commute times (in minutes) of selected students during a summerliterature class and the number of absences for those students for the term. Calculate the linear correlationcoefficient. 
A) 0.980
B) 0.890
C) 0.881
D) 0.819
A) 0.980
B) 0.890
C) 0.881
D) 0.819
سؤال
سؤال
Construct a scatter diagram for the given data. Determine whether there is a positive linear correlation,negative linear correlation, or no linear correlation. 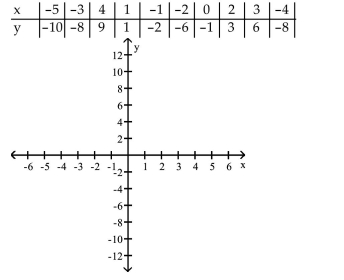
سؤال
سؤال
The data below are the ages and annual pharmacy b ills (in dollars) of 9 randomly selected employees.Calculate the linear correlation coefficient. 
A) 0.960
B) 0.998
C) 0.890
D) 0.908
A) 0.960
B) 0.998
C) 0.890
D) 0.908
سؤال
The numbers of home runs that Mark McGwire hit in the first 13 years of his major league baseball career arelisted below. (Source: Major League Handbook) Construct a scatter diagram for the data. Is there a relationshipbetween the home runs and the batting averages? 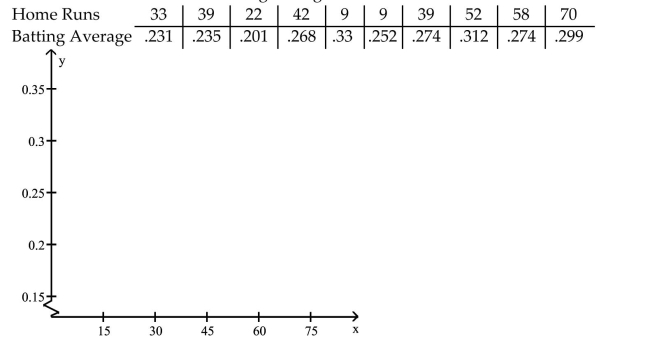
سؤال
سؤال
Find the equation of the regression line for the given data. Round values to the nearest thousandth. 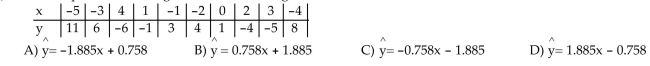
سؤال
A manager wishes to determine the relationship between the number of years the managerʹs salesrepresentatives have been with the company and their average monthly sales (in thousands of dollars).Calculate the linear correlation coefficient. 
A) 0.632
B) 0.561
C) 0.717
D) 0.791
A) 0.632
B) 0.561
C) 0.717
D) 0.791
سؤال
A) r=0.708 ; linear relation exists
B) r=0.235 ; no linear relation exists
C) r=-0.708 ; linear relation exists
D) r=0.708 ; no linear relation exists
سؤال
سؤال
A) r=-0.335 ; no linear relation exists
B) r=0.462 ; linear relation exists
C) r=-0.335 ; linear relation exists
D) r=-0.284 ; no linear relation exists
سؤال
سؤال
The table below shows the scores on an end-of-year project of 10 randomly selected architecture students andthe number of days each student spent working on the project. 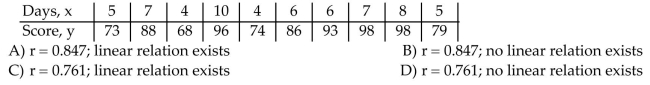
سؤال
In order for a companyʹs employees to work in a foreign office, they must take a test in the language of thecountry where they plan to work. The data below shows the relationship between the number of years thatemployees have studied a particular language and the grades they received on the proficiency exam. Calculatethe linear correlation coefficient. 
A) 0.934
B) 0.911
C) 0.891
D) 0.902
A) 0.934
B) 0.911
C) 0.891
D) 0.902
سؤال
A) r=0.983 ; linear relation exists
B) r=0.983 ; no linear relation exists
C) r=0.883 ; linear relation exists
D) r=0.883 ; no linear relation exists
سؤال
A) r=-0.995 ; linear relation exists
B) r=-0.995 ; no linear relation exists
C) r=-0.885 ; no linear relation exists
D) r=-0.885 ; linear relation exists
سؤال
Find the equation of the regression line for the given data. Round values to the nearest thousandth. 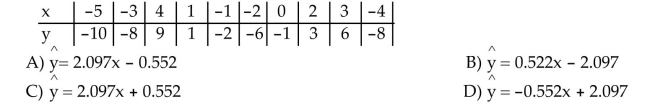
سؤال
A) r=0.990 ; linear relation exists
B) r=0.881 ; no linear relation exists
C) r=0.819 ; linear relation exists
D) r=0.792 ; no linear relation exists
سؤال
The table shows the number of days off last year and the earnings for the year (in thousands of dollars) for ninerandomly selected insurance salesmen. 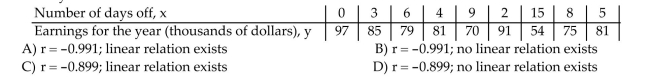
سؤال
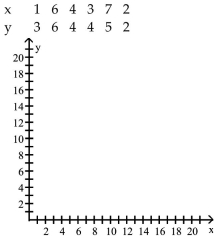
Calculate the coefficient of correlation, r, letting Row 1 represent the x-values and Row 2 represent they-values. Now calculate the coefficient of correlation, r, letting Row 2 represent the x-values and Row 1represent the y-values. What effect does switching the explanatory and response variables have on the linearcorrelation coefficient?  4 Determine whether a linear relation exists between two variables.
4 Determine whether a linear relation exists between two variables. سؤال
The table below shows the ages and weights (in pounds) of 9 randomly selected tennis coaches. 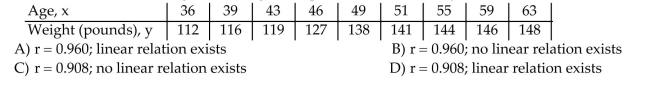
سؤال
A manager wishes to determine whether there is a relationship between the number of years her salesrepresentatives have been with the company and their average monthly sales. The table shows the years ofservice for each of her sales representatives and their average monthly sales (in thousands of dollars). 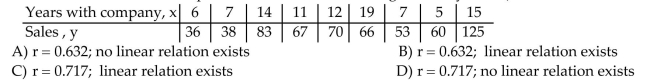
سؤال
To investigate the relationship between yield of soybeans and the amount of fertilizer used, a researcherdivides a field into eight plots of equal size and applies a different amount of fertilizer to each plot. The tableshows the yield of soybeans and the amount of fertilizer used for each plot. 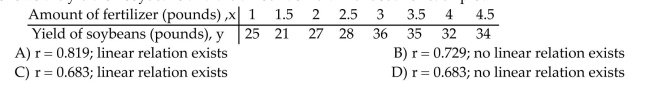 5 Explain the difference between correlation and causation.
5 Explain the difference between correlation and causation. سؤال
سؤال
سؤال
In an area of the Great Plains, records were kept on the relationship between the rainfall (in inches) and theyield of wheat (bushels per acre). Calculate the linear correlation coefficient. 
A) 0.981
B) 0.998
C) 0.900
D) 0.899
A) 0.981
B) 0.998
C) 0.900
D) 0.899
سؤال
The data below are the number of absences and the final grades of 9 randomly selected students from aliterature class. Find the equation of the regression line for the given data. What would be the predicted finalgrade if a student was absent 14 times? Round the regression line values to the nearest hundredth. Round thepredicted grade to the nearest whole number. 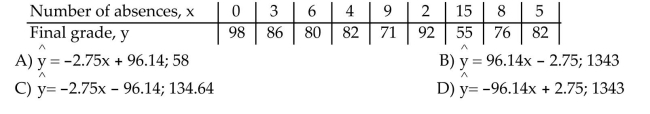
سؤال
Find the equation of the regression line for the given data. Round values to the nearest thousandth. 
سؤال
A manager wishes to determine the relationship between the number of years her sales representatives havebeen employed by the firm and their amount of sales (in thousands of dollars) per month. Find the equation ofthe regression line for the given data. What would be the predicted sales if the sales representative wasemployed by the firm for 30 years Is this reasonable? Why or why not? Round the regression line values to thenearest hundredth. 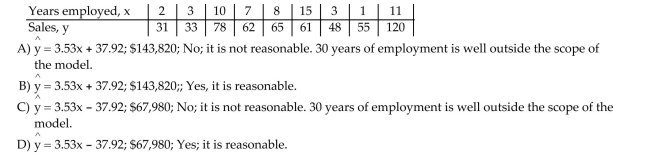
سؤال
The data below are the final exam scores of 10 randomly selected history students and the number of hoursthey slept the night before the exam. Find the equation of the regression line for the given data. What would bethe predicted score for a history student who slept 15 hours the previous night? Is this a reasonable question?Round your predicted score to the nearest whole number. Round the regression line values to the nearesthundredth. 
سؤال
In an area of the Great Plains, records were kept on the relationship between the rainfall (in inches) and theyield of wheat (bushels per acre). Find the equation of the regression line for the given data. Round theregression line values to the nearest thousandth. 
سؤال
A manager wishes to determine the relationship between the number of miles traveled (in hundreds of miles)by her sales representatives and their amount of sales (in thousands of dollars) per month. Find the equation ofthe regression line for the given data. What would be the predicted sales if the sales representative traveled 0miles? Is this reasonable? Why or why not? Round the regression line values to the nearest hundredth. 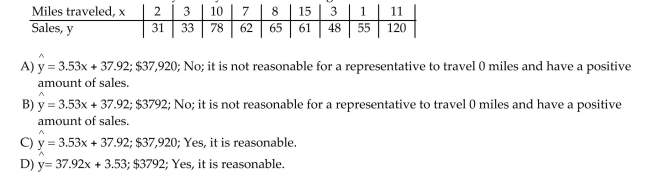
سؤال
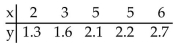
The data below are ages and systolic blood pressures (measured in millimeters of mercury) of 9 randomlyselected adults. Find the equation of the regression line for the given data. What would be the predictedpressure if the age was 60? Round the predicted pressure to the nearest whole number. Round the regressionline values to the nearest hundredth. 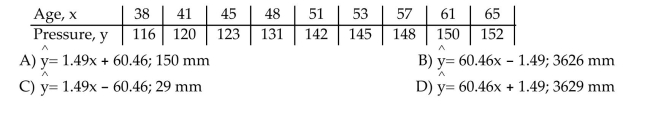
سؤال
The data below are the final exam scores of 10 randomly selected history students and the number of hoursthey slept the night before the exam. Find the equation of the regression line for the given data. What would bethe predicted score for a history student who slept 7 hours the previous night? Is this a reasonable question?Round the regression line values to the nearest hundredth, and round the predicted score to the nearest wholenumber. 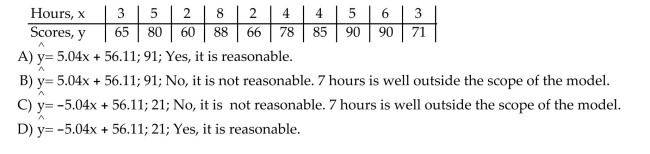
سؤال
سؤال
In order for a companyʹs employees to work in a foreign office, they must take a test in the language of thecountry where they plan to work. The data below shows the relationship between the number of years thatemployees have studied a particular language and the grades they received on the proficiency exam. Find theequation of the regression line for the given data. Round the regression line values to the nearest hundredth. 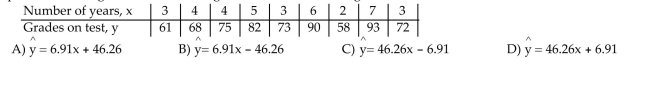
سؤال
The data below are the average one-way commute times (in minutes) for selected students and the number ofabsences for those students during the term. Find the equation of the regression line for the given data. Whatwould be the predicted number of absences if the commute time was 40 minutes? Is this a reasonable question?Round the predicted number of absences to the nearest whole number. Round the regression line values to thenearest hundredth. 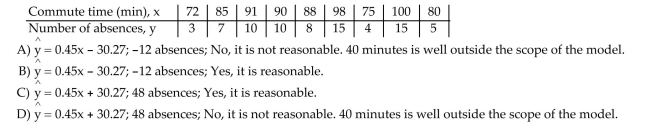
سؤال
Find the equation of the regression line by letting Row 1 represent the x-values and Row 2 represent they-values. Now find the equation of the regression line letting Row 2 represent the x-values and Row 1represent the y-values. What effect does switching the explanatory and response variables have on theregression line? 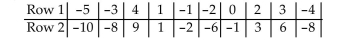

فتح الحزمة
قم بالتسجيل لفتح البطاقات في هذه المجموعة!
Unlock Deck
Unlock Deck
1/72
العب
ملء الشاشة (f)
Deck 4: Describing the Relation Between Two Variables
1
The data below are the ages and systolic blood pressures (measured in millimeters of mercury) of 9 randomlyselected adults.
2
In an area of the Great Plains, records were kept on the relationship between the rainfall (in inches) and theyield of wheat (bushels per acre).
3
In which scatter diagram is r = 1?
A) b
B) a
C) f
D) d
A) b
B) a
C) f
D) d
A
4
There is a strong negative correlation between years of education and births per woman.
فتح الحزمة
افتح القفل للوصول البطاقات البالغ عددها 72 في هذه المجموعة.
فتح الحزمة
k this deck
5
The data below are the final exam scores of 10 randomly selected history students and the number of hoursthey studied for the exam.
فتح الحزمة
افتح القفل للوصول البطاقات البالغ عددها 72 في هذه المجموعة.
فتح الحزمة
k this deck
6
A manager wishes to determine the relationship between the number of miles (in hundreds of miles) themanagerʹs sales representatives travel per month and the amount of sales (in thousands of dollars) per month.
فتح الحزمة
افتح القفل للوصول البطاقات البالغ عددها 72 في هذه المجموعة.
فتح الحزمة
k this deck
7
In which scatter diagram is r = 0.01?
فتح الحزمة
افتح القفل للوصول البطاقات البالغ عددها 72 في هذه المجموعة.
فتح الحزمة
k this deck
8
The data below are the temperatures on randomly chosen days during a summer class and the number ofabsences on those days.
فتح الحزمة
افتح القفل للوصول البطاقات البالغ عددها 72 في هذه المجموعة.
فتح الحزمة
k this deck
9
In which scatter diagram is r = -1?
A) a
B) b
C) f
D) d
A) a
B) b
C) f
D) d
فتح الحزمة
افتح القفل للوصول البطاقات البالغ عددها 72 في هذه المجموعة.
فتح الحزمة
k this deck
10
The variable is the variable whose value can be explained by the variable.
A) response; predictor
B) response; lurking
C) lurking; response
D) predictor Responselem.
A) response; predictor
B) response; lurking
C) lurking; response
D) predictor Responselem.
فتح الحزمة
افتح القفل للوصول البطاقات البالغ عددها 72 في هذه المجموعة.
فتح الحزمة
k this deck
11
The data below are the number of absences and the final grades of 9 randomly selected students from aliterature class.
فتح الحزمة
افتح القفل للوصول البطاقات البالغ عددها 72 في هذه المجموعة.
فتح الحزمة
k this deck
12
In order for employees of a company to work in a foreign office, they must take a test in the language of thecountry where they plan to work. The data below show the relationship between the number of years thatemployees have studied a particular language and the grades they received on the proficiency exam.
فتح الحزمة
افتح القفل للوصول البطاقات البالغ عددها 72 في هذه المجموعة.
فتح الحزمة
k this deck
13
A) The variables appear to be positively, linearly related.
B) The variables do not appear to be linearly related.
C) The variables appear to be
D) The variables do not appear to be negatively, linearly related. linearly related.
فتح الحزمة
افتح القفل للوصول البطاقات البالغ عددها 72 في هذه المجموعة.
فتح الحزمة
k this deck
14
There is no correlation between years of education and births per woman.
فتح الحزمة
افتح القفل للوصول البطاقات البالغ عددها 72 في هذه المجموعة.
فتح الحزمة
k this deck
15
Five brands of cigarettes were tested for the amounts of tar and nicotine they contained. All measurements arein milligrams per cigarette.
فتح الحزمة
افتح القفل للوصول البطاقات البالغ عددها 72 في هذه المجموعة.
فتح الحزمة
k this deck
16
The scores of nine members of a local community college womenʹs golf team in two rounds of tournament playare listed below.
فتح الحزمة
افتح القفل للوصول البطاقات البالغ عددها 72 في هذه المجموعة.
فتح الحزمة
k this deck
17
Which scatter diagram indicates a perfect positive correlation?
A) b
B) a
C) c
D) f
A) b
B) a
C) c
D) f
فتح الحزمة
افتح القفل للوصول البطاقات البالغ عددها 72 في هذه المجموعة.
فتح الحزمة
k this deck
18
A) The variables do not appear to be
B) The variables appear to be linearly related. negatively, linearly related.
C) The variables do not appear to be linearly related.
D) The variables appear to be positively, linearly related.
فتح الحزمة
افتح القفل للوصول البطاقات البالغ عددها 72 في هذه المجموعة.
فتح الحزمة
k this deck
19
There is a strong positive correlation between years of education and births per woman.
فتح الحزمة
افتح القفل للوصول البطاقات البالغ عددها 72 في هذه المجموعة.
فتح الحزمة
k this deck
20
A) The variables appear to be
B) The variables do not appear to be positively, linearly related. linearly related.
C) The variables appear to be
D) The variables do not appear to be negatively, linearly related. linearly related.
فتح الحزمة
افتح القفل للوصول البطاقات البالغ عددها 72 في هذه المجموعة.
فتح الحزمة
k this deck
21
Calculate the linear correlation coefficient for the data below.
A) -0.104
B) -0.132
C) -0.549
D) -0.581
A) -0.104
B) -0.132
C) -0.549
D) -0.581
فتح الحزمة
افتح القفل للوصول البطاقات البالغ عددها 72 في هذه المجموعة.
فتح الحزمة
k this deck
22
A history instructor has given the same pretest and the same final examination each semester. He is interestedin determining if there is a relationship between the scores of the two tests. He computes the linear correlationcoefficient and notes that it is 1.15. What does this correlation coefficient value tell the instructor?
A) The history instructor has made a computational error.
B) There is a strong positive correlation between the tests.
C) There is a strong negative correlation between the tests.
D) The correlation is something other than linear.
A) The history instructor has made a computational error.
B) There is a strong positive correlation between the tests.
C) There is a strong negative correlation between the tests.
D) The correlation is something other than linear.
فتح الحزمة
افتح القفل للوصول البطاقات البالغ عددها 72 في هذه المجموعة.
فتح الحزمة
k this deck
23
Calculate the linear correlation coefficient for the data below.
A) -0.995
B) -0.671
C) -0.778
D) -0.885
A) -0.995
B) -0.671
C) -0.778
D) -0.885
فتح الحزمة
افتح القفل للوصول البطاقات البالغ عددها 72 في هذه المجموعة.
فتح الحزمة
k this deck
24
Calculate the linear correlation coefficient for the data below.
A) 0.990
B) 0.881
C) 0.819
D) 0.792
A) 0.990
B) 0.881
C) 0.819
D) 0.792
فتح الحزمة
افتح القفل للوصول البطاقات البالغ عددها 72 في هذه المجموعة.
فتح الحزمة
k this deck
25
The data below are the final exam scores of 10 randomly selected calculus students and the number of hoursthey slept the night before the exam. Calculate the linear correlation coefficient.
A) 0.847
B) 0.991
C) 0.761
D) 0.654
A) 0.847
B) 0.991
C) 0.761
D) 0.654
فتح الحزمة
افتح القفل للوصول البطاقات البالغ عددها 72 في هذه المجموعة.
فتح الحزمة
k this deck
26
True or False: A doctor wishes to determine the relationship between a maleʹs age and that maleʹs totalcholesterol level. He tests 200 males and records each maleʹs age and that maleʹs total cholesterol level. Themales cholesterol level is the predictor variable?
فتح الحزمة
افتح القفل للوصول البطاقات البالغ عددها 72 في هذه المجموعة.
فتح الحزمة
k this deck
27
The data below represent the numbers of absences and the final grades of 15 randomly selected students froman astronomy class. Construct a scatter diagram for the data. Do you detect a trend?
فتح الحزمة
افتح القفل للوصول البطاقات البالغ عددها 72 في هذه المجموعة.
فتح الحزمة
k this deck
28
Construct a scatter diagram for the given data. Determine whether there is a positive linear correlation,negative linear correlation, or no linear correlation.
فتح الحزمة
افتح القفل للوصول البطاقات البالغ عددها 72 في هذه المجموعة.
فتح الحزمة
k this deck
29
A researcher determines that the linear correlation coefficient is 0.85 for a paired data set. This indicates thatthere is
A) a strong positive linear correlation.
B) a strong negative linear correlation.
C) no linear correlation but that there may be some other relationship.
D) insufficient evidence to make any decision about the correlation of the data.
A) a strong positive linear correlation.
B) a strong negative linear correlation.
C) no linear correlation but that there may be some other relationship.
D) insufficient evidence to make any decision about the correlation of the data.
فتح الحزمة
افتح القفل للوصول البطاقات البالغ عددها 72 في هذه المجموعة.
فتح الحزمة
k this deck
30
Construct a scatter diagram for the given data. Determine whether there is a positive linear correlation,negative linear correlation, or no linear correlation.
فتح الحزمة
افتح القفل للوصول البطاقات البالغ عددها 72 في هذه المجموعة.
فتح الحزمة
k this deck
31
A medical researcher wishes to determine if there is a relationship between the number of prescriptions writtenby medical professionals, per 100, children and the childʹs age. She surveys all the pediatricianʹs in ageographical region to collect her data. What is the response variable?
A) Age of the child
B) Number of prescriptions written
C) Pediatricians surveyed
D) 100 prescriptions
A) Age of the child
B) Number of prescriptions written
C) Pediatricians surveyed
D) 100 prescriptions
فتح الحزمة
افتح القفل للوصول البطاقات البالغ عددها 72 في هذه المجموعة.
فتح الحزمة
k this deck
32
The data below are the number of hours worked (per week) and the final grades of 9 randomly selectedstudents from a drama class. Calculate the linear correlation coefficient.
A) -0.991
B) -0.888
C) -0.918
D) -0.899
A) -0.991
B) -0.888
C) -0.918
D) -0.899
فتح الحزمة
افتح القفل للوصول البطاقات البالغ عددها 72 في هذه المجموعة.
فتح الحزمة
k this deck
33
There is a causal relationship between years of education and births per woman.
فتح الحزمة
افتح القفل للوصول البطاقات البالغ عددها 72 في هذه المجموعة.
فتح الحزمة
k this deck
34
The data below are the average one-way commute times (in minutes) of selected students during a summerliterature class and the number of absences for those students for the term. Calculate the linear correlationcoefficient.
A) 0.980
B) 0.890
C) 0.881
D) 0.819
A) 0.980
B) 0.890
C) 0.881
D) 0.819
فتح الحزمة
افتح القفل للوصول البطاقات البالغ عددها 72 في هذه المجموعة.
فتح الحزمة
k this deck
35
An instructor wishes to determine if there is a relationship between the number of absences from his class anda studentʹs final grade in the course. What is the predictor variable?
A) Absences
B) Final Grade
C) The instructorʹs point scale for attendance
D) Studentʹs performance on the final examination
A) Absences
B) Final Grade
C) The instructorʹs point scale for attendance
D) Studentʹs performance on the final examination
فتح الحزمة
افتح القفل للوصول البطاقات البالغ عددها 72 في هذه المجموعة.
فتح الحزمة
k this deck
36
Construct a scatter diagram for the given data. Determine whether there is a positive linear correlation,negative linear correlation, or no linear correlation.
فتح الحزمة
افتح القفل للوصول البطاقات البالغ عددها 72 في هذه المجموعة.
فتح الحزمة
k this deck
37
A scatter diagram locates a point in a two dimensional plane. The diagram locates thevariable on the horizontal axis and the variable on the vertical axis.
A) predictor; response
B) response; predictor
C) response; study
D) study; predictor
A) predictor; response
B) response; predictor
C) response; study
D) study; predictor
فتح الحزمة
افتح القفل للوصول البطاقات البالغ عددها 72 في هذه المجموعة.
فتح الحزمة
k this deck
38
The data below are the ages and annual pharmacy b ills (in dollars) of 9 randomly selected employees.Calculate the linear correlation coefficient.
A) 0.960
B) 0.998
C) 0.890
D) 0.908
A) 0.960
B) 0.998
C) 0.890
D) 0.908
فتح الحزمة
افتح القفل للوصول البطاقات البالغ عددها 72 في هذه المجموعة.
فتح الحزمة
k this deck
39
The numbers of home runs that Mark McGwire hit in the first 13 years of his major league baseball career arelisted below. (Source: Major League Handbook) Construct a scatter diagram for the data. Is there a relationshipbetween the home runs and the batting averages?
فتح الحزمة
افتح القفل للوصول البطاقات البالغ عددها 72 في هذه المجموعة.
فتح الحزمة
k this deck
40
A traffic officer is compiling information about the relationship between the hour or the day and the speed overthe limit at which the motorist is ticketed. He computes a correlation coefficient of 0.12. What does this tellthe officer?
A) There is a weak positive linear correlation.
B) There is a moderate positive linear correlation.
C) There is a moderate negative linear correlation.
D) There is insufficient evidence to make any conclusions about the relationship between the variables.
A) There is a weak positive linear correlation.
B) There is a moderate positive linear correlation.
C) There is a moderate negative linear correlation.
D) There is insufficient evidence to make any conclusions about the relationship between the variables.
فتح الحزمة
افتح القفل للوصول البطاقات البالغ عددها 72 في هذه المجموعة.
فتح الحزمة
k this deck
41
Find the equation of the regression line for the given data. Round values to the nearest thousandth.
فتح الحزمة
افتح القفل للوصول البطاقات البالغ عددها 72 في هذه المجموعة.
فتح الحزمة
k this deck
42
A manager wishes to determine the relationship between the number of years the managerʹs salesrepresentatives have been with the company and their average monthly sales (in thousands of dollars).Calculate the linear correlation coefficient.
A) 0.632
B) 0.561
C) 0.717
D) 0.791
A) 0.632
B) 0.561
C) 0.717
D) 0.791
فتح الحزمة
افتح القفل للوصول البطاقات البالغ عددها 72 في هذه المجموعة.
فتح الحزمة
k this deck
43
A) r=0.708 ; linear relation exists
B) r=0.235 ; no linear relation exists
C) r=-0.708 ; linear relation exists
D) r=0.708 ; no linear relation exists
فتح الحزمة
افتح القفل للوصول البطاقات البالغ عددها 72 في هذه المجموعة.
فتح الحزمة
k this deck
44
For a random sample of 100 American cities, the linear correlation coefficient between the number of robberieslast year and the number of schools in the city was found to be r = 0.725. What does this imply? Does thissuggest that building more schools in a city could lead to more robberies? Why or why not? What is a likelylurking variable?
فتح الحزمة
افتح القفل للوصول البطاقات البالغ عددها 72 في هذه المجموعة.
فتح الحزمة
k this deck
45
A) r=-0.335 ; no linear relation exists
B) r=0.462 ; linear relation exists
C) r=-0.335 ; linear relation exists
D) r=-0.284 ; no linear relation exists
فتح الحزمة
افتح القفل للوصول البطاقات البالغ عددها 72 في هذه المجموعة.
فتح الحزمة
k this deck
46
For a random sample of 30 countries, the linear correlation coefficient between the infant mortality rate and theaverage number of cars per capita was found to be r = -0.717. What does this imply? Does this suggest that ifpeople buy more cars, this could lower the infant mortality rate? Why or why not? What is a likely lurkingvariable?
فتح الحزمة
افتح القفل للوصول البطاقات البالغ عددها 72 في هذه المجموعة.
فتح الحزمة
k this deck
47
The table below shows the scores on an end-of-year project of 10 randomly selected architecture students andthe number of days each student spent working on the project.
فتح الحزمة
افتح القفل للوصول البطاقات البالغ عددها 72 في هذه المجموعة.
فتح الحزمة
k this deck
48
In order for a companyʹs employees to work in a foreign office, they must take a test in the language of thecountry where they plan to work. The data below shows the relationship between the number of years thatemployees have studied a particular language and the grades they received on the proficiency exam. Calculatethe linear correlation coefficient.
A) 0.934
B) 0.911
C) 0.891
D) 0.902
A) 0.934
B) 0.911
C) 0.891
D) 0.902
فتح الحزمة
افتح القفل للوصول البطاقات البالغ عددها 72 في هذه المجموعة.
فتح الحزمة
k this deck
49
A) r=0.983 ; linear relation exists
B) r=0.983 ; no linear relation exists
C) r=0.883 ; linear relation exists
D) r=0.883 ; no linear relation exists
فتح الحزمة
افتح القفل للوصول البطاقات البالغ عددها 72 في هذه المجموعة.
فتح الحزمة
k this deck
50
A) r=-0.995 ; linear relation exists
B) r=-0.995 ; no linear relation exists
C) r=-0.885 ; no linear relation exists
D) r=-0.885 ; linear relation exists
فتح الحزمة
افتح القفل للوصول البطاقات البالغ عددها 72 في هذه المجموعة.
فتح الحزمة
k this deck
51
Find the equation of the regression line for the given data. Round values to the nearest thousandth.
فتح الحزمة
افتح القفل للوصول البطاقات البالغ عددها 72 في هذه المجموعة.
فتح الحزمة
k this deck
52
A) r=0.990 ; linear relation exists
B) r=0.881 ; no linear relation exists
C) r=0.819 ; linear relation exists
D) r=0.792 ; no linear relation exists
فتح الحزمة
افتح القفل للوصول البطاقات البالغ عددها 72 في هذه المجموعة.
فتح الحزمة
k this deck
53
The table shows the number of days off last year and the earnings for the year (in thousands of dollars) for ninerandomly selected insurance salesmen.
فتح الحزمة
افتح القفل للوصول البطاقات البالغ عددها 72 في هذه المجموعة.
فتح الحزمة
k this deck
54
Calculate the coefficient of correlation, r, letting Row 1 represent the x-values and Row 2 represent they-values. Now calculate the coefficient of correlation, r, letting Row 2 represent the x-values and Row 1represent the y-values. What effect does switching the explanatory and response variables have on the linearcorrelation coefficient? 4 Determine whether a linear relation exists between two variables.
4 Determine whether a linear relation exists between two variables. فتح الحزمة
افتح القفل للوصول البطاقات البالغ عددها 72 في هذه المجموعة.
فتح الحزمة
k this deck
55
The table below shows the ages and weights (in pounds) of 9 randomly selected tennis coaches.
فتح الحزمة
افتح القفل للوصول البطاقات البالغ عددها 72 في هذه المجموعة.
فتح الحزمة
k this deck
56
A manager wishes to determine whether there is a relationship between the number of years her salesrepresentatives have been with the company and their average monthly sales. The table shows the years ofservice for each of her sales representatives and their average monthly sales (in thousands of dollars).
فتح الحزمة
افتح القفل للوصول البطاقات البالغ عددها 72 في هذه المجموعة.
فتح الحزمة
k this deck
57
To investigate the relationship between yield of soybeans and the amount of fertilizer used, a researcherdivides a field into eight plots of equal size and applies a different amount of fertilizer to each plot. The tableshows the yield of soybeans and the amount of fertilizer used for each plot. 5 Explain the difference between correlation and causation.
5 Explain the difference between correlation and causation. فتح الحزمة
افتح القفل للوصول البطاقات البالغ عددها 72 في هذه المجموعة.
فتح الحزمة
k this deck
58
A variable that is related to either the response variable or the predictor variable or both, but which is excludedfrom the analysis is a
A) lurking variable.
B) random variable.
C) discrete variable.
D) qualitative variable.
A) lurking variable.
B) random variable.
C) discrete variable.
D) qualitative variable.
فتح الحزمة
افتح القفل للوصول البطاقات البالغ عددها 72 في هذه المجموعة.
فتح الحزمة
k this deck
59
A random sample of 200 men aged between 20 and 60 was selected from a certain city. The linear correlationcoefficient between income and blood pressure was found to be r = 0.807. What does this imply? Does thissuggest that if a man gets a salary raise his blood pressure is likely to rise? Why or why not? What are likelylurking variables?4.2 Least-Squares Regression1 Find the least-squares regression line and use the line to make predictions.
فتح الحزمة
افتح القفل للوصول البطاقات البالغ عددها 72 في هذه المجموعة.
فتح الحزمة
k this deck
60
In an area of the Great Plains, records were kept on the relationship between the rainfall (in inches) and theyield of wheat (bushels per acre). Calculate the linear correlation coefficient.
A) 0.981
B) 0.998
C) 0.900
D) 0.899
A) 0.981
B) 0.998
C) 0.900
D) 0.899
فتح الحزمة
افتح القفل للوصول البطاقات البالغ عددها 72 في هذه المجموعة.
فتح الحزمة
k this deck
61
The data below are the number of absences and the final grades of 9 randomly selected students from aliterature class. Find the equation of the regression line for the given data. What would be the predicted finalgrade if a student was absent 14 times? Round the regression line values to the nearest hundredth. Round thepredicted grade to the nearest whole number.
فتح الحزمة
افتح القفل للوصول البطاقات البالغ عددها 72 في هذه المجموعة.
فتح الحزمة
k this deck
62
Find the equation of the regression line for the given data. Round values to the nearest thousandth.
فتح الحزمة
افتح القفل للوصول البطاقات البالغ عددها 72 في هذه المجموعة.
فتح الحزمة
k this deck
63
A manager wishes to determine the relationship between the number of years her sales representatives havebeen employed by the firm and their amount of sales (in thousands of dollars) per month. Find the equation ofthe regression line for the given data. What would be the predicted sales if the sales representative wasemployed by the firm for 30 years Is this reasonable? Why or why not? Round the regression line values to thenearest hundredth.
فتح الحزمة
افتح القفل للوصول البطاقات البالغ عددها 72 في هذه المجموعة.
فتح الحزمة
k this deck
64
The data below are the final exam scores of 10 randomly selected history students and the number of hoursthey slept the night before the exam. Find the equation of the regression line for the given data. What would bethe predicted score for a history student who slept 15 hours the previous night? Is this a reasonable question?Round your predicted score to the nearest whole number. Round the regression line values to the nearesthundredth.
فتح الحزمة
افتح القفل للوصول البطاقات البالغ عددها 72 في هذه المجموعة.
فتح الحزمة
k this deck
65
In an area of the Great Plains, records were kept on the relationship between the rainfall (in inches) and theyield of wheat (bushels per acre). Find the equation of the regression line for the given data. Round theregression line values to the nearest thousandth.
فتح الحزمة
افتح القفل للوصول البطاقات البالغ عددها 72 في هذه المجموعة.
فتح الحزمة
k this deck
66
A manager wishes to determine the relationship between the number of miles traveled (in hundreds of miles)by her sales representatives and their amount of sales (in thousands of dollars) per month. Find the equation ofthe regression line for the given data. What would be the predicted sales if the sales representative traveled 0miles? Is this reasonable? Why or why not? Round the regression line values to the nearest hundredth.
فتح الحزمة
افتح القفل للوصول البطاقات البالغ عددها 72 في هذه المجموعة.
فتح الحزمة
k this deck
67
The data below are ages and systolic blood pressures (measured in millimeters of mercury) of 9 randomlyselected adults. Find the equation of the regression line for the given data. What would be the predictedpressure if the age was 60? Round the predicted pressure to the nearest whole number. Round the regressionline values to the nearest hundredth.
فتح الحزمة
افتح القفل للوصول البطاقات البالغ عددها 72 في هذه المجموعة.
فتح الحزمة
k this deck
68
The data below are the final exam scores of 10 randomly selected history students and the number of hoursthey slept the night before the exam. Find the equation of the regression line for the given data. What would bethe predicted score for a history student who slept 7 hours the previous night? Is this a reasonable question?Round the regression line values to the nearest hundredth, and round the predicted score to the nearest wholenumber.
فتح الحزمة
افتح القفل للوصول البطاقات البالغ عددها 72 في هذه المجموعة.
فتح الحزمة
k this deck
69
The data below are the average one-way commute times (in minutes) for selected students and the number ofabsences for those students during the term. Find the equation of the regression line for the given data. Whatwould be the predicted number of absences if the commute time was 95 minutes? Is this a reasonable question?Round the predicted number of absences to the nearest whole number. Round the regression line values to thenearest hundredth.
A) absences; , it is reasonable.
B) absences; No, it is not reasonable. 95 minutes is well outside the scope of the model.
C) absences; Yes, it is reasonable.
D) absences; No, it is not reasonable. 95 minutes is well outside the scope of the model.
A) absences; , it is reasonable.
B) absences; No, it is not reasonable. 95 minutes is well outside the scope of the model.
C) absences; Yes, it is reasonable.
D) absences; No, it is not reasonable. 95 minutes is well outside the scope of the model.
فتح الحزمة
افتح القفل للوصول البطاقات البالغ عددها 72 في هذه المجموعة.
فتح الحزمة
k this deck
70
In order for a companyʹs employees to work in a foreign office, they must take a test in the language of thecountry where they plan to work. The data below shows the relationship between the number of years thatemployees have studied a particular language and the grades they received on the proficiency exam. Find theequation of the regression line for the given data. Round the regression line values to the nearest hundredth.
فتح الحزمة
افتح القفل للوصول البطاقات البالغ عددها 72 في هذه المجموعة.
فتح الحزمة
k this deck
71
The data below are the average one-way commute times (in minutes) for selected students and the number ofabsences for those students during the term. Find the equation of the regression line for the given data. Whatwould be the predicted number of absences if the commute time was 40 minutes? Is this a reasonable question?Round the predicted number of absences to the nearest whole number. Round the regression line values to thenearest hundredth.
فتح الحزمة
افتح القفل للوصول البطاقات البالغ عددها 72 في هذه المجموعة.
فتح الحزمة
k this deck
72
Find the equation of the regression line by letting Row 1 represent the x-values and Row 2 represent they-values. Now find the equation of the regression line letting Row 2 represent the x-values and Row 1represent the y-values. What effect does switching the explanatory and response variables have on theregression line?
فتح الحزمة
افتح القفل للوصول البطاقات البالغ عددها 72 في هذه المجموعة.
فتح الحزمة
k this deck
فتح الحزمة
افتح القفل للوصول البطاقات البالغ عددها 72 في هذه المجموعة.


