Deck 2: Describing, Exploring, and Comparing Data
ملء الشاشة (f)
سؤال
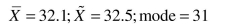
Use the following sample data for the following questions. A study of physical
fitness tests for 12 randomly selected Pre-Medical students measured their exercise
capacity (in minutes). The following data resulted:
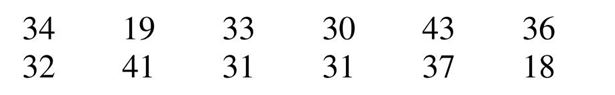
Find the sample data value corresponding to P24 .
fitness tests for 12 randomly selected Pre-Medical students measured their exercise
capacity (in minutes). The following data resulted:
Find the sample data value corresponding to P24 .
سؤال
Use the following sample data for the following questions. A study of physical
fitness tests for 12 randomly selected Pre-Medical students measured their exercise
capacity (in minutes). The following data resulted:
Using five classes, construct a frequency distribution of the students' exercise capacity.
fitness tests for 12 randomly selected Pre-Medical students measured their exercise
capacity (in minutes). The following data resulted:
Using five classes, construct a frequency distribution of the students' exercise capacity.
سؤال
Use the following sample data for the following questions. A study of physical
fitness tests for 12 randomly selected Pre-Medical students measured their exercise
capacity (in minutes). The following data resulted:
Find the mean, the median, and the mode for the students' exercise capacity.
fitness tests for 12 randomly selected Pre-Medical students measured their exercise
capacity (in minutes). The following data resulted:
Find the mean, the median, and the mode for the students' exercise capacity.
سؤال
Use the following sample data for the following questions. A study of physical
fitness tests for 12 randomly selected Pre-Medical students measured their exercise
capacity (in minutes). The following data resulted:
Find the percentile corresponding to 36 minutes.
fitness tests for 12 randomly selected Pre-Medical students measured their exercise
capacity (in minutes). The following data resulted:
Find the percentile corresponding to 36 minutes.
سؤال
سؤال
Use the following sample data for the following questions. A study of physical
fitness tests for 12 randomly selected Pre-Medical students measured their exercise
capacity (in minutes). The following data resulted:
Find the standard deviation and the variance for the sample data of the students' exercise capacity.
fitness tests for 12 randomly selected Pre-Medical students measured their exercise
capacity (in minutes). The following data resulted:
Find the standard deviation and the variance for the sample data of the students' exercise capacity.
سؤال
Use the following data for the next questions. The information below was
generated from a registry of the number of patients waiting for a heart transplant
during the last 10 years.
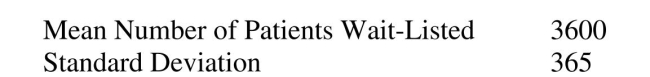
Using the Empirical Rule, what is the approximate percentage of people waiting for a heart between 2505 and 4695 patients?
generated from a registry of the number of patients waiting for a heart transplant
during the last 10 years.
Using the Empirical Rule, what is the approximate percentage of people waiting for a heart between 2505 and 4695 patients?
سؤال
Use the following data for the next questions. The information below was
generated from a registry of the number of patients waiting for a heart transplant
during the last 10 years.
In 2003, the mean number of patients waiting for a heart transplant was 3400. Convert this data to a z-score.
generated from a registry of the number of patients waiting for a heart transplant
during the last 10 years.
In 2003, the mean number of patients waiting for a heart transplant was 3400. Convert this data to a z-score.
سؤال
سؤال
سؤال
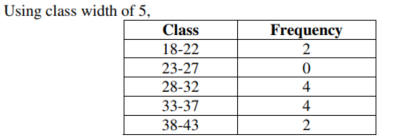
Use the frequency distribution to answer the next questions. A sample of 80
juvenile salmon is grouped into the resulting frequency distribution based on their
weights.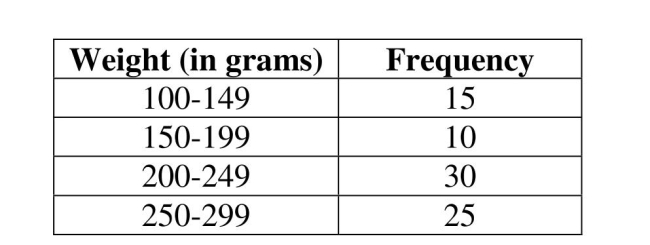
Construct a corresponding histogram for the weights of the juvenile salmon.
juvenile salmon is grouped into the resulting frequency distribution based on their
weights.
Construct a corresponding histogram for the weights of the juvenile salmon.
سؤال
Use the following sample data for the following questions. A study of physical
fitness tests for 12 randomly selected Pre-Medical students measured their exercise
capacity (in minutes). The following data resulted:
Construct a stem and leaf plot of the students' exercise capacity.
fitness tests for 12 randomly selected Pre-Medical students measured their exercise
capacity (in minutes). The following data resulted:
Construct a stem and leaf plot of the students' exercise capacity.
سؤال
Use the following sample data for the following questions. A study of physical
fitness tests for 12 randomly selected Pre-Medical students measured their exercise
capacity (in minutes). The following data resulted:
Identify the five number summary for the students' exercise capacity.
fitness tests for 12 randomly selected Pre-Medical students measured their exercise
capacity (in minutes). The following data resulted:
Identify the five number summary for the students' exercise capacity.
سؤال
Use the following data for the next questions. The information below was
generated from a registry of the number of patients waiting for a heart transplant
during the last 10 years.
Use the Range Rule of Thumb to estimate the minimum and maximum "usual" number of patients waiting for a heart.
generated from a registry of the number of patients waiting for a heart transplant
during the last 10 years.
Use the Range Rule of Thumb to estimate the minimum and maximum "usual" number of patients waiting for a heart.
سؤال
Use the frequency distribution to answer the next questions. A sample of 80
juvenile salmon is grouped into the resulting frequency distribution based on their
weights.
Determine the sample mean of the weights of the juvenile salmon summarized in the frequency distribution.
juvenile salmon is grouped into the resulting frequency distribution based on their
weights.
Determine the sample mean of the weights of the juvenile salmon summarized in the frequency distribution.
سؤال
سؤال
Use the frequency distribution to answer the next questions. A sample of 80
juvenile salmon is grouped into the resulting frequency distribution based on their
weights.
Identify the class width, the class midpoints, and the class boundaries.
juvenile salmon is grouped into the resulting frequency distribution based on their
weights.
Identify the class width, the class midpoints, and the class boundaries.
سؤال
Use the frequency distribution to answer the next questions. A sample of 80
juvenile salmon is grouped into the resulting frequency distribution based on their
weights.
Find the sample standard deviation of the weights of the juvenile salmon summarized in the frequency distribution.
juvenile salmon is grouped into the resulting frequency distribution based on their
weights.
Find the sample standard deviation of the weights of the juvenile salmon summarized in the frequency distribution.
سؤال
Use the following data for the next questions. The information below was
generated from a registry of the number of patients waiting for a heart transplant
during the last 10 years.
In 1998, the mean number of patients waiting for a heart transplant was 4000. Convert this data to a z-score.
generated from a registry of the number of patients waiting for a heart transplant
during the last 10 years.
In 1998, the mean number of patients waiting for a heart transplant was 4000. Convert this data to a z-score.
سؤال
Use the following sample data for the following questions. A study of physical
fitness tests for 12 randomly selected Pre-Medical students measured their exercise
capacity (in minutes). The following data resulted:
Construct a box plot for the students' exercise capacity.
fitness tests for 12 randomly selected Pre-Medical students measured their exercise
capacity (in minutes). The following data resulted:
Construct a box plot for the students' exercise capacity.
سؤال
Use the following sample data for the next questions. A study of the
percentage of alcohol content of nine randomly selected expensive beers yielded
the following data:
Using four classes, construct a frequency distribution of the beers' percentage of alcohol content.
percentage of alcohol content of nine randomly selected expensive beers yielded
the following data:
Using four classes, construct a frequency distribution of the beers' percentage of alcohol content.
سؤال
Use the following sample data for the next questions. A study of the
percentage of alcohol content of nine randomly selected expensive beers yielded
the following data:
Find the percentile corresponding to 9% alcohol.
percentage of alcohol content of nine randomly selected expensive beers yielded
the following data:
Find the percentile corresponding to 9% alcohol.
سؤال
سؤال
Use the frequency distribution to answer the next questions. A sample of 272
log jams found in river channels in the Northwest U.S. is grouped into the resulting
frequency distribution based on the width of the channel in which the log jams
were found.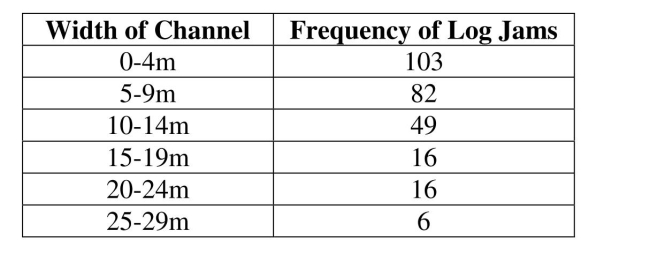
Determine the sample mean of the width of the channels summarized in the frequency distribution.
log jams found in river channels in the Northwest U.S. is grouped into the resulting
frequency distribution based on the width of the channel in which the log jams
were found.
Determine the sample mean of the width of the channels summarized in the frequency distribution.
سؤال
سؤال
Use the frequency distribution to answer the next questions. A sample of 272
log jams found in river channels in the Northwest U.S. is grouped into the resulting
frequency distribution based on the width of the channel in which the log jams
were found.
Construct a corresponding histogram for the width of the channels.
log jams found in river channels in the Northwest U.S. is grouped into the resulting
frequency distribution based on the width of the channel in which the log jams
were found.
Construct a corresponding histogram for the width of the channels.
سؤال
سؤال
Use the following sample data for the next questions. A study of the
percentage of alcohol content of nine randomly selected expensive beers yielded
the following data:
Construct a box plot for the beers' percentage of alcohol content.
percentage of alcohol content of nine randomly selected expensive beers yielded
the following data:
Construct a box plot for the beers' percentage of alcohol content.
سؤال
Use the following data for the next questions. Dental researchers found that a
sample of females scored the following on the Dental Hygiene Fear Survey:
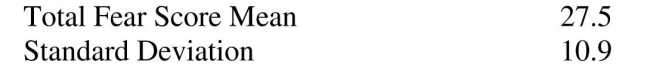
Convert a total fear score of 10 to a z-score.
sample of females scored the following on the Dental Hygiene Fear Survey:
Convert a total fear score of 10 to a z-score.
سؤال
Use the following sample data for the next questions. A study of the
percentage of alcohol content of nine randomly selected expensive beers yielded
the following data:
Find the standard deviation and the variance for the sample data of the beers' percentage of alcohol content.
percentage of alcohol content of nine randomly selected expensive beers yielded
the following data:
Find the standard deviation and the variance for the sample data of the beers' percentage of alcohol content.
سؤال
Use the following sample data for the next questions. A study of the
percentage of alcohol content of nine randomly selected expensive beers yielded
the following data:
Construct a stem and leaf plot of the beers' percentage of alcohol content.
percentage of alcohol content of nine randomly selected expensive beers yielded
the following data:
Construct a stem and leaf plot of the beers' percentage of alcohol content.
سؤال
Use the following data for the next questions. Dental researchers found that a
sample of females scored the following on the Dental Hygiene Fear Survey:
Convert a total fear score of 35 to a z-score.
sample of females scored the following on the Dental Hygiene Fear Survey:
Convert a total fear score of 35 to a z-score.
سؤال
Use the following sample data for the next questions. A study of the
percentage of alcohol content of nine randomly selected expensive beers yielded
the following data:
Find the sample data value corresponding to .
.
percentage of alcohol content of nine randomly selected expensive beers yielded
the following data:
Find the sample data value corresponding to
. سؤال
Use the following sample data for the next questions. A study of the
percentage of alcohol content of nine randomly selected expensive beers yielded
the following data:
Find the mean, the median, and the mode for the beers' percentage of alcohol content.
percentage of alcohol content of nine randomly selected expensive beers yielded
the following data:
Find the mean, the median, and the mode for the beers' percentage of alcohol content.
سؤال
سؤال
Use the following data for the next questions. Dental researchers found that a
sample of females scored the following on the Dental Hygiene Fear Survey:
Using the Empirical Rule, what is the approximate percentage of females with a total fear score between 16.6 and 38.4?
sample of females scored the following on the Dental Hygiene Fear Survey:
Using the Empirical Rule, what is the approximate percentage of females with a total fear score between 16.6 and 38.4?
سؤال
Use the following sample data for the next questions. A study of the
percentage of alcohol content of nine randomly selected expensive beers yielded
the following data:
Identify the five number summary for the beers' percentage of alcohol content.
percentage of alcohol content of nine randomly selected expensive beers yielded
the following data:
Identify the five number summary for the beers' percentage of alcohol content.
سؤال
Use the frequency distribution to answer the next questions. A sample of 272
log jams found in river channels in the Northwest U.S. is grouped into the resulting
frequency distribution based on the width of the channel in which the log jams
were found.
Find the sample standard deviation of the width of the channels summarized in the frequency distribution.
log jams found in river channels in the Northwest U.S. is grouped into the resulting
frequency distribution based on the width of the channel in which the log jams
were found.
Find the sample standard deviation of the width of the channels summarized in the frequency distribution.
سؤال
Use the following data for the next questions. Dental researchers found that a
sample of females scored the following on the Dental Hygiene Fear Survey:
Use the Range Rule of Thumb to estimate the minimum and maximum "usual" total fear score for females.
sample of females scored the following on the Dental Hygiene Fear Survey:
Use the Range Rule of Thumb to estimate the minimum and maximum "usual" total fear score for females.
سؤال
Use the frequency distribution to answer the next questions. A sample of 272
log jams found in river channels in the Northwest U.S. is grouped into the resulting
frequency distribution based on the width of the channel in which the log jams
were found.
Identify the class width, the class midpoints, and the class boundaries.
log jams found in river channels in the Northwest U.S. is grouped into the resulting
frequency distribution based on the width of the channel in which the log jams
were found.
Identify the class width, the class midpoints, and the class boundaries.

فتح الحزمة
قم بالتسجيل لفتح البطاقات في هذه المجموعة!
Unlock Deck
Unlock Deck
1/40
العب
ملء الشاشة (f)
Deck 2: Describing, Exploring, and Comparing Data
1
Use the following sample data for the following questions. A study of physical
fitness tests for 12 randomly selected Pre-Medical students measured their exercise
capacity (in minutes). The following data resulted:
Find the sample data value corresponding to P24 .
fitness tests for 12 randomly selected Pre-Medical students measured their exercise
capacity (in minutes). The following data resulted:
Find the sample data value corresponding to P24 .
30
2
Use the following sample data for the following questions. A study of physical
fitness tests for 12 randomly selected Pre-Medical students measured their exercise
capacity (in minutes). The following data resulted:
Using five classes, construct a frequency distribution of the students' exercise capacity.
fitness tests for 12 randomly selected Pre-Medical students measured their exercise
capacity (in minutes). The following data resulted:
Using five classes, construct a frequency distribution of the students' exercise capacity.
3
Use the following sample data for the following questions. A study of physical
fitness tests for 12 randomly selected Pre-Medical students measured their exercise
capacity (in minutes). The following data resulted:
Find the mean, the median, and the mode for the students' exercise capacity.
fitness tests for 12 randomly selected Pre-Medical students measured their exercise
capacity (in minutes). The following data resulted:
Find the mean, the median, and the mode for the students' exercise capacity.
4
Use the following sample data for the following questions. A study of physical
fitness tests for 12 randomly selected Pre-Medical students measured their exercise
capacity (in minutes). The following data resulted:
Find the percentile corresponding to 36 minutes.
fitness tests for 12 randomly selected Pre-Medical students measured their exercise
capacity (in minutes). The following data resulted:
Find the percentile corresponding to 36 minutes.
فتح الحزمة
افتح القفل للوصول البطاقات البالغ عددها 40 في هذه المجموعة.
فتح الحزمة
k this deck
5
If a Pie Chart were constructed for the weights of the salmon, what would be the measure of the central angle for the class weighing 200-249 grams?
A) 67.5°
B) 112.5°
C) 45°
D) 135°
A) 67.5°
B) 112.5°
C) 45°
D) 135°
فتح الحزمة
افتح القفل للوصول البطاقات البالغ عددها 40 في هذه المجموعة.
فتح الحزمة
k this deck
6
Use the following sample data for the following questions. A study of physical
fitness tests for 12 randomly selected Pre-Medical students measured their exercise
capacity (in minutes). The following data resulted:
Find the standard deviation and the variance for the sample data of the students' exercise capacity.
fitness tests for 12 randomly selected Pre-Medical students measured their exercise
capacity (in minutes). The following data resulted:
Find the standard deviation and the variance for the sample data of the students' exercise capacity.
فتح الحزمة
افتح القفل للوصول البطاقات البالغ عددها 40 في هذه المجموعة.
فتح الحزمة
k this deck
7
Use the following data for the next questions. The information below was
generated from a registry of the number of patients waiting for a heart transplant
during the last 10 years.
Using the Empirical Rule, what is the approximate percentage of people waiting for a heart between 2505 and 4695 patients?
generated from a registry of the number of patients waiting for a heart transplant
during the last 10 years.
Using the Empirical Rule, what is the approximate percentage of people waiting for a heart between 2505 and 4695 patients?
فتح الحزمة
افتح القفل للوصول البطاقات البالغ عددها 40 في هذه المجموعة.
فتح الحزمة
k this deck
8
Use the following data for the next questions. The information below was
generated from a registry of the number of patients waiting for a heart transplant
during the last 10 years.
In 2003, the mean number of patients waiting for a heart transplant was 3400. Convert this data to a z-score.
generated from a registry of the number of patients waiting for a heart transplant
during the last 10 years.
In 2003, the mean number of patients waiting for a heart transplant was 3400. Convert this data to a z-score.
فتح الحزمة
افتح القفل للوصول البطاقات البالغ عددها 40 في هذه المجموعة.
فتح الحزمة
k this deck
9
The distribution of the histogram for the weights of the juvenile salmon appears:
A) Normal
B) Skewed left
C) Uniform
D) Skewed right
A) Normal
B) Skewed left
C) Uniform
D) Skewed right
فتح الحزمة
افتح القفل للوصول البطاقات البالغ عددها 40 في هذه المجموعة.
فتح الحزمة
k this deck
10
If a cumulative frequency distribution were constructed for the weights of the salmon, what would be the cumulative frequency for the class weighing less than 200 grams?
A) 15
B) 25
C) 55
D) 80
A) 15
B) 25
C) 55
D) 80
فتح الحزمة
افتح القفل للوصول البطاقات البالغ عددها 40 في هذه المجموعة.
فتح الحزمة
k this deck
11
Use the frequency distribution to answer the next questions. A sample of 80
juvenile salmon is grouped into the resulting frequency distribution based on their
weights.
Construct a corresponding histogram for the weights of the juvenile salmon.
juvenile salmon is grouped into the resulting frequency distribution based on their
weights.
Construct a corresponding histogram for the weights of the juvenile salmon.
فتح الحزمة
افتح القفل للوصول البطاقات البالغ عددها 40 في هذه المجموعة.
فتح الحزمة
k this deck
12
Use the following sample data for the following questions. A study of physical
fitness tests for 12 randomly selected Pre-Medical students measured their exercise
capacity (in minutes). The following data resulted:
Construct a stem and leaf plot of the students' exercise capacity.
fitness tests for 12 randomly selected Pre-Medical students measured their exercise
capacity (in minutes). The following data resulted:
Construct a stem and leaf plot of the students' exercise capacity.
فتح الحزمة
افتح القفل للوصول البطاقات البالغ عددها 40 في هذه المجموعة.
فتح الحزمة
k this deck
13
Use the following sample data for the following questions. A study of physical
fitness tests for 12 randomly selected Pre-Medical students measured their exercise
capacity (in minutes). The following data resulted:
Identify the five number summary for the students' exercise capacity.
fitness tests for 12 randomly selected Pre-Medical students measured their exercise
capacity (in minutes). The following data resulted:
Identify the five number summary for the students' exercise capacity.
فتح الحزمة
افتح القفل للوصول البطاقات البالغ عددها 40 في هذه المجموعة.
فتح الحزمة
k this deck
14
Use the following data for the next questions. The information below was
generated from a registry of the number of patients waiting for a heart transplant
during the last 10 years.
Use the Range Rule of Thumb to estimate the minimum and maximum "usual" number of patients waiting for a heart.
generated from a registry of the number of patients waiting for a heart transplant
during the last 10 years.
Use the Range Rule of Thumb to estimate the minimum and maximum "usual" number of patients waiting for a heart.
فتح الحزمة
افتح القفل للوصول البطاقات البالغ عددها 40 في هذه المجموعة.
فتح الحزمة
k this deck
15
Use the frequency distribution to answer the next questions. A sample of 80
juvenile salmon is grouped into the resulting frequency distribution based on their
weights.
Determine the sample mean of the weights of the juvenile salmon summarized in the frequency distribution.
juvenile salmon is grouped into the resulting frequency distribution based on their
weights.
Determine the sample mean of the weights of the juvenile salmon summarized in the frequency distribution.
فتح الحزمة
افتح القفل للوصول البطاقات البالغ عددها 40 في هذه المجموعة.
فتح الحزمة
k this deck
16
If a relative frequency distribution were constructed for the weights of the salmon, what would be the relative frequency for the class weighing 150-199 grams?
A) 12.5%
B) 31.25%
C) 18.75%
D) 37.5%
A) 12.5%
B) 31.25%
C) 18.75%
D) 37.5%
فتح الحزمة
افتح القفل للوصول البطاقات البالغ عددها 40 في هذه المجموعة.
فتح الحزمة
k this deck
17
Use the frequency distribution to answer the next questions. A sample of 80
juvenile salmon is grouped into the resulting frequency distribution based on their
weights.
Identify the class width, the class midpoints, and the class boundaries.
juvenile salmon is grouped into the resulting frequency distribution based on their
weights.
Identify the class width, the class midpoints, and the class boundaries.
فتح الحزمة
افتح القفل للوصول البطاقات البالغ عددها 40 في هذه المجموعة.
فتح الحزمة
k this deck
18
Use the frequency distribution to answer the next questions. A sample of 80
juvenile salmon is grouped into the resulting frequency distribution based on their
weights.
Find the sample standard deviation of the weights of the juvenile salmon summarized in the frequency distribution.
juvenile salmon is grouped into the resulting frequency distribution based on their
weights.
Find the sample standard deviation of the weights of the juvenile salmon summarized in the frequency distribution.
فتح الحزمة
افتح القفل للوصول البطاقات البالغ عددها 40 في هذه المجموعة.
فتح الحزمة
k this deck
19
Use the following data for the next questions. The information below was
generated from a registry of the number of patients waiting for a heart transplant
during the last 10 years.
In 1998, the mean number of patients waiting for a heart transplant was 4000. Convert this data to a z-score.
generated from a registry of the number of patients waiting for a heart transplant
during the last 10 years.
In 1998, the mean number of patients waiting for a heart transplant was 4000. Convert this data to a z-score.
فتح الحزمة
افتح القفل للوصول البطاقات البالغ عددها 40 في هذه المجموعة.
فتح الحزمة
k this deck
20
Use the following sample data for the following questions. A study of physical
fitness tests for 12 randomly selected Pre-Medical students measured their exercise
capacity (in minutes). The following data resulted:
Construct a box plot for the students' exercise capacity.
fitness tests for 12 randomly selected Pre-Medical students measured their exercise
capacity (in minutes). The following data resulted:
Construct a box plot for the students' exercise capacity.
فتح الحزمة
افتح القفل للوصول البطاقات البالغ عددها 40 في هذه المجموعة.
فتح الحزمة
k this deck
21
Use the following sample data for the next questions. A study of the
percentage of alcohol content of nine randomly selected expensive beers yielded
the following data:
Using four classes, construct a frequency distribution of the beers' percentage of alcohol content.
percentage of alcohol content of nine randomly selected expensive beers yielded
the following data:
Using four classes, construct a frequency distribution of the beers' percentage of alcohol content.
فتح الحزمة
افتح القفل للوصول البطاقات البالغ عددها 40 في هذه المجموعة.
فتح الحزمة
k this deck
22
Use the following sample data for the next questions. A study of the
percentage of alcohol content of nine randomly selected expensive beers yielded
the following data:
Find the percentile corresponding to 9% alcohol.
percentage of alcohol content of nine randomly selected expensive beers yielded
the following data:
Find the percentile corresponding to 9% alcohol.
فتح الحزمة
افتح القفل للوصول البطاقات البالغ عددها 40 في هذه المجموعة.
فتح الحزمة
k this deck
23
If a cumulative frequency distribution were constructed for the width of the channels, what would be the cumulative frequency for the class width less than 10m?
A) 103
B) 234
C) 185
D) 250
A) 103
B) 234
C) 185
D) 250
فتح الحزمة
افتح القفل للوصول البطاقات البالغ عددها 40 في هذه المجموعة.
فتح الحزمة
k this deck
24
Use the frequency distribution to answer the next questions. A sample of 272
log jams found in river channels in the Northwest U.S. is grouped into the resulting
frequency distribution based on the width of the channel in which the log jams
were found.
Determine the sample mean of the width of the channels summarized in the frequency distribution.
log jams found in river channels in the Northwest U.S. is grouped into the resulting
frequency distribution based on the width of the channel in which the log jams
were found.
Determine the sample mean of the width of the channels summarized in the frequency distribution.
فتح الحزمة
افتح القفل للوصول البطاقات البالغ عددها 40 في هذه المجموعة.
فتح الحزمة
k this deck
25
If a relative frequency distribution were constructed for the width of the channels, what would be the relative frequency for the class with a width of 20-24m?
A) 5.9%
B) 18%
C) 2.2%
D) 30.1%
A) 5.9%
B) 18%
C) 2.2%
D) 30.1%
فتح الحزمة
افتح القفل للوصول البطاقات البالغ عددها 40 في هذه المجموعة.
فتح الحزمة
k this deck
26
Use the frequency distribution to answer the next questions. A sample of 272
log jams found in river channels in the Northwest U.S. is grouped into the resulting
frequency distribution based on the width of the channel in which the log jams
were found.
Construct a corresponding histogram for the width of the channels.
log jams found in river channels in the Northwest U.S. is grouped into the resulting
frequency distribution based on the width of the channel in which the log jams
were found.
Construct a corresponding histogram for the width of the channels.
فتح الحزمة
افتح القفل للوصول البطاقات البالغ عددها 40 في هذه المجموعة.
فتح الحزمة
k this deck
27
The distribution of the histogram for the width of the channels appears:
A) Normal
B) Skewed left
C) Uniform
D) Skewed right
A) Normal
B) Skewed left
C) Uniform
D) Skewed right
فتح الحزمة
افتح القفل للوصول البطاقات البالغ عددها 40 في هذه المجموعة.
فتح الحزمة
k this deck
28
Use the following sample data for the next questions. A study of the
percentage of alcohol content of nine randomly selected expensive beers yielded
the following data:
Construct a box plot for the beers' percentage of alcohol content.
percentage of alcohol content of nine randomly selected expensive beers yielded
the following data:
Construct a box plot for the beers' percentage of alcohol content.
فتح الحزمة
افتح القفل للوصول البطاقات البالغ عددها 40 في هذه المجموعة.
فتح الحزمة
k this deck
29
Use the following data for the next questions. Dental researchers found that a
sample of females scored the following on the Dental Hygiene Fear Survey:
Convert a total fear score of 10 to a z-score.
sample of females scored the following on the Dental Hygiene Fear Survey:
Convert a total fear score of 10 to a z-score.
فتح الحزمة
افتح القفل للوصول البطاقات البالغ عددها 40 في هذه المجموعة.
فتح الحزمة
k this deck
30
Use the following sample data for the next questions. A study of the
percentage of alcohol content of nine randomly selected expensive beers yielded
the following data:
Find the standard deviation and the variance for the sample data of the beers' percentage of alcohol content.
percentage of alcohol content of nine randomly selected expensive beers yielded
the following data:
Find the standard deviation and the variance for the sample data of the beers' percentage of alcohol content.
فتح الحزمة
افتح القفل للوصول البطاقات البالغ عددها 40 في هذه المجموعة.
فتح الحزمة
k this deck
31
Use the following sample data for the next questions. A study of the
percentage of alcohol content of nine randomly selected expensive beers yielded
the following data:
Construct a stem and leaf plot of the beers' percentage of alcohol content.
percentage of alcohol content of nine randomly selected expensive beers yielded
the following data:
Construct a stem and leaf plot of the beers' percentage of alcohol content.
فتح الحزمة
افتح القفل للوصول البطاقات البالغ عددها 40 في هذه المجموعة.
فتح الحزمة
k this deck
32
Use the following data for the next questions. Dental researchers found that a
sample of females scored the following on the Dental Hygiene Fear Survey:
Convert a total fear score of 35 to a z-score.
sample of females scored the following on the Dental Hygiene Fear Survey:
Convert a total fear score of 35 to a z-score.
فتح الحزمة
افتح القفل للوصول البطاقات البالغ عددها 40 في هذه المجموعة.
فتح الحزمة
k this deck
33
Use the following sample data for the next questions. A study of the
percentage of alcohol content of nine randomly selected expensive beers yielded
the following data:
Find the sample data value corresponding to .
percentage of alcohol content of nine randomly selected expensive beers yielded
the following data:
Find the sample data value corresponding to
. فتح الحزمة
افتح القفل للوصول البطاقات البالغ عددها 40 في هذه المجموعة.
فتح الحزمة
k this deck
34
Use the following sample data for the next questions. A study of the
percentage of alcohol content of nine randomly selected expensive beers yielded
the following data:
Find the mean, the median, and the mode for the beers' percentage of alcohol content.
percentage of alcohol content of nine randomly selected expensive beers yielded
the following data:
Find the mean, the median, and the mode for the beers' percentage of alcohol content.
فتح الحزمة
افتح القفل للوصول البطاقات البالغ عددها 40 في هذه المجموعة.
فتح الحزمة
k this deck
35
If a Pie Chart were constructed for the width of the channels, what would be the measure of the central angle for the class width 10-14m?
A) 21.2°
B) 136.3°
C) 108.5°
D) 64.9°
A) 21.2°
B) 136.3°
C) 108.5°
D) 64.9°
فتح الحزمة
افتح القفل للوصول البطاقات البالغ عددها 40 في هذه المجموعة.
فتح الحزمة
k this deck
36
Use the following data for the next questions. Dental researchers found that a
sample of females scored the following on the Dental Hygiene Fear Survey:
Using the Empirical Rule, what is the approximate percentage of females with a total fear score between 16.6 and 38.4?
sample of females scored the following on the Dental Hygiene Fear Survey:
Using the Empirical Rule, what is the approximate percentage of females with a total fear score between 16.6 and 38.4?
فتح الحزمة
افتح القفل للوصول البطاقات البالغ عددها 40 في هذه المجموعة.
فتح الحزمة
k this deck
37
Use the following sample data for the next questions. A study of the
percentage of alcohol content of nine randomly selected expensive beers yielded
the following data:
Identify the five number summary for the beers' percentage of alcohol content.
percentage of alcohol content of nine randomly selected expensive beers yielded
the following data:
Identify the five number summary for the beers' percentage of alcohol content.
فتح الحزمة
افتح القفل للوصول البطاقات البالغ عددها 40 في هذه المجموعة.
فتح الحزمة
k this deck
38
Use the frequency distribution to answer the next questions. A sample of 272
log jams found in river channels in the Northwest U.S. is grouped into the resulting
frequency distribution based on the width of the channel in which the log jams
were found.
Find the sample standard deviation of the width of the channels summarized in the frequency distribution.
log jams found in river channels in the Northwest U.S. is grouped into the resulting
frequency distribution based on the width of the channel in which the log jams
were found.
Find the sample standard deviation of the width of the channels summarized in the frequency distribution.
فتح الحزمة
افتح القفل للوصول البطاقات البالغ عددها 40 في هذه المجموعة.
فتح الحزمة
k this deck
39
Use the following data for the next questions. Dental researchers found that a
sample of females scored the following on the Dental Hygiene Fear Survey:
Use the Range Rule of Thumb to estimate the minimum and maximum "usual" total fear score for females.
sample of females scored the following on the Dental Hygiene Fear Survey:
Use the Range Rule of Thumb to estimate the minimum and maximum "usual" total fear score for females.
فتح الحزمة
افتح القفل للوصول البطاقات البالغ عددها 40 في هذه المجموعة.
فتح الحزمة
k this deck
40
Use the frequency distribution to answer the next questions. A sample of 272
log jams found in river channels in the Northwest U.S. is grouped into the resulting
frequency distribution based on the width of the channel in which the log jams
were found.
Identify the class width, the class midpoints, and the class boundaries.
log jams found in river channels in the Northwest U.S. is grouped into the resulting
frequency distribution based on the width of the channel in which the log jams
were found.
Identify the class width, the class midpoints, and the class boundaries.
فتح الحزمة
افتح القفل للوصول البطاقات البالغ عددها 40 في هذه المجموعة.
فتح الحزمة
k this deck
فتح الحزمة
افتح القفل للوصول البطاقات البالغ عددها 40 في هذه المجموعة.


