Deck 9: Correlation and Regression
ملء الشاشة (f)
سؤال
سؤال
Use the following sample data to answer the next questions. The paired data
consist of the cost of regionally advertising (in thousands of dollars) a certain
pharmaceutical drug and the number of new prescriptions written (in thousands).

Find the standard error of estimate .
.
consist of the cost of regionally advertising (in thousands of dollars) a certain
pharmaceutical drug and the number of new prescriptions written (in thousands).
Find the standard error of estimate
. سؤال
Use the following sample data to answer the next questions. The paired data
consist of the cost of regionally advertising (in thousands of dollars) a certain
pharmaceutical drug and the number of new prescriptions written (in thousands).
Find the predicted value of the number of new prescriptions written if $7000 is spent in regional advertising.
consist of the cost of regionally advertising (in thousands of dollars) a certain
pharmaceutical drug and the number of new prescriptions written (in thousands).
Find the predicted value of the number of new prescriptions written if $7000 is spent in regional advertising.
سؤال
Use the following display for the next questions. The display is based on a sample of hybrid cars, SUVs, and trucks. The dependent variable is the annual greenhouse gas emissions (in tons). The independent variables are as follows:
combination miles per gallon (Mpg), engine size in liters (ES), and number of
cylinders (Cyl).
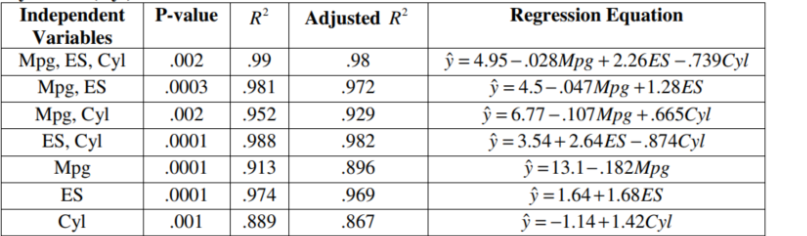
Identify the value of the multiple coefficient of determination for the multiple regression equation that expresses the annual greenhouse gas emissions in terms of engine size and number of cylinders.
combination miles per gallon (Mpg), engine size in liters (ES), and number of
cylinders (Cyl).
Identify the value of the multiple coefficient of determination
for the multiple regression equation that expresses the annual greenhouse gas emissions in terms of engine size and number of cylinders. سؤال
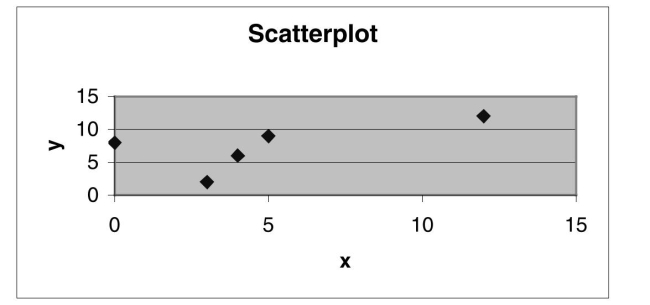
Use the following sample data for the next three questions. Assume the sample of paired (x, y) data is a random sample.

Construct a scatterplot.
Construct a scatterplot.
سؤال
Use the following sample data for the next three questions. Assume the sample of paired (x, y) data is a random sample.
Find the value of the linear correlation coefficient r .
Find the value of the linear correlation coefficient r .
سؤال
سؤال
Use the following display for the next questions. The display is based on a sample of hybrid cars, SUVs, and trucks. The dependent variable is the annual greenhouse gas emissions (in tons). The independent variables are as follows:
combination miles per gallon (Mpg), engine size in liters (ES), and number of
cylinders (Cyl).
Identify the P-value corresponding to the overall significance of the multiple regression equation that expresses the annual greenhouse gas emissions in terms of miles per gallon and number of cylinders.
combination miles per gallon (Mpg), engine size in liters (ES), and number of
cylinders (Cyl).
Identify the P-value corresponding to the overall significance of the multiple regression equation that expresses the annual greenhouse gas emissions in terms of miles per gallon and number of cylinders.
سؤال
Use the following display for the next questions. The display is based on a sample of hybrid cars, SUVs, and trucks. The dependent variable is the annual greenhouse gas emissions (in tons). The independent variables are as follows:
combination miles per gallon (Mpg), engine size in liters (ES), and number of
cylinders (Cyl).
If only one independent variable is used to predict the annual greenhouse gas emissions, which single variable is best?
combination miles per gallon (Mpg), engine size in liters (ES), and number of
cylinders (Cyl).
If only one independent variable is used to predict the annual greenhouse gas emissions, which single variable is best?
سؤال
Use the following display for the next questions. The display is based on
sample annual data relating to the ozone layer monitoring at Halley Station in
Antarctica. The dependent variable is the year. The independent variables are as
follows: the level of ozone in Dobson units (DU), the global temperature (Temp, in
°C ), and the United States chlorofluorocarbon (CFC) gases production (in
thousands of metric tons).
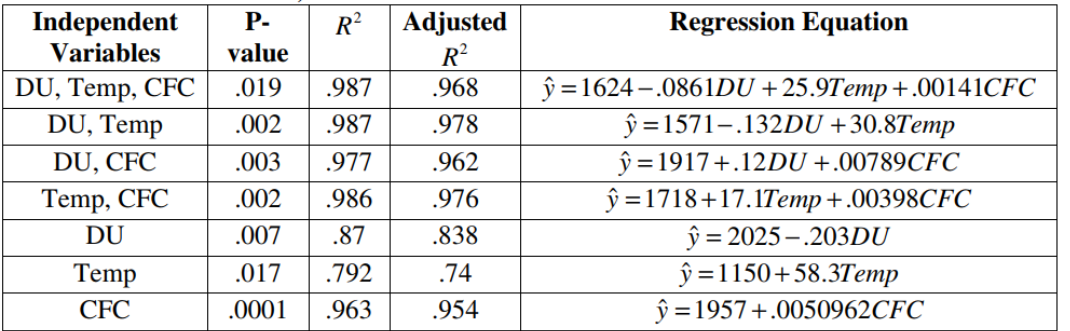
Identify the multiple regression equation that expresses the year in terms of ozone level, global temperature, and US production of CFCs.
sample annual data relating to the ozone layer monitoring at Halley Station in
Antarctica. The dependent variable is the year. The independent variables are as
follows: the level of ozone in Dobson units (DU), the global temperature (Temp, in
°C ), and the United States chlorofluorocarbon (CFC) gases production (in
thousands of metric tons).
Identify the multiple regression equation that expresses the year in terms of ozone level, global temperature, and US production of CFCs.
سؤال
Use the following display for the next questions. The display is based on a sample of hybrid cars, SUVs, and trucks. The dependent variable is the annual greenhouse gas emissions (in tons). The independent variables are as follows:
combination miles per gallon (Mpg), engine size in liters (ES), and number of
cylinders (Cyl).
Which regression equation appears to be best for predicting the annual greenhouse gas emissions?
combination miles per gallon (Mpg), engine size in liters (ES), and number of
cylinders (Cyl).
Which regression equation appears to be best for predicting the annual greenhouse gas emissions?
سؤال
Use the following display for the next questions. The display is based on a sample of hybrid cars, SUVs, and trucks. The dependent variable is the annual greenhouse gas emissions (in tons). The independent variables are as follows:
combination miles per gallon (Mpg), engine size in liters (ES), and number of
cylinders (Cyl).
Identify the adjusted coefficient of determination for the multiple regression equation that expresses the annual greenhouse gas emissions in terms of miles per gallon, engine size, and number of cylinders.
combination miles per gallon (Mpg), engine size in liters (ES), and number of
cylinders (Cyl).
Identify the adjusted coefficient of determination
for the multiple regression equation that expresses the annual greenhouse gas emissions in terms of miles per gallon, engine size, and number of cylinders. سؤال
سؤال
Use the following display for the next questions. The display is based on
sample annual data relating to the ozone layer monitoring at Halley Station in
Antarctica. The dependent variable is the year. The independent variables are as
follows: the level of ozone in Dobson units (DU), the global temperature (Temp, in
°C ), and the United States chlorofluorocarbon (CFC) gases production (in
thousands of metric tons).
Identify the P-value corresponding to the overall significance of the multiple regression equation that expresses the year in terms of global temperature and US production of CFCs.
سؤال
Use the following display for the next questions. The display is based on a sample of hybrid cars, SUVs, and trucks. The dependent variable is the annual greenhouse gas emissions (in tons). The independent variables are as follows:
combination miles per gallon (Mpg), engine size in liters (ES), and number of
cylinders (Cyl).
If exactly two independent variables are to be used to predict the annual greenhouse gas emissions, which two variables should be chosen?
combination miles per gallon (Mpg), engine size in liters (ES), and number of
cylinders (Cyl).
If exactly two independent variables are to be used to predict the annual greenhouse gas emissions, which two variables should be chosen?
سؤال
سؤال
سؤال
Use the following display for the next questions. The display is based on a sample of hybrid cars, SUVs, and trucks. The dependent variable is the annual greenhouse gas emissions (in tons). The independent variables are as follows:
combination miles per gallon (Mpg), engine size in liters (ES), and number of
cylinders (Cyl).
Identify the multiple regression equation that expresses the annual greenhouse gas emissions in terms of miles per gallon, engine size, and number of cylinders.
combination miles per gallon (Mpg), engine size in liters (ES), and number of
cylinders (Cyl).
Identify the multiple regression equation that expresses the annual greenhouse gas emissions in terms of miles per gallon, engine size, and number of cylinders.
سؤال
Use the following sample data for the next three questions. Assume the sample of paired (x, y) data is a random sample.
Use a significance level of .05 to determine whether there is a significant linear correlation between the two variables.
Use a significance level of .05 to determine whether there is a significant linear correlation between the two variables.
سؤال
سؤال
Use the following display for the next questions. The display is based on
sample annual data relating to the ozone layer monitoring at Halley Station in
Antarctica. The dependent variable is the year. The independent variables are as
follows: the level of ozone in Dobson units (DU), the global temperature (Temp, in
°C ), and the United States chlorofluorocarbon (CFC) gases production (in
thousands of metric tons).
Identify the adjusted coefficient of determination for the multiple regression equation that expresses the year in terms of ozone level, global temperature, and US production of CFCs.
sample annual data relating to the ozone layer monitoring at Halley Station in
Antarctica. The dependent variable is the year. The independent variables are as
follows: the level of ozone in Dobson units (DU), the global temperature (Temp, in
°C ), and the United States chlorofluorocarbon (CFC) gases production (in
thousands of metric tons).
Identify the adjusted coefficient of determination
for the multiple regression equation that expresses the year in terms of ozone level, global temperature, and US production of CFCs. سؤال
Use the following display for the next questions. The display is based on
sample annual data relating to the ozone layer monitoring at Halley Station in
Antarctica. The dependent variable is the year. The independent variables are as
follows: the level of ozone in Dobson units (DU), the global temperature (Temp, in
°C ), and the United States chlorofluorocarbon (CFC) gases production (in
thousands of metric tons).
Identify the value of the multiple coefficient of determination for the multiple regression equation that expresses the year in terms of ozone level and global temperature.
sample annual data relating to the ozone layer monitoring at Halley Station in
Antarctica. The dependent variable is the year. The independent variables are as
follows: the level of ozone in Dobson units (DU), the global temperature (Temp, in
°C ), and the United States chlorofluorocarbon (CFC) gases production (in
thousands of metric tons).
Identify the value of the multiple coefficient of determination
for the multiple regression equation that expresses the year in terms of ozone level and global temperature. سؤال
Use the following display for the next questions. The display is based on
sample annual data relating to the ozone layer monitoring at Halley Station in
Antarctica. The dependent variable is the year. The independent variables are as
follows: the level of ozone in Dobson units (DU), the global temperature (Temp, in
°C ), and the United States chlorofluorocarbon (CFC) gases production (in
thousands of metric tons).
If exactly two independent variables are to be used to predict the year, which two variables should be chosen?
سؤال
Use the following display for the next questions. The display is based on
sample annual data relating to the ozone layer monitoring at Halley Station in
Antarctica. The dependent variable is the year. The independent variables are as
follows: the level of ozone in Dobson units (DU), the global temperature (Temp, in
°C ), and the United States chlorofluorocarbon (CFC) gases production (in
thousands of metric tons).
If only one independent variable is used to predict the year, which single variable is best?
سؤال
Use the following display for the next questions. The display is based on
sample annual data relating to the ozone layer monitoring at Halley Station in
Antarctica. The dependent variable is the year. The independent variables are as
follows: the level of ozone in Dobson units (DU), the global temperature (Temp, in
°C ), and the United States chlorofluorocarbon (CFC) gases production (in
thousands of metric tons).
Which regression equation appears to be best for predicting the year?

فتح الحزمة
قم بالتسجيل لفتح البطاقات في هذه المجموعة!
Unlock Deck
Unlock Deck
1/25
العب
ملء الشاشة (f)
Deck 9: Correlation and Regression
1
For the next questions, identify the choice that contains a conclusion with a common correlation error.
Construct a scatterplot.
Construct a scatterplot.
2
Use the following sample data to answer the next questions. The paired data
consist of the cost of regionally advertising (in thousands of dollars) a certain
pharmaceutical drug and the number of new prescriptions written (in thousands).
Find the standard error of estimate .
consist of the cost of regionally advertising (in thousands of dollars) a certain
pharmaceutical drug and the number of new prescriptions written (in thousands).
Find the standard error of estimate
.
3
Use the following sample data to answer the next questions. The paired data
consist of the cost of regionally advertising (in thousands of dollars) a certain
pharmaceutical drug and the number of new prescriptions written (in thousands).
Find the predicted value of the number of new prescriptions written if $7000 is spent in regional advertising.
consist of the cost of regionally advertising (in thousands of dollars) a certain
pharmaceutical drug and the number of new prescriptions written (in thousands).
Find the predicted value of the number of new prescriptions written if $7000 is spent in regional advertising.
75,330
4
Use the following display for the next questions. The display is based on a sample of hybrid cars, SUVs, and trucks. The dependent variable is the annual greenhouse gas emissions (in tons). The independent variables are as follows:
combination miles per gallon (Mpg), engine size in liters (ES), and number of
cylinders (Cyl).
Identify the value of the multiple coefficient of determination for the multiple regression equation that expresses the annual greenhouse gas emissions in terms of engine size and number of cylinders.
combination miles per gallon (Mpg), engine size in liters (ES), and number of
cylinders (Cyl).
Identify the value of the multiple coefficient of determination
for the multiple regression equation that expresses the annual greenhouse gas emissions in terms of engine size and number of cylinders. فتح الحزمة
افتح القفل للوصول البطاقات البالغ عددها 25 في هذه المجموعة.
فتح الحزمة
k this deck
5
Use the following sample data for the next three questions. Assume the sample of paired (x, y) data is a random sample.
Construct a scatterplot.
Construct a scatterplot.
فتح الحزمة
افتح القفل للوصول البطاقات البالغ عددها 25 في هذه المجموعة.
فتح الحزمة
k this deck
6
Use the following sample data for the next three questions. Assume the sample of paired (x, y) data is a random sample.
Find the value of the linear correlation coefficient r .
Find the value of the linear correlation coefficient r .
فتح الحزمة
افتح القفل للوصول البطاقات البالغ عددها 25 في هذه المجموعة.
فتح الحزمة
k this deck
7
For the next questions, identify the choice that contains a conclusion with a
common correlation error.
Given: There is a linear correlation coefficient very close to 0 between black willow tree cuttings monitored for survival at 7 days and black willow tree cuttings monitored for survival at 14 days
A) Conclusion: there is not a linear relationship between the survival of black willow tree cuttings at 7 days and the survival of black willow tree cuttings at 14
Days
B) Conclusion: the survival of black willow tree cuttings at 7 days is not related in any way to the survival of black willow tree cuttings at 14 days
C) Conclusion: an increase in the survival of black willow tree cuttings at 7 days is not linearly related to the survival of black willow tree cuttings at 14 days
D) Conclusion: a decrease in the survival of black willow tree cuttings at 7 days is not linearly related to a decrease in the survival of black willow tree cuttings at
14 days
فتح الحزمة
افتح القفل للوصول البطاقات البالغ عددها 25 في هذه المجموعة.
فتح الحزمة
k this deck
8
Use the following display for the next questions. The display is based on a sample of hybrid cars, SUVs, and trucks. The dependent variable is the annual greenhouse gas emissions (in tons). The independent variables are as follows:
combination miles per gallon (Mpg), engine size in liters (ES), and number of
cylinders (Cyl).
Identify the P-value corresponding to the overall significance of the multiple regression equation that expresses the annual greenhouse gas emissions in terms of miles per gallon and number of cylinders.
combination miles per gallon (Mpg), engine size in liters (ES), and number of
cylinders (Cyl).
Identify the P-value corresponding to the overall significance of the multiple regression equation that expresses the annual greenhouse gas emissions in terms of miles per gallon and number of cylinders.
فتح الحزمة
افتح القفل للوصول البطاقات البالغ عددها 25 في هذه المجموعة.
فتح الحزمة
k this deck
9
Use the following display for the next questions. The display is based on a sample of hybrid cars, SUVs, and trucks. The dependent variable is the annual greenhouse gas emissions (in tons). The independent variables are as follows:
combination miles per gallon (Mpg), engine size in liters (ES), and number of
cylinders (Cyl).
If only one independent variable is used to predict the annual greenhouse gas emissions, which single variable is best?
combination miles per gallon (Mpg), engine size in liters (ES), and number of
cylinders (Cyl).
If only one independent variable is used to predict the annual greenhouse gas emissions, which single variable is best?
فتح الحزمة
افتح القفل للوصول البطاقات البالغ عددها 25 في هذه المجموعة.
فتح الحزمة
k this deck
10
Use the following display for the next questions. The display is based on
sample annual data relating to the ozone layer monitoring at Halley Station in
Antarctica. The dependent variable is the year. The independent variables are as
follows: the level of ozone in Dobson units (DU), the global temperature (Temp, in
°C ), and the United States chlorofluorocarbon (CFC) gases production (in
thousands of metric tons).
Identify the multiple regression equation that expresses the year in terms of ozone level, global temperature, and US production of CFCs.
فتح الحزمة
افتح القفل للوصول البطاقات البالغ عددها 25 في هذه المجموعة.
فتح الحزمة
k this deck
11
Use the following display for the next questions. The display is based on a sample of hybrid cars, SUVs, and trucks. The dependent variable is the annual greenhouse gas emissions (in tons). The independent variables are as follows:
combination miles per gallon (Mpg), engine size in liters (ES), and number of
cylinders (Cyl).
Which regression equation appears to be best for predicting the annual greenhouse gas emissions?
combination miles per gallon (Mpg), engine size in liters (ES), and number of
cylinders (Cyl).
Which regression equation appears to be best for predicting the annual greenhouse gas emissions?
فتح الحزمة
افتح القفل للوصول البطاقات البالغ عددها 25 في هذه المجموعة.
فتح الحزمة
k this deck
12
Use the following display for the next questions. The display is based on a sample of hybrid cars, SUVs, and trucks. The dependent variable is the annual greenhouse gas emissions (in tons). The independent variables are as follows:
combination miles per gallon (Mpg), engine size in liters (ES), and number of
cylinders (Cyl).
Identify the adjusted coefficient of determination for the multiple regression equation that expresses the annual greenhouse gas emissions in terms of miles per gallon, engine size, and number of cylinders.
combination miles per gallon (Mpg), engine size in liters (ES), and number of
cylinders (Cyl).
Identify the adjusted coefficient of determination
for the multiple regression equation that expresses the annual greenhouse gas emissions in terms of miles per gallon, engine size, and number of cylinders. فتح الحزمة
افتح القفل للوصول البطاقات البالغ عددها 25 في هذه المجموعة.
فتح الحزمة
k this deck
13
For the next questions, identify the choice that contains a conclusion with a common correlation error.
Use a significance level of .05 to determine whether there is a significant linear correlation between the two variables.
Use a significance level of .05 to determine whether there is a significant linear correlation between the two variables.
فتح الحزمة
افتح القفل للوصول البطاقات البالغ عددها 25 في هذه المجموعة.
فتح الحزمة
k this deck
14
Use the following display for the next questions. The display is based on
sample annual data relating to the ozone layer monitoring at Halley Station in
Antarctica. The dependent variable is the year. The independent variables are as
follows: the level of ozone in Dobson units (DU), the global temperature (Temp, in
°C ), and the United States chlorofluorocarbon (CFC) gases production (in
thousands of metric tons).
Identify the P-value corresponding to the overall significance of the multiple regression equation that expresses the year in terms of global temperature and US production of CFCs.
فتح الحزمة
افتح القفل للوصول البطاقات البالغ عددها 25 في هذه المجموعة.
فتح الحزمة
k this deck
15
Use the following display for the next questions. The display is based on a sample of hybrid cars, SUVs, and trucks. The dependent variable is the annual greenhouse gas emissions (in tons). The independent variables are as follows:
combination miles per gallon (Mpg), engine size in liters (ES), and number of
cylinders (Cyl).
If exactly two independent variables are to be used to predict the annual greenhouse gas emissions, which two variables should be chosen?
combination miles per gallon (Mpg), engine size in liters (ES), and number of
cylinders (Cyl).
If exactly two independent variables are to be used to predict the annual greenhouse gas emissions, which two variables should be chosen?
فتح الحزمة
افتح القفل للوصول البطاقات البالغ عددها 25 في هذه المجموعة.
فتح الحزمة
k this deck
16
For the next questions, identify the choice that contains a conclusion with a common correlation error.
Given: There is a linear correlation coefficient very close to 0 between mothers who smoked during pregnancy and the incidence of influenza in their babies
A) Conclusion: the frequency of mothers' smoking is not related in any way to the incidence of influenza in their babies
B) Conclusion: an increase in the frequency of mothers' smoking is not linearly related to an increase in the incidence of influenza in their babies
C) Conclusion: a decrease in the frequency of mothers' smoking is not linearly related to a decrease in the incidence of influenza in their babies
D) Conclusion: there is not a linear relationship between the frequency of mothers' smoking and the incidence of influenza in their babies
فتح الحزمة
افتح القفل للوصول البطاقات البالغ عددها 25 في هذه المجموعة.
فتح الحزمة
k this deck
17
For the next questions, identify the choice that contains a conclusion with a common correlation error.
Find the value of the linear correlation coefficient r .
Find the value of the linear correlation coefficient r .
فتح الحزمة
افتح القفل للوصول البطاقات البالغ عددها 25 في هذه المجموعة.
فتح الحزمة
k this deck
18
Use the following display for the next questions. The display is based on a sample of hybrid cars, SUVs, and trucks. The dependent variable is the annual greenhouse gas emissions (in tons). The independent variables are as follows:
combination miles per gallon (Mpg), engine size in liters (ES), and number of
cylinders (Cyl).
Identify the multiple regression equation that expresses the annual greenhouse gas emissions in terms of miles per gallon, engine size, and number of cylinders.
combination miles per gallon (Mpg), engine size in liters (ES), and number of
cylinders (Cyl).
Identify the multiple regression equation that expresses the annual greenhouse gas emissions in terms of miles per gallon, engine size, and number of cylinders.
فتح الحزمة
افتح القفل للوصول البطاقات البالغ عددها 25 في هذه المجموعة.
فتح الحزمة
k this deck
19
Use the following sample data for the next three questions. Assume the sample of paired (x, y) data is a random sample.
Use a significance level of .05 to determine whether there is a significant linear correlation between the two variables.
Use a significance level of .05 to determine whether there is a significant linear correlation between the two variables.
فتح الحزمة
افتح القفل للوصول البطاقات البالغ عددها 25 في هذه المجموعة.
فتح الحزمة
k this deck
20
For the next questions, identify the choice that contains a conclusion with a
common correlation error.
Given: There is a significant linear correlation between cordgrass monitored for survival on the left bank of a creek and cordgrass monitored for survival on the right bank of a creek.
A) Conclusion: r results in a value close to 1
B) Conclusion: an increase in cordgrass survival on the left bank is related to an increase in cordgrass survival on the right bank
C) Conclusion: an decrease in cordgrass survival on the left bank causes a decrease in cordgrass survival on the right bank
D) Conclusion: r results in a value close to -1
فتح الحزمة
افتح القفل للوصول البطاقات البالغ عددها 25 في هذه المجموعة.
فتح الحزمة
k this deck
21
Use the following display for the next questions. The display is based on
sample annual data relating to the ozone layer monitoring at Halley Station in
Antarctica. The dependent variable is the year. The independent variables are as
follows: the level of ozone in Dobson units (DU), the global temperature (Temp, in
°C ), and the United States chlorofluorocarbon (CFC) gases production (in
thousands of metric tons).
Identify the adjusted coefficient of determination for the multiple regression equation that expresses the year in terms of ozone level, global temperature, and US production of CFCs.
sample annual data relating to the ozone layer monitoring at Halley Station in
Antarctica. The dependent variable is the year. The independent variables are as
follows: the level of ozone in Dobson units (DU), the global temperature (Temp, in
°C ), and the United States chlorofluorocarbon (CFC) gases production (in
thousands of metric tons).
Identify the adjusted coefficient of determination
for the multiple regression equation that expresses the year in terms of ozone level, global temperature, and US production of CFCs. فتح الحزمة
افتح القفل للوصول البطاقات البالغ عددها 25 في هذه المجموعة.
فتح الحزمة
k this deck
22
Use the following display for the next questions. The display is based on
sample annual data relating to the ozone layer monitoring at Halley Station in
Antarctica. The dependent variable is the year. The independent variables are as
follows: the level of ozone in Dobson units (DU), the global temperature (Temp, in
°C ), and the United States chlorofluorocarbon (CFC) gases production (in
thousands of metric tons).
Identify the value of the multiple coefficient of determination for the multiple regression equation that expresses the year in terms of ozone level and global temperature.
sample annual data relating to the ozone layer monitoring at Halley Station in
Antarctica. The dependent variable is the year. The independent variables are as
follows: the level of ozone in Dobson units (DU), the global temperature (Temp, in
°C ), and the United States chlorofluorocarbon (CFC) gases production (in
thousands of metric tons).
Identify the value of the multiple coefficient of determination
for the multiple regression equation that expresses the year in terms of ozone level and global temperature. فتح الحزمة
افتح القفل للوصول البطاقات البالغ عددها 25 في هذه المجموعة.
فتح الحزمة
k this deck
23
Use the following display for the next questions. The display is based on
sample annual data relating to the ozone layer monitoring at Halley Station in
Antarctica. The dependent variable is the year. The independent variables are as
follows: the level of ozone in Dobson units (DU), the global temperature (Temp, in
°C ), and the United States chlorofluorocarbon (CFC) gases production (in
thousands of metric tons).
If exactly two independent variables are to be used to predict the year, which two variables should be chosen?
فتح الحزمة
افتح القفل للوصول البطاقات البالغ عددها 25 في هذه المجموعة.
فتح الحزمة
k this deck
24
Use the following display for the next questions. The display is based on
sample annual data relating to the ozone layer monitoring at Halley Station in
Antarctica. The dependent variable is the year. The independent variables are as
follows: the level of ozone in Dobson units (DU), the global temperature (Temp, in
°C ), and the United States chlorofluorocarbon (CFC) gases production (in
thousands of metric tons).
If only one independent variable is used to predict the year, which single variable is best?
فتح الحزمة
افتح القفل للوصول البطاقات البالغ عددها 25 في هذه المجموعة.
فتح الحزمة
k this deck
25
Use the following display for the next questions. The display is based on
sample annual data relating to the ozone layer monitoring at Halley Station in
Antarctica. The dependent variable is the year. The independent variables are as
follows: the level of ozone in Dobson units (DU), the global temperature (Temp, in
°C ), and the United States chlorofluorocarbon (CFC) gases production (in
thousands of metric tons).
Which regression equation appears to be best for predicting the year?
فتح الحزمة
افتح القفل للوصول البطاقات البالغ عددها 25 في هذه المجموعة.
فتح الحزمة
k this deck
فتح الحزمة
افتح القفل للوصول البطاقات البالغ عددها 25 في هذه المجموعة.


