Deck 4: Probability
ملء الشاشة (f)
سؤال
One of the primary feeds for beef cattle is corn. ) 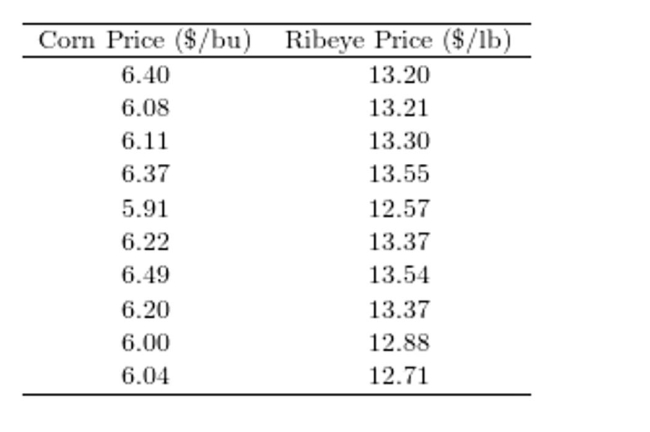 The correlation coefficient between the corn price and the ribeye price is 0.773. Which of the following is the best interpretation of the correlation coefficient?
A)The price of ribeye tends to go down and the price of corn goes up.
B)Increasing corn prices cause ribeye prices to increase.
C)The changes in corn price and ribeye price tend to go up and down together.
D)There is no correlation between the price of corn and the price of ribeye.
The correlation coefficient between the corn price and the ribeye price is 0.773. Which of the following is the best interpretation of the correlation coefficient?A)The price of ribeye tends to go down and the price of corn goes up.
B)Increasing corn prices cause ribeye prices to increase.
C)The changes in corn price and ribeye price tend to go up and down together.
D)There is no correlation between the price of corn and the price of ribeye.
سؤال
The following display from a graphing calculator presents the least-squares regression  Predict the commodity price when oil costs $107 per barrel.
A)$20
B)$44
C)$485
D)$70
Predict the commodity price when oil costs $107 per barrel.A)$20
B)$44
C)$485
D)$70
سؤال
Characterize the relationship shown in the figure. ) 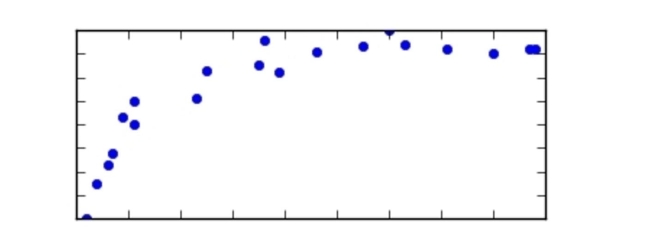
A)negative nonlinear
B)positive nonlinear
C)negative linear
D)positive linear
A)negative nonlinear
B)positive nonlinear
C)negative linear
D)positive linear
سؤال
One of the primary feeds for beef cattle is corn. ) 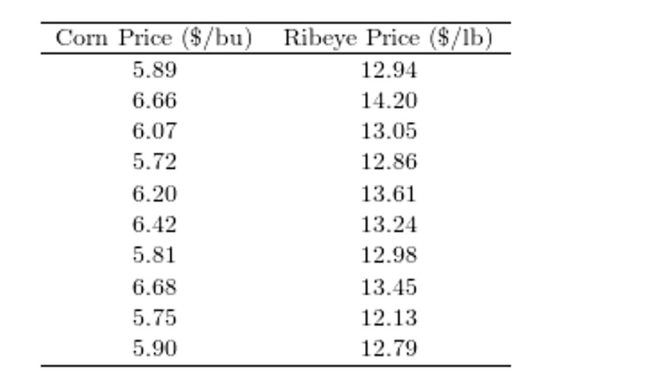 Construct a scatter plot of the price of ribeye (y)versus the price of corn (x). 2
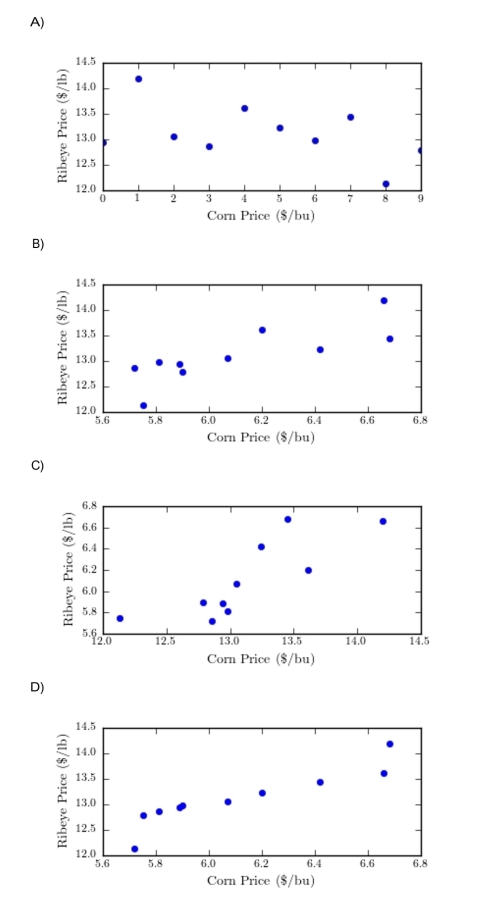
Construct a scatter plot of the price of ribeye (y)versus the price of corn (x). 2 سؤال
Compute the correlation coefficient. 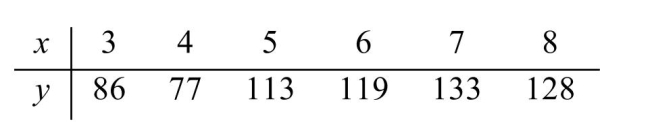
A)0.809
B)0.899
C)48.99
D)0.101
A)0.809
B)0.899
C)48.99
D)0.101
سؤال
The following table presents the number of police officers (per 100,000 citizens)and the 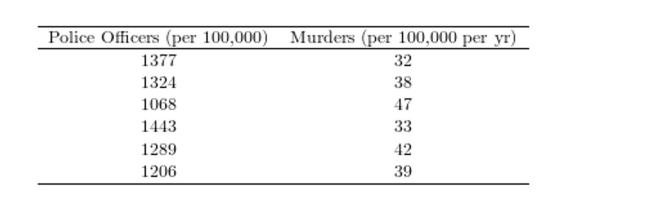 Compute the correlation coefficient between the per capita number of police officers and the per capita murder rate.
A)-0.900
B)0.810
C)-0.810
D)-0.846
Compute the correlation coefficient between the per capita number of police officers and the per capita murder rate.A)-0.900
B)0.810
C)-0.810
D)-0.846
سؤال
Compute the least-squares regression line for predicting y from x given the followingsummary statistics: ) 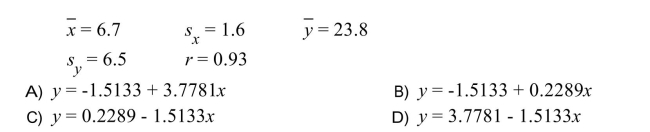
سؤال
One of the primary feeds for beef cattle is corn. ) 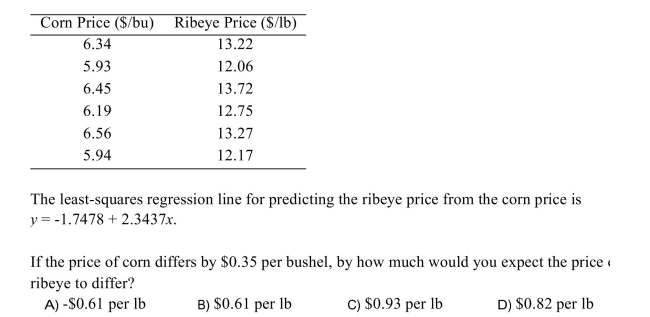
سؤال
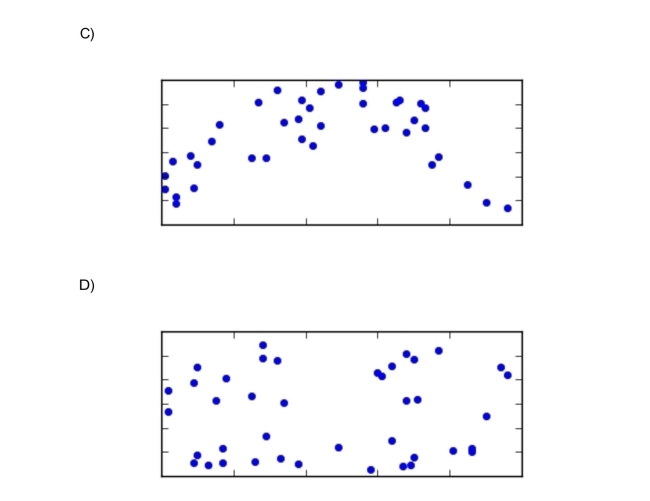
For which of the following scatter plots is the correlation coefficient an appropriatesummary? 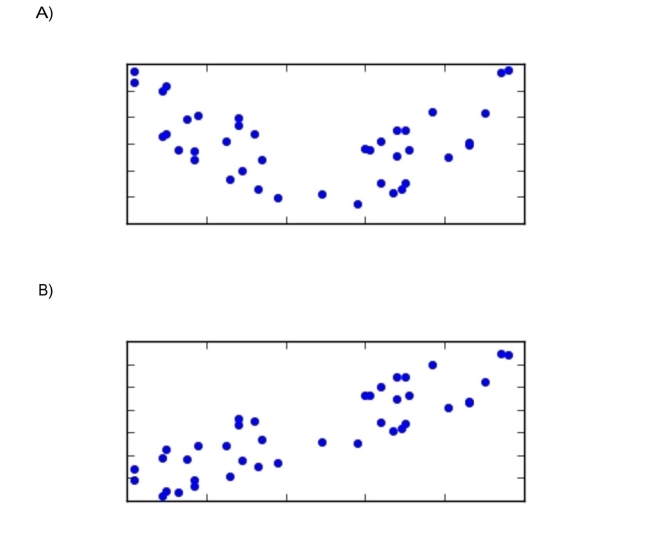
سؤال
One of the primary feeds for beef cattle is corn. ) 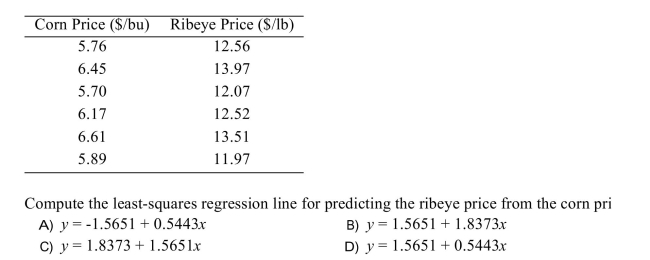
سؤال
The common cricket can be used as a crude thermometer. ) 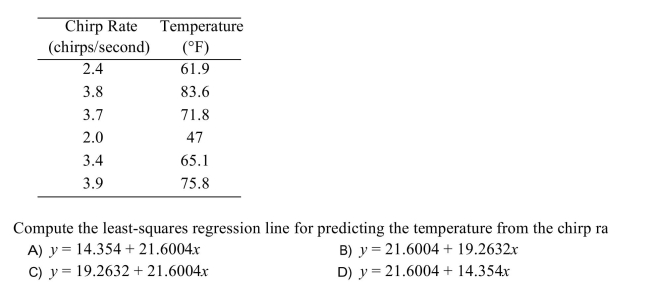
سؤال
One of the primary feeds for beef cattle is corn. ) 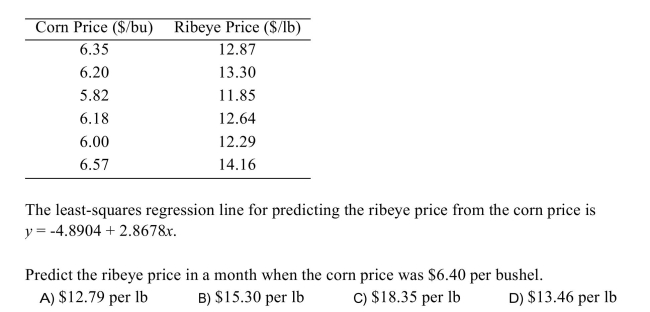
سؤال
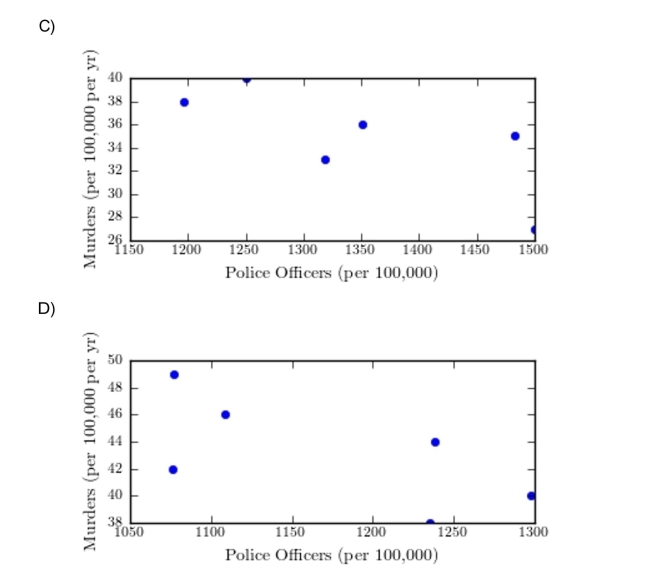
The following table presents the number of police officers (per 100,000 citizens)and the 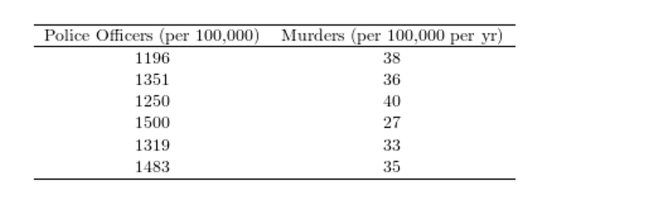 Construct a scatter plot of the per capita murder rate (y)versus the per capita number of police officers (x).
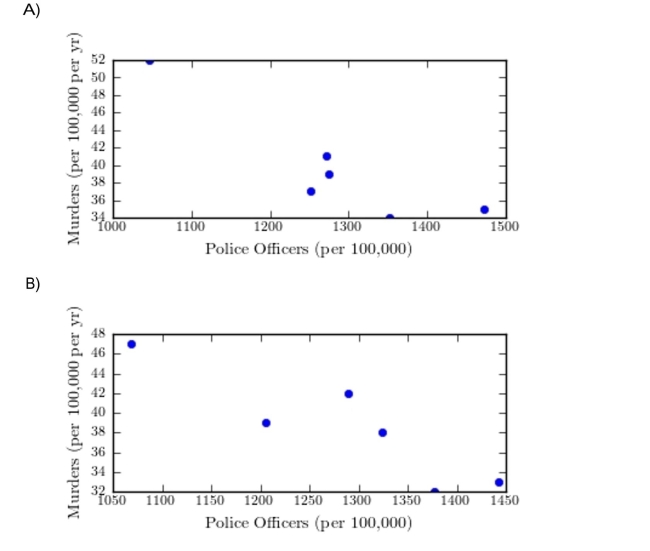
Construct a scatter plot of the per capita murder rate (y)versus the per capita number of police officers (x). سؤال
The following table presents the number of police officers (per 100,000 citizens)and the 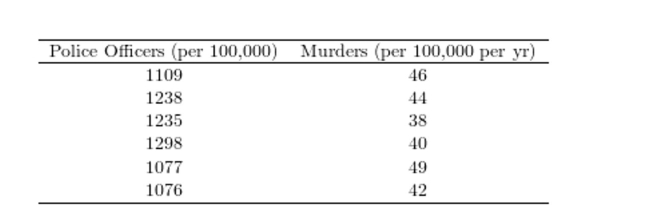 The correlation coefficient between the per capita number of police officers and the per capita murder rates -0.666. Which of the following is the best interpretation of the correlation
Coefficient?
A)Higher murder rates make it more difficult for cities to hire police officers.
B)The per capita number of police officers and the per capita murder rates arepositively associated.
C)More per capita police officers results in fewer per capita murders.
D)The per capita murder rate tends to go down as the per capita number of policeofficers goes up.
The correlation coefficient between the per capita number of police officers and the per capita murder rates -0.666. Which of the following is the best interpretation of the correlationCoefficient?
A)Higher murder rates make it more difficult for cities to hire police officers.
B)The per capita number of police officers and the per capita murder rates arepositively associated.
C)More per capita police officers results in fewer per capita murders.
D)The per capita murder rate tends to go down as the per capita number of policeofficers goes up.
سؤال
The following display from a graphing calculator presents the least-squares regression 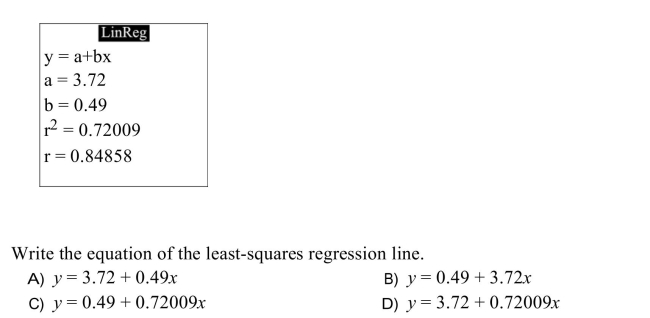
سؤال
Compute the least-squares regression line for the given data set. 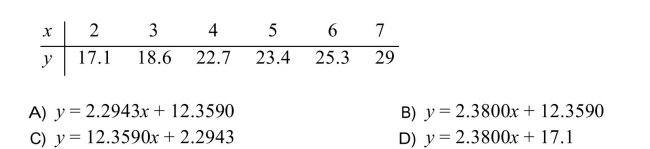
سؤال
The following display from a graphing calculator presents the least-squares regression 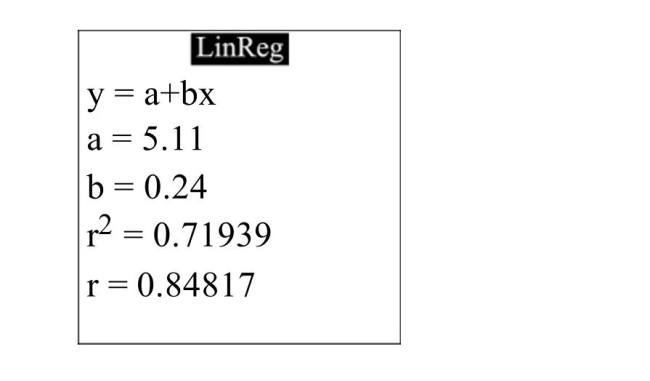 What is the correlation between the oil price and the commodity price?
A)5.11
B)0.24
C)0.71939
D)0.84817
What is the correlation between the oil price and the commodity price?A)5.11
B)0.24
C)0.71939
D)0.84817
سؤال
The common cricket can be used as a crude thermometer. ) 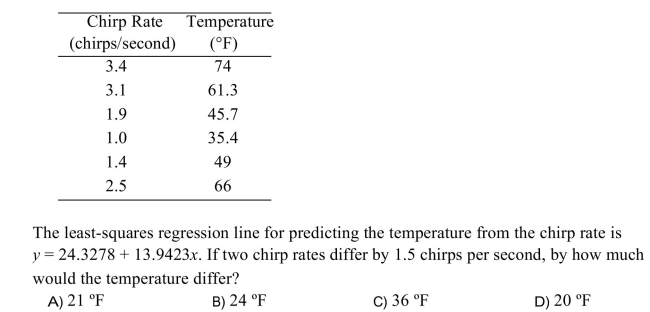
سؤال
The common cricket can be used as a crude thermometer. ) 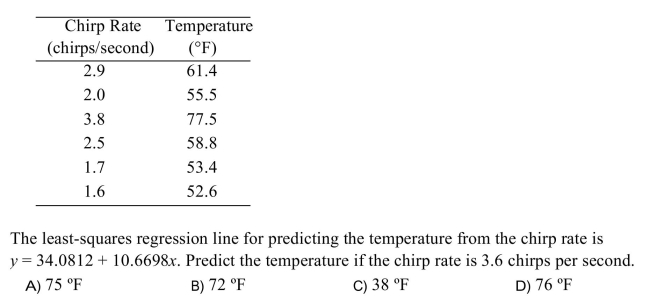
سؤال
One of the primary feeds for beef cattle is corn. ) 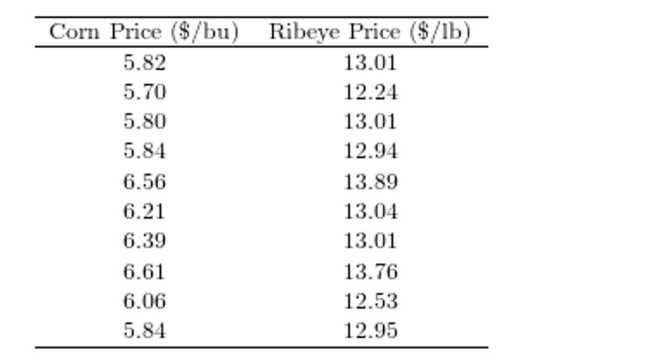 Compute the correlation coefficient between the corn price and the ribeye price.
A)0.815
B)0.965
C)0.664
D)0.185
Compute the correlation coefficient between the corn price and the ribeye price.A)0.815
B)0.965
C)0.664
D)0.185
سؤال
An automotive engineer computed a least-squares regression line for predicting the gas mileage 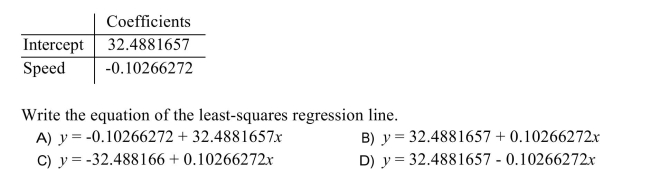
سؤال
For the following data set,) 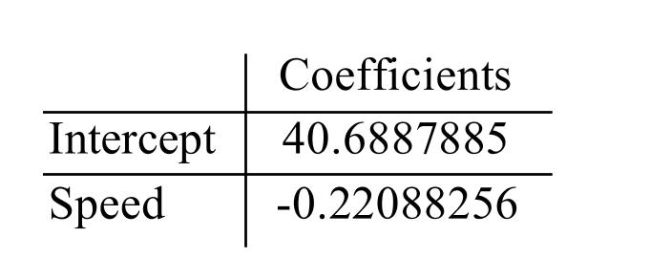
A)9.7%
B)68.9%
C)31.1%
D)90.3%
A)9.7%
B)68.9%
C)31.1%
D)90.3%
سؤال
For the following data set,) 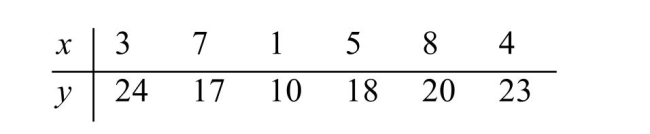
A)0.594
B)0.835
C)0.165
D)0.406
A)0.594
B)0.835
C)0.165
D)0.406
سؤال
An automotive engineer computed a least-squares regression line for predicting the gas mileage 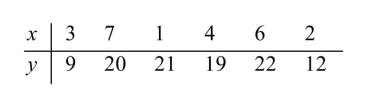 Predict the gas mileage when the vehicle is traveling at 60 mph.
A)24.3 mpg
B)27 mpg
C)54 mpg
D)30 mpg
Predict the gas mileage when the vehicle is traveling at 60 mph.A)24.3 mpg
B)27 mpg
C)54 mpg
D)30 mpg
سؤال
The following MINITAB output presents the lest squares regression line for predicting the price of 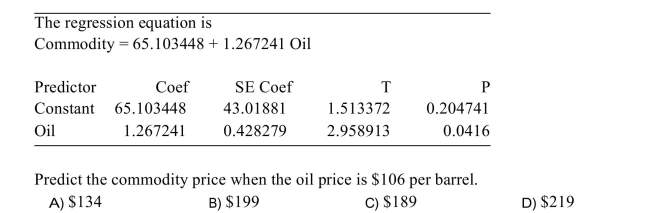
سؤال
As with many other construction materials,) 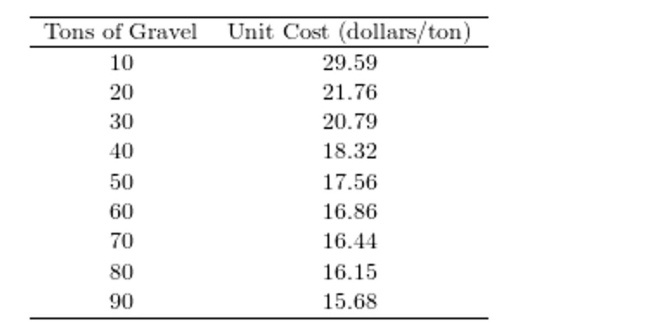 Which of the following graphs is the correct residual plot for the data set? (Hint: )
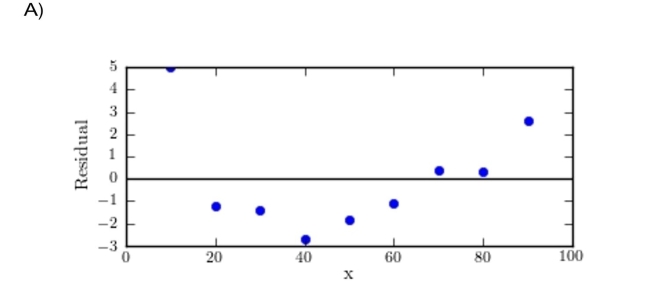
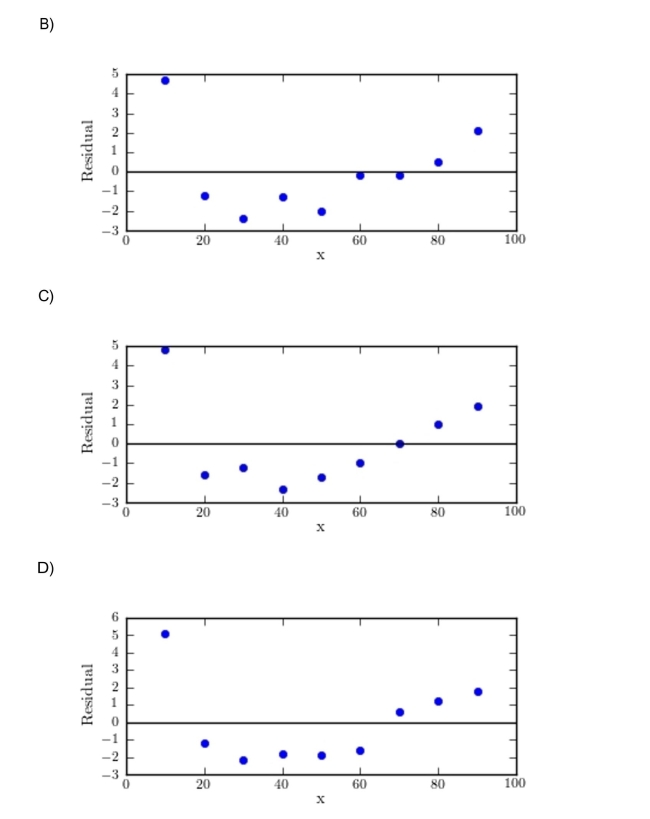
Which of the following graphs is the correct residual plot for the data set? (Hint: ) سؤال
The following MINITAB output presents the least squares regression line for predicting the price 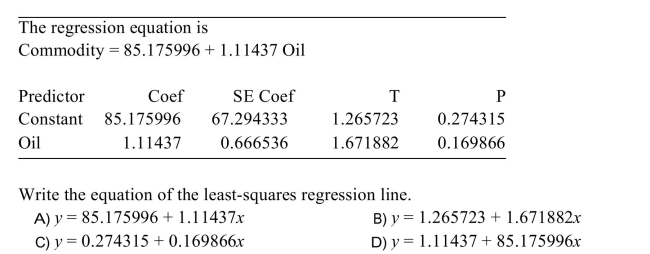
سؤال
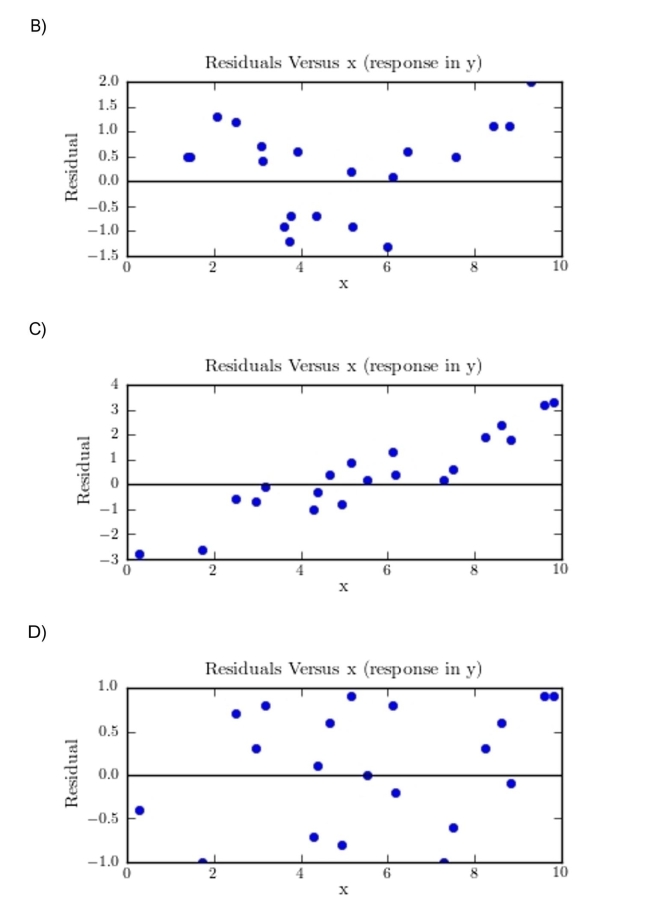
MINITAB-style residual plots are shown below. ) 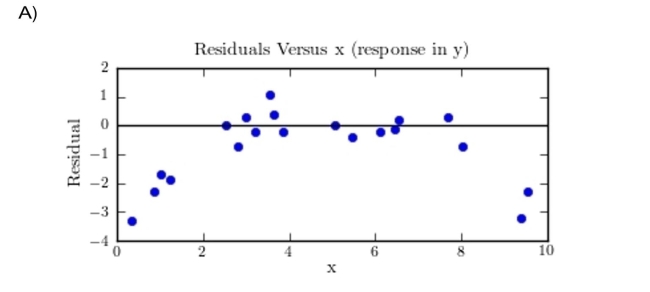
سؤال
Of points 1,) 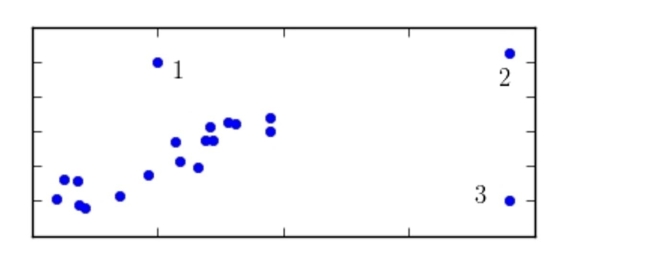
A)point 2
B)point 3
C)All have the same influence.
D)point 1
A)point 2
B)point 3
C)All have the same influence.
D)point 1
سؤال
As with many other construction materials,)  Compute the coefficient of determination.
A)0.8270
B)-0.9094
C)-0.0906
D)0.1730
Compute the coefficient of determination.A)0.8270
B)-0.9094
C)-0.0906
D)0.1730

فتح الحزمة
قم بالتسجيل لفتح البطاقات في هذه المجموعة!
Unlock Deck
Unlock Deck
1/30
العب
ملء الشاشة (f)
Deck 4: Probability
1
One of the primary feeds for beef cattle is corn. ) The correlation coefficient between the corn price and the ribeye price is 0.773. Which of the following is the best interpretation of the correlation coefficient?
A)The price of ribeye tends to go down and the price of corn goes up.
B)Increasing corn prices cause ribeye prices to increase.
C)The changes in corn price and ribeye price tend to go up and down together.
D)There is no correlation between the price of corn and the price of ribeye.
The correlation coefficient between the corn price and the ribeye price is 0.773. Which of the following is the best interpretation of the correlation coefficient?A)The price of ribeye tends to go down and the price of corn goes up.
B)Increasing corn prices cause ribeye prices to increase.
C)The changes in corn price and ribeye price tend to go up and down together.
D)There is no correlation between the price of corn and the price of ribeye.
C
2
The following display from a graphing calculator presents the least-squares regression Predict the commodity price when oil costs $107 per barrel.
A)$20
B)$44
C)$485
D)$70
Predict the commodity price when oil costs $107 per barrel.A)$20
B)$44
C)$485
D)$70
A
3
Characterize the relationship shown in the figure. )
A)negative nonlinear
B)positive nonlinear
C)negative linear
D)positive linear
A)negative nonlinear
B)positive nonlinear
C)negative linear
D)positive linear
B
4
One of the primary feeds for beef cattle is corn. ) Construct a scatter plot of the price of ribeye (y)versus the price of corn (x). 2
Construct a scatter plot of the price of ribeye (y)versus the price of corn (x). 2 فتح الحزمة
افتح القفل للوصول البطاقات البالغ عددها 30 في هذه المجموعة.
فتح الحزمة
k this deck
5
Compute the correlation coefficient.
A)0.809
B)0.899
C)48.99
D)0.101
A)0.809
B)0.899
C)48.99
D)0.101
فتح الحزمة
افتح القفل للوصول البطاقات البالغ عددها 30 في هذه المجموعة.
فتح الحزمة
k this deck
6
The following table presents the number of police officers (per 100,000 citizens)and the Compute the correlation coefficient between the per capita number of police officers and the per capita murder rate.
A)-0.900
B)0.810
C)-0.810
D)-0.846
Compute the correlation coefficient between the per capita number of police officers and the per capita murder rate.A)-0.900
B)0.810
C)-0.810
D)-0.846
فتح الحزمة
افتح القفل للوصول البطاقات البالغ عددها 30 في هذه المجموعة.
فتح الحزمة
k this deck
7
Compute the least-squares regression line for predicting y from x given the followingsummary statistics: )
فتح الحزمة
افتح القفل للوصول البطاقات البالغ عددها 30 في هذه المجموعة.
فتح الحزمة
k this deck
8
One of the primary feeds for beef cattle is corn. )
فتح الحزمة
افتح القفل للوصول البطاقات البالغ عددها 30 في هذه المجموعة.
فتح الحزمة
k this deck
9
For which of the following scatter plots is the correlation coefficient an appropriatesummary?
فتح الحزمة
افتح القفل للوصول البطاقات البالغ عددها 30 في هذه المجموعة.
فتح الحزمة
k this deck
10
One of the primary feeds for beef cattle is corn. )
فتح الحزمة
افتح القفل للوصول البطاقات البالغ عددها 30 في هذه المجموعة.
فتح الحزمة
k this deck
11
The common cricket can be used as a crude thermometer. )
فتح الحزمة
افتح القفل للوصول البطاقات البالغ عددها 30 في هذه المجموعة.
فتح الحزمة
k this deck
12
One of the primary feeds for beef cattle is corn. )
فتح الحزمة
افتح القفل للوصول البطاقات البالغ عددها 30 في هذه المجموعة.
فتح الحزمة
k this deck
13
The following table presents the number of police officers (per 100,000 citizens)and the Construct a scatter plot of the per capita murder rate (y)versus the per capita number of police officers (x).
Construct a scatter plot of the per capita murder rate (y)versus the per capita number of police officers (x). فتح الحزمة
افتح القفل للوصول البطاقات البالغ عددها 30 في هذه المجموعة.
فتح الحزمة
k this deck
14
The following table presents the number of police officers (per 100,000 citizens)and the The correlation coefficient between the per capita number of police officers and the per capita murder rates -0.666. Which of the following is the best interpretation of the correlation
Coefficient?
A)Higher murder rates make it more difficult for cities to hire police officers.
B)The per capita number of police officers and the per capita murder rates arepositively associated.
C)More per capita police officers results in fewer per capita murders.
D)The per capita murder rate tends to go down as the per capita number of policeofficers goes up.
The correlation coefficient between the per capita number of police officers and the per capita murder rates -0.666. Which of the following is the best interpretation of the correlationCoefficient?
A)Higher murder rates make it more difficult for cities to hire police officers.
B)The per capita number of police officers and the per capita murder rates arepositively associated.
C)More per capita police officers results in fewer per capita murders.
D)The per capita murder rate tends to go down as the per capita number of policeofficers goes up.
فتح الحزمة
افتح القفل للوصول البطاقات البالغ عددها 30 في هذه المجموعة.
فتح الحزمة
k this deck
15
The following display from a graphing calculator presents the least-squares regression
فتح الحزمة
افتح القفل للوصول البطاقات البالغ عددها 30 في هذه المجموعة.
فتح الحزمة
k this deck
16
Compute the least-squares regression line for the given data set.
فتح الحزمة
افتح القفل للوصول البطاقات البالغ عددها 30 في هذه المجموعة.
فتح الحزمة
k this deck
17
The following display from a graphing calculator presents the least-squares regression What is the correlation between the oil price and the commodity price?
A)5.11
B)0.24
C)0.71939
D)0.84817
What is the correlation between the oil price and the commodity price?A)5.11
B)0.24
C)0.71939
D)0.84817
فتح الحزمة
افتح القفل للوصول البطاقات البالغ عددها 30 في هذه المجموعة.
فتح الحزمة
k this deck
18
The common cricket can be used as a crude thermometer. )
فتح الحزمة
افتح القفل للوصول البطاقات البالغ عددها 30 في هذه المجموعة.
فتح الحزمة
k this deck
19
The common cricket can be used as a crude thermometer. )
فتح الحزمة
افتح القفل للوصول البطاقات البالغ عددها 30 في هذه المجموعة.
فتح الحزمة
k this deck
20
One of the primary feeds for beef cattle is corn. ) Compute the correlation coefficient between the corn price and the ribeye price.
A)0.815
B)0.965
C)0.664
D)0.185
Compute the correlation coefficient between the corn price and the ribeye price.A)0.815
B)0.965
C)0.664
D)0.185
فتح الحزمة
افتح القفل للوصول البطاقات البالغ عددها 30 في هذه المجموعة.
فتح الحزمة
k this deck
21
An automotive engineer computed a least-squares regression line for predicting the gas mileage
فتح الحزمة
افتح القفل للوصول البطاقات البالغ عددها 30 في هذه المجموعة.
فتح الحزمة
k this deck
22
For the following data set,)
A)9.7%
B)68.9%
C)31.1%
D)90.3%
A)9.7%
B)68.9%
C)31.1%
D)90.3%
فتح الحزمة
افتح القفل للوصول البطاقات البالغ عددها 30 في هذه المجموعة.
فتح الحزمة
k this deck
23
For the following data set,)
A)0.594
B)0.835
C)0.165
D)0.406
A)0.594
B)0.835
C)0.165
D)0.406
فتح الحزمة
افتح القفل للوصول البطاقات البالغ عددها 30 في هذه المجموعة.
فتح الحزمة
k this deck
24
An automotive engineer computed a least-squares regression line for predicting the gas mileage Predict the gas mileage when the vehicle is traveling at 60 mph.
A)24.3 mpg
B)27 mpg
C)54 mpg
D)30 mpg
Predict the gas mileage when the vehicle is traveling at 60 mph.A)24.3 mpg
B)27 mpg
C)54 mpg
D)30 mpg
فتح الحزمة
افتح القفل للوصول البطاقات البالغ عددها 30 في هذه المجموعة.
فتح الحزمة
k this deck
25
The following MINITAB output presents the lest squares regression line for predicting the price of
فتح الحزمة
افتح القفل للوصول البطاقات البالغ عددها 30 في هذه المجموعة.
فتح الحزمة
k this deck
26
As with many other construction materials,) Which of the following graphs is the correct residual plot for the data set? (Hint: )
Which of the following graphs is the correct residual plot for the data set? (Hint: ) فتح الحزمة
افتح القفل للوصول البطاقات البالغ عددها 30 في هذه المجموعة.
فتح الحزمة
k this deck
27
The following MINITAB output presents the least squares regression line for predicting the price
فتح الحزمة
افتح القفل للوصول البطاقات البالغ عددها 30 في هذه المجموعة.
فتح الحزمة
k this deck
28
MINITAB-style residual plots are shown below. )
فتح الحزمة
افتح القفل للوصول البطاقات البالغ عددها 30 في هذه المجموعة.
فتح الحزمة
k this deck
29
Of points 1,)
A)point 2
B)point 3
C)All have the same influence.
D)point 1
A)point 2
B)point 3
C)All have the same influence.
D)point 1
فتح الحزمة
افتح القفل للوصول البطاقات البالغ عددها 30 في هذه المجموعة.
فتح الحزمة
k this deck
30
As with many other construction materials,) Compute the coefficient of determination.
A)0.8270
B)-0.9094
C)-0.0906
D)0.1730
Compute the coefficient of determination.A)0.8270
B)-0.9094
C)-0.0906
D)0.1730
فتح الحزمة
افتح القفل للوصول البطاقات البالغ عددها 30 في هذه المجموعة.
فتح الحزمة
k this deck
فتح الحزمة
افتح القفل للوصول البطاقات البالغ عددها 30 في هذه المجموعة.


