Deck 20: Visual Analysis of Single-System Design Data
ملء الشاشة (f)
سؤال
The pattern of this chart shows: 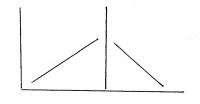
A) Change in slope, no change in trend across phases
B) Drift and change in level
C) Change in slope, change in level
D) None of the above
A) Change in slope, no change in trend across phases
B) Drift and change in level
C) Change in slope, change in level
D) None of the above
سؤال
The pattern of this chart shows: 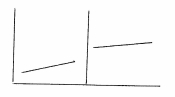
A) Change in slope
B) Drift and change in level
C) No change in level but change in slope
D) None of the above.
A) Change in slope
B) Drift and change in level
C) No change in level but change in slope
D) None of the above.
سؤال
سؤال
سؤال
سؤال
سؤال

فتح الحزمة
قم بالتسجيل لفتح البطاقات في هذه المجموعة!
Unlock Deck
Unlock Deck
1/7
العب
ملء الشاشة (f)
Deck 20: Visual Analysis of Single-System Design Data
1
The pattern of this chart shows:
A) Change in slope, no change in trend across phases
B) Drift and change in level
C) Change in slope, change in level
D) None of the above
A) Change in slope, no change in trend across phases
B) Drift and change in level
C) Change in slope, change in level
D) None of the above
A
2
The pattern of this chart shows:
A) Change in slope
B) Drift and change in level
C) No change in level but change in slope
D) None of the above.
A) Change in slope
B) Drift and change in level
C) No change in level but change in slope
D) None of the above.
B
3
Directionality in the data-whether within or across phases-is called slope.
False
4
Visual analysis of data is particularly reliable because one does not have to be concerned about the possibility of autocorrelation.
فتح الحزمة
افتح القفل للوصول البطاقات البالغ عددها 7 في هذه المجموعة.
فتح الحزمة
k this deck
5
Can you have a stable trend if the line made up of linked data points is continuously up and down? Draw a diagram indicating your answer.
فتح الحزمة
افتح القفل للوصول البطاقات البالغ عددها 7 في هذه المجموعة.
فتح الحزمة
k this deck
6
What do you make of a situation where the client's behavior changes from bad to good to bad during baseline? Should you start the intervention with a sense of stability, if curvilinear, behaviors?
فتح الحزمة
افتح القفل للوصول البطاقات البالغ عددها 7 في هذه المجموعة.
فتح الحزمة
k this deck
7
Trend across phases is called:
A) Variability
B) Slope
C) Drift
D) None of the above
A) Variability
B) Slope
C) Drift
D) None of the above
فتح الحزمة
افتح القفل للوصول البطاقات البالغ عددها 7 في هذه المجموعة.
فتح الحزمة
k this deck
فتح الحزمة
افتح القفل للوصول البطاقات البالغ عددها 7 في هذه المجموعة.


