Deck 11: Standard Multiple Regression
ملء الشاشة (f)
سؤال
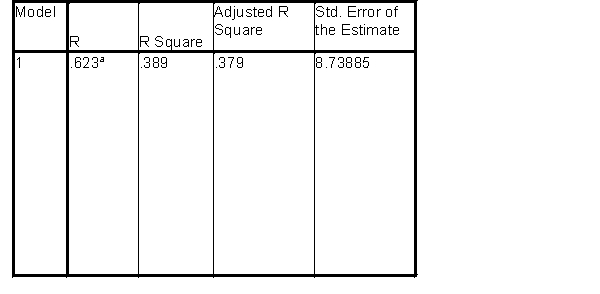
Questions relate to the following output which is from a Standard Multiple Regression where the researchers wished to assess the contribution of stress and stigma to depression.
Model Summary
a.Predictors: Constant), total of perceived stress, total of Stigma for neurological conditions
 ANOVAb
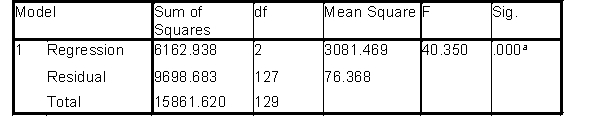 a.Predictors: Constant), total of perceived stress, total of Stigma for neurological conditions
b.Dependent Variable: total of CES-D depression
Coefficientsa
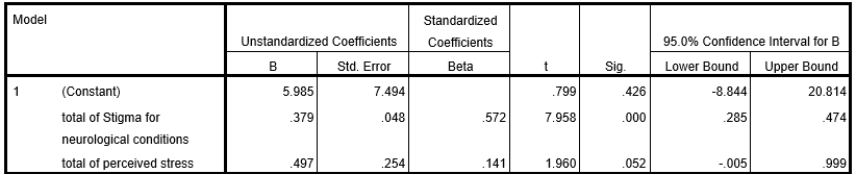 a.Dependent Variable: total of CES-D depression
Which of the following is the most appropriate answer?
A)The confidence interval for perceived stress encompasses zero, meaning that we cannot be sure whether the true population regression slope is negative, zero, or positive
B)The confidence interval for perceived stress encompasses zero but as the sample regression slope is .497 and is significant at p=.05, we can be 95% certain that it is positive in the general population
C)The confidence interval for stigma is such that we cannot be sure whether the true population regression slope is negative, zero, or positive
D)The contribution of stigma and stress together to depression is non-significant
Model Summary
a.Predictors: Constant), total of perceived stress, total of Stigma for neurological conditions
ANOVAb a.Predictors: Constant), total of perceived stress, total of Stigma for neurological conditionsb.Dependent Variable: total of CES-D depression
Coefficientsa
a.Dependent Variable: total of CES-D depressionWhich of the following is the most appropriate answer?
A)The confidence interval for perceived stress encompasses zero, meaning that we cannot be sure whether the true population regression slope is negative, zero, or positive
B)The confidence interval for perceived stress encompasses zero but as the sample regression slope is .497 and is significant at p=.05, we can be 95% certain that it is positive in the general population
C)The confidence interval for stigma is such that we cannot be sure whether the true population regression slope is negative, zero, or positive
D)The contribution of stigma and stress together to depression is non-significant
سؤال
سؤال
سؤال
سؤال
Questions relate to the following output which is from a Standard Multiple Regression where the researchers wished to assess the contribution of stress and stigma to depression.
Model Summary
a.Predictors: Constant), total of perceived stress, total of Stigma for neurological conditions
ANOVAb
a.Predictors: Constant), total of perceived stress, total of Stigma for neurological conditions
b.Dependent Variable: total of CES-D depression
Coefficientsa
a.Dependent Variable: total of CES-D depression
Stress and stigma together predicted depression
A)extremely well, accounting for approximately 62% of the variation in depression scores
B)very poorly, accounting for approximately 9% of the variation in depression scores
C)well, accounting for approximately 38% of the variation in depression scores
D)none of the above
Model Summary
a.Predictors: Constant), total of perceived stress, total of Stigma for neurological conditions
ANOVAb a.Predictors: Constant), total of perceived stress, total of Stigma for neurological conditionsb.Dependent Variable: total of CES-D depression
Coefficientsa
a.Dependent Variable: total of CES-D depressionStress and stigma together predicted depression
A)extremely well, accounting for approximately 62% of the variation in depression scores
B)very poorly, accounting for approximately 9% of the variation in depression scores
C)well, accounting for approximately 38% of the variation in depression scores
D)none of the above
سؤال
سؤال
Questions relate to the following output which is from a Standard Multiple Regression where the researchers wished to assess the contribution of stress and stigma to depression.
Model Summary
a.Predictors: Constant), total of perceived stress, total of Stigma for neurological conditions
ANOVAb
a.Predictors: Constant), total of perceived stress, total of Stigma for neurological conditions
b.Dependent Variable: total of CES-D depression
Coefficientsa
a.Dependent Variable: total of CES-D depression
The regression equation is:
A)depression = .497stress) + .379stigma) + 5.985
B)depression = .141stress) + .572stigma) + 5.985
C)depression = .254stress) + .048stigma) + 5.985
D)none of the above
Model Summary
a.Predictors: Constant), total of perceived stress, total of Stigma for neurological conditions
ANOVAb a.Predictors: Constant), total of perceived stress, total of Stigma for neurological conditionsb.Dependent Variable: total of CES-D depression
Coefficientsa
a.Dependent Variable: total of CES-D depressionThe regression equation is:
A)depression = .497stress) + .379stigma) + 5.985
B)depression = .141stress) + .572stigma) + 5.985
C)depression = .254stress) + .048stigma) + 5.985
D)none of the above
سؤال
سؤال
Questions relate to the following output which is from a Standard Multiple Regression where the researchers wished to assess the contribution of stress and stigma to depression.
Model Summary
a.Predictors: Constant), total of perceived stress, total of Stigma for neurological conditions
ANOVAb
a.Predictors: Constant), total of perceived stress, total of Stigma for neurological conditions
b.Dependent Variable: total of CES-D depression
Coefficientsa
a.Dependent Variable: total of CES-D depression
Which is the most appropriate answer? For every one
A)standard deviation increase in stigma, depression increased by over half a standard deviation
B)unit increase in stigma, depression increased by just under half a standard deviation
C)standard deviation increase in stress, depression decreased by a quarter of a standard deviation
D)unit increase in stigma, depression increased by 49%
Model Summary
a.Predictors: Constant), total of perceived stress, total of Stigma for neurological conditions
ANOVAb a.Predictors: Constant), total of perceived stress, total of Stigma for neurological conditionsb.Dependent Variable: total of CES-D depression
Coefficientsa
a.Dependent Variable: total of CES-D depressionWhich is the most appropriate answer? For every one
A)standard deviation increase in stigma, depression increased by over half a standard deviation
B)unit increase in stigma, depression increased by just under half a standard deviation
C)standard deviation increase in stress, depression decreased by a quarter of a standard deviation
D)unit increase in stigma, depression increased by 49%
سؤال

فتح الحزمة
قم بالتسجيل لفتح البطاقات في هذه المجموعة!
Unlock Deck
Unlock Deck
1/10
العب
ملء الشاشة (f)
Deck 11: Standard Multiple Regression
1
Questions relate to the following output which is from a Standard Multiple Regression where the researchers wished to assess the contribution of stress and stigma to depression.
Model Summary
a.Predictors: Constant), total of perceived stress, total of Stigma for neurological conditions
ANOVAb
a.Predictors: Constant), total of perceived stress, total of Stigma for neurological conditions
b.Dependent Variable: total of CES-D depression
Coefficientsa
a.Dependent Variable: total of CES-D depression
Which of the following is the most appropriate answer?
A)The confidence interval for perceived stress encompasses zero, meaning that we cannot be sure whether the true population regression slope is negative, zero, or positive
B)The confidence interval for perceived stress encompasses zero but as the sample regression slope is .497 and is significant at p=.05, we can be 95% certain that it is positive in the general population
C)The confidence interval for stigma is such that we cannot be sure whether the true population regression slope is negative, zero, or positive
D)The contribution of stigma and stress together to depression is non-significant
Model Summary
a.Predictors: Constant), total of perceived stress, total of Stigma for neurological conditions
ANOVAb a.Predictors: Constant), total of perceived stress, total of Stigma for neurological conditionsb.Dependent Variable: total of CES-D depression
Coefficientsa
a.Dependent Variable: total of CES-D depressionWhich of the following is the most appropriate answer?
A)The confidence interval for perceived stress encompasses zero, meaning that we cannot be sure whether the true population regression slope is negative, zero, or positive
B)The confidence interval for perceived stress encompasses zero but as the sample regression slope is .497 and is significant at p=.05, we can be 95% certain that it is positive in the general population
C)The confidence interval for stigma is such that we cannot be sure whether the true population regression slope is negative, zero, or positive
D)The contribution of stigma and stress together to depression is non-significant
The confidence interval for perceived stress encompasses zero, meaning that we cannot be sure whether the true population regression slope is negative, zero, or positive
2
In a multiple regression analysis which of the following allows us to compare the predictor variables on a like-for-like basis?
A)Beta β)
B)The unstandardised b weights
C)The constant
D)None of the above
A)Beta β)
B)The unstandardised b weights
C)The constant
D)None of the above
Beta β)
3
Assume you have carried out a Standard Multiple Regression in which the Multiple R is found to be high, but none of the predictor variables are, individually, statistically significant.The most likely reason for this is:
A)the predictor variables show low correlations amongst themselves
B)the Multiple R has been incorrectly calculated
C)the predictor variables are highly correlated with each other
D)any of the above
A)the predictor variables show low correlations amongst themselves
B)the Multiple R has been incorrectly calculated
C)the predictor variables are highly correlated with each other
D)any of the above
the predictor variables are highly correlated with each other
4
When you look at the individual results in a standard multiple regression, the results represent
A)all of the shared variance between the predictor variables and the criterion
B)all the shared and unique variance between the predictor variables and the criterion
C)the unique variance only
D)the shared variance only
A)all of the shared variance between the predictor variables and the criterion
B)all the shared and unique variance between the predictor variables and the criterion
C)the unique variance only
D)the shared variance only
فتح الحزمة
افتح القفل للوصول البطاقات البالغ عددها 10 في هذه المجموعة.
فتح الحزمة
k this deck
5
Questions relate to the following output which is from a Standard Multiple Regression where the researchers wished to assess the contribution of stress and stigma to depression.
Model Summary
a.Predictors: Constant), total of perceived stress, total of Stigma for neurological conditions
ANOVAb
a.Predictors: Constant), total of perceived stress, total of Stigma for neurological conditions
b.Dependent Variable: total of CES-D depression
Coefficientsa
a.Dependent Variable: total of CES-D depression
Stress and stigma together predicted depression
A)extremely well, accounting for approximately 62% of the variation in depression scores
B)very poorly, accounting for approximately 9% of the variation in depression scores
C)well, accounting for approximately 38% of the variation in depression scores
D)none of the above
Model Summary
a.Predictors: Constant), total of perceived stress, total of Stigma for neurological conditions
ANOVAb a.Predictors: Constant), total of perceived stress, total of Stigma for neurological conditionsb.Dependent Variable: total of CES-D depression
Coefficientsa
a.Dependent Variable: total of CES-D depressionStress and stigma together predicted depression
A)extremely well, accounting for approximately 62% of the variation in depression scores
B)very poorly, accounting for approximately 9% of the variation in depression scores
C)well, accounting for approximately 38% of the variation in depression scores
D)none of the above
فتح الحزمة
افتح القفل للوصول البطاقات البالغ عددها 10 في هذه المجموعة.
فتح الحزمة
k this deck
6
If, for a multiple regression, you have many variables and not enough participants in the analysis, then the statistics will be:
A)pessimistic, they may fit the sample very well, but might not generalise to the population
B)pessimistic, they may not fit the sample very well and they will not generalise to the population
C)optimistic, they may not fit the sample very well but they will generalise to the population
D)optimistic, they may fit the sample very well, but might not generalise to the population
فتح الحزمة
افتح القفل للوصول البطاقات البالغ عددها 10 في هذه المجموعة.
فتح الحزمة
k this deck
7
Questions relate to the following output which is from a Standard Multiple Regression where the researchers wished to assess the contribution of stress and stigma to depression.
Model Summary
a.Predictors: Constant), total of perceived stress, total of Stigma for neurological conditions
ANOVAb
a.Predictors: Constant), total of perceived stress, total of Stigma for neurological conditions
b.Dependent Variable: total of CES-D depression
Coefficientsa
a.Dependent Variable: total of CES-D depression
The regression equation is:
A)depression = .497stress) + .379stigma) + 5.985
B)depression = .141stress) + .572stigma) + 5.985
C)depression = .254stress) + .048stigma) + 5.985
D)none of the above
Model Summary
a.Predictors: Constant), total of perceived stress, total of Stigma for neurological conditions
ANOVAb a.Predictors: Constant), total of perceived stress, total of Stigma for neurological conditionsb.Dependent Variable: total of CES-D depression
Coefficientsa
a.Dependent Variable: total of CES-D depressionThe regression equation is:
A)depression = .497stress) + .379stigma) + 5.985
B)depression = .141stress) + .572stigma) + 5.985
C)depression = .254stress) + .048stigma) + 5.985
D)none of the above
فتح الحزمة
افتح القفل للوصول البطاقات البالغ عددها 10 في هذه المجموعة.
فتح الحزمة
k this deck
8
Tabachnick and Fidell 2009) have a formula in order to calculate how many participants are needed to ensure a reliable multiple regression analysis.What is the formula?
A)104 8m where m is the number of criterion variables
B)104 8m where m is the number of predictor variables
C)110 7m where m is the number of criterion variables
D)110 7 m where m is the number of predictor variables
A)104 8m where m is the number of criterion variables
B)104 8m where m is the number of predictor variables
C)110 7m where m is the number of criterion variables
D)110 7 m where m is the number of predictor variables
فتح الحزمة
افتح القفل للوصول البطاقات البالغ عددها 10 في هذه المجموعة.
فتح الحزمة
k this deck
9
Questions relate to the following output which is from a Standard Multiple Regression where the researchers wished to assess the contribution of stress and stigma to depression.
Model Summary
a.Predictors: Constant), total of perceived stress, total of Stigma for neurological conditions
ANOVAb
a.Predictors: Constant), total of perceived stress, total of Stigma for neurological conditions
b.Dependent Variable: total of CES-D depression
Coefficientsa
a.Dependent Variable: total of CES-D depression
Which is the most appropriate answer? For every one
A)standard deviation increase in stigma, depression increased by over half a standard deviation
B)unit increase in stigma, depression increased by just under half a standard deviation
C)standard deviation increase in stress, depression decreased by a quarter of a standard deviation
D)unit increase in stigma, depression increased by 49%
Model Summary
a.Predictors: Constant), total of perceived stress, total of Stigma for neurological conditions
ANOVAb a.Predictors: Constant), total of perceived stress, total of Stigma for neurological conditionsb.Dependent Variable: total of CES-D depression
Coefficientsa
a.Dependent Variable: total of CES-D depressionWhich is the most appropriate answer? For every one
A)standard deviation increase in stigma, depression increased by over half a standard deviation
B)unit increase in stigma, depression increased by just under half a standard deviation
C)standard deviation increase in stress, depression decreased by a quarter of a standard deviation
D)unit increase in stigma, depression increased by 49%
فتح الحزمة
افتح القفل للوصول البطاقات البالغ عددها 10 في هذه المجموعة.
فتح الحزمة
k this deck
10
Which of those below allows us to determine the slope of the regression lines for individual predictors?
A)Constant
B)b weights
C)Beta weights
D)Standard error
A)Constant
B)b weights
C)Beta weights
D)Standard error
فتح الحزمة
افتح القفل للوصول البطاقات البالغ عددها 10 في هذه المجموعة.
فتح الحزمة
k this deck
فتح الحزمة
افتح القفل للوصول البطاقات البالغ عددها 10 في هذه المجموعة.


